Significance
Simulated clouds over the Southern Ocean reflect too little solar radiation compared with observations, which results in errors in simulated surface temperatures and in many other important features of the climate system. Our results show that the radiative properties of the most biased types of clouds in cyclonic systems are highly sensitive to the concentration of ice-nucleating particles. The uniquely low concentrations of ice-nucleating particles in this remote marine environment strongly inhibit precipitation and allow much brighter clouds to be sustained.
Keywords: ice nucleation, clouds, Southern Ocean, mixed-phase, microphysics
Abstract
Large biases in climate model simulations of cloud radiative properties over the Southern Ocean cause large errors in modeled sea surface temperatures, atmospheric circulation, and climate sensitivity. Here, we combine cloud-resolving model simulations with estimates of the concentration of ice-nucleating particles in this region to show that our simulated Southern Ocean clouds reflect far more radiation than predicted by global models, in agreement with satellite observations. Specifically, we show that the clouds that are most sensitive to the concentration of ice-nucleating particles are low-level mixed-phase clouds in the cold sectors of extratropical cyclones, which have previously been identified as a main contributor to the Southern Ocean radiation bias. The very low ice-nucleating particle concentrations that prevail over the Southern Ocean strongly suppress cloud droplet freezing, reduce precipitation, and enhance cloud reflectivity. The results help explain why a strong radiation bias occurs mainly in this remote region away from major sources of ice-nucleating particles. The results present a substantial challenge to climate models to be able to simulate realistic ice-nucleating particle concentrations and their effects under specific meteorological conditions.
Comparisons between climate models and satellite observations over the Southern Ocean (SO) show that models generally simulate far too little reflection of shortwave (SW) radiation (1, 2). The excess SW absorption at the ocean surface is likely an important cause of the 2 K positive bias in the SO annual mean sea surface temperature observed in several models (3). This error has significant consequences for the ability of models to simulate sea ice, the jet stream, and storm track location (4) and can affect atmospheric energy transport (5–7). Most of the simulated radiative biases are associated with low and midlevel clouds containing supercooled droplets and ice (mixed-phase clouds) (2, 8), which dominate cloud radiative effects over the SO (9, 10).
Several potential causes of the radiative bias over the SO have been explored in global models, such as the representation of aerosols, which act as cloud condensation nuclei and affect droplet concentrations (11); issues with the model boundary layer physics (12); or treatment of the effects of small-scale turbulence in mixed-phase conditions that can enhance the generation of liquid water (13, 14), increasing slightly the amount of reflected radiation. It is known that mixed-phase clouds are a source of large uncertainty in climate model simulations, with important consequences for cloud feedbacks and climate sensitivity (15, 16). Examination of mixed-phase cloud properties in high-resolution models shows that the reflected SW radiation could be increased by 15% (17) through changes in the subgrid distributions of relative humidity used for the depositional growth of ice particles and through changes in the riming efficiency of ice crystals. These studies managed to increase the simulated amounts of cloud liquid water, making the clouds more reflective, but the bias problem has not been solved.
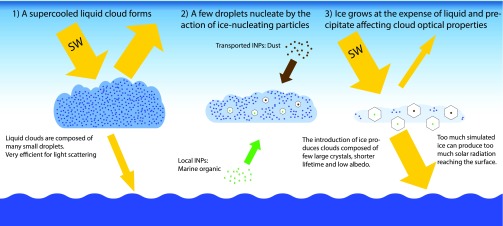
The introduction of ice in clouds leads to the depletion of supercooled liquid water via several microphysical pathways. Mixtures of supercooled liquid water and ice are thermodynamically unstable due to the lower-saturation vapor pressure of ice, which leads to rapid growth of ice particles at the expense of the droplets in what is known as the Wegener–Bergeron–Findeisen process. The larger ice crystals then precipitate while collecting smaller water droplets (riming process), which additionally depletes the liquid in the cloud. These changes in the composition of the cloud strongly affect its radiative properties. A schematic representation of the effect of ice-nucleating particles (INPs) on marine mixed-phase clouds is shown in Fig. 1. The top-of-atmosphere SW flux is affected on a global scale by the concentration of INPs (16, 18–20). However, it has not been established whether representing the low concentrations of INPs over the SO is quantitatively consistent with the behavior and radiative properties of the specific clouds that are known to be associated with the model observation radiative bias (2).
Fig. 1.
Schematic representation of the effect of INPs on marine mixed-phase clouds. Variations on the concentrations of INP both transported and emitted locally can strongly modify the evolution of low-level clouds by affecting the number of ice nucleation events. Each cloud represents a different time in the evolution of the cloud system. The yellow arrows represent radiative fluxes, the green arrow represents INP sources from below cloud, and the brown arrow represents INP sources from the free troposphere.
Here, we use information about INP concentrations and properties combined with a high-resolution numerical weather prediction model with a state-of-the-art double-moment bulk microphysics scheme to explore ice formation and the impact on the radiative properties of cyclonic systems over the SO. The double-moment microphysics scheme is required so that we can link the concentration of INP to the number concentration of ice crystals. Currently, most operational models (numerical weather prediction and climate) have single-moment microphysics, which predict mass mixing ratios only and are not able to directly link ice crystals number concentrations to INP. The high-resolution simulations are necessary so that we can resolve convection and the aerosol–cloud interactions explicitly, and are not affected by cloud microphysical assumptions made in convection parametrizations that would be active at coarser resolutions. The high-resolution domains in their current resolution should be able to represent many of the physical processes important for mixed-phase cloud microphysics, therefore resolving features such as the liquid and ice partitioning, which typically occur over a few kilometers horizontally in the midlatitudes (21) and have to be parameterized in low-resolution global models. We therefore reduce the effect of the subgrid assumptions relative to coarse global model resolutions regarding the ice–water partitioning (17), which is a major cause of uncertainty in global models (22, 23).
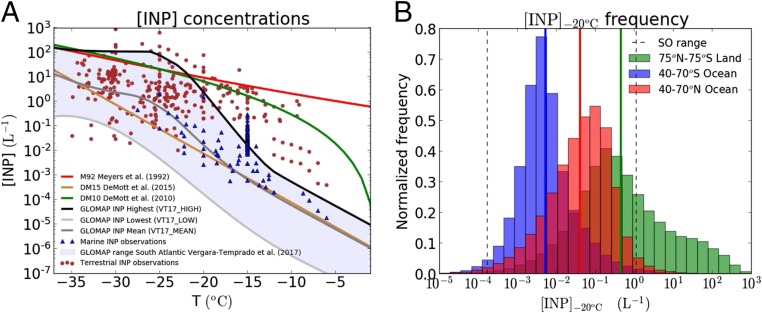
Fig. 2A shows the temperature-dependent concentrations of INP over the South Atlantic simulated by the Global Model of Aerosol Processes (GLOMAP) as presented in the work by Vergara-Temprado et al. (24) (VT17) and several other parameterizations and observations of INP across different parts of the globe. VT17 simulated the concentration of INP based on the distribution of potassium feldspar and marine organic aerosols, which are likely the key INP species in the SO atmosphere (24), combined with laboratory-derived nucleation efficiencies. We define the range of possible INP concentrations affecting SO cyclones from the VT17 model as the daily variability of the simulated concentrations in a South Atlantic transect (40°–70° S, 20° W) (Fig. 2A). The maximum (VT17_high), minimum (VT17_low), and mean (VT17_mean) values of the INP spectra during this period are used in different model simulations to test the sensitivity of clouds to our predicted variability in INP concentrations. The simulated INP range of two to three orders of magnitude agrees well with measurements over marine regions (Fig. 2A). Simulated concentrations over the remote SO are several orders of magnitude lower than over continental regions close to dust sources (Fig. 2B), which is corroborated by measurements of very low ice concentrations in the SO region (25, 26). The SO INP concentrations are also a factor of 5–10 lower than over the North Pacific and North Atlantic, which are the other main regions of the planet affected by postfrontal mixed-phase clouds (Fig. 2B). We also used several earlier parameterizations of INP for testing. DeMott et al. (19) (DM10) use the simulated concentration of aerosols larger than 0.5 μm from all aerosol species apart from sea salt, and the parameterization of DeMott et al. (27) (DM15) is based on the concentration of dust particles. We also use a commonly used parameterization of INP based on temperature only from Meyers et al. (28) (M92). Both DM10 and M92 parameterizations have been shown to overestimate measured ambient INP concentrations over remote marine regions, whereas DM15 and the range of values given by the aerosol model (VT17) agree much better with the measurements in similar remote marine environments (24).
Fig. 2.
INP concentrations. (A) Various parameterizations used in our simulations. The dataset used in the work by Vergara-Temprado et al. (24) is shown for comparison (marine and terrestrial INP) (Supporting Information). The points are divided between marine and terrestrial locations. (B) Frequency distribution of daily averaged INP concentrations at an activation temperature of −20 °C for mid- to high latitudes for ocean regions in the Northern Hemisphere and the Southern Hemisphere between 850 and 600 hPa. INP concentrations over land (whole globe from 75° N to 75° S at the same altitudes) are also shown for comparison. The solid vertical lines show the median values of the distributions. Note that the INP model is subject to low biases over continental regions (24), and therefore, the actual values over land are probably higher.
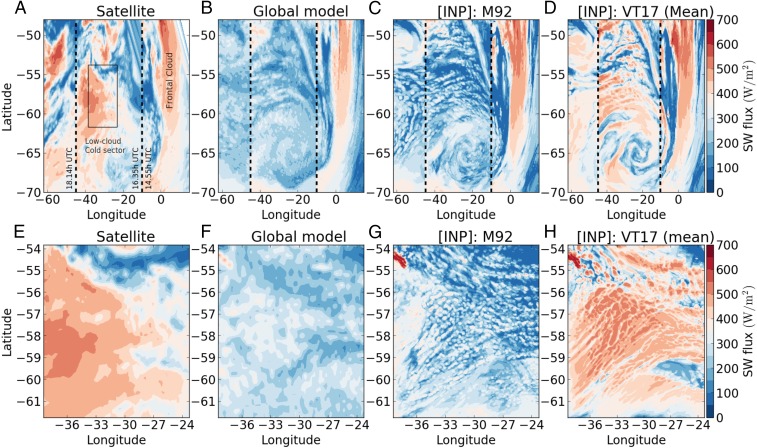
We simulate three cyclonic cloud systems, each containing extensive regions of stratocumulus and cumulus mixed-phase clouds. The cyclones occurred over the South Atlantic during the austral summer when the largest radiative biases occur (10). Two of the cloud systems (cases 1 and 2) have moderately cold cloud tops of around −15 °C, and case 3 was chosen to have a much smaller supercooling, with an average cloud-top temperature of around −7 °C. The simulations were made using the United Kingdom Met Office global Unified Model, with a horizontal grid spacing of ∼25 km with two independent embedded domains. For one set of simulations, we used a grid spacing of 7 km in a high-resolution domain to include the whole cyclone and test the effects of the ice nucleation scheme on the different features within the cyclone (Fig. 3 A–C). All of the other simulations were performed with another nested domain (1,000 km) with a finer grid spacing of 0.02° or about 2.2 km (Fig. 3 E–H) embedded in the global model. This latter set of simulations focused on the cold sector (Supporting Information) of the cyclone. Within the high-resolution domains, cloud microphysics processes are simulated using the Cloud AeroSol Interactive Microphysics scheme (29, 30), which represents the mass and number concentration of hydrometeors (Supporting Information). The global model, in common with most climate models (15), does not have a representation of INP that depends on the aerosol composition, but instead uses a temperature-dependent parameterization with a single-moment representation for the cloud microphysics (31, 32).
Fig. 3.
Top-of-atmosphere outgoing SW radiation for the observed and simulated clouds. Results show the first cloud system C1 with different representations of INP. A–D show the 0.07° grid-spacing simulations of the whole cyclone collocated with the satellite observations (A). A–D are divided by two black dashed lines into three areas, each corresponding to a different satellite retrieval. A box is drawn in the satellite image in A to show the position of the 2.2-km resolution domains (E–H). A and E correspond to the satellite data (CERES). B and F show the output of the global model, and C, D, G, and H are for the high-resolution runs using the M92 INP scheme and the mean INP values simulated from VT17. Fig. S6 shows all of the cases studied.
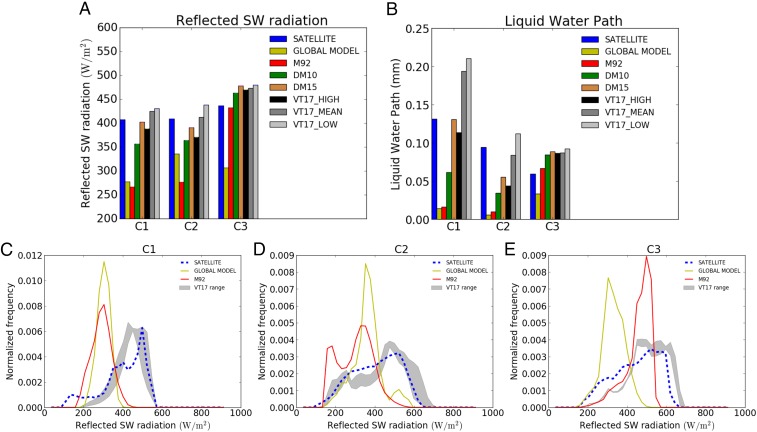
Figs. 3 and 4 show that the liquid water path (column-integrated water per unit area) and the reflected SW radiation of the cloud systems are strongly affected by the INP parameterization (Figs. S1–S4 show additional results for cloud-top temperature, cloud droplet concentrations, and cloud-top phase). In contrast, changing the representation of INP has very little effect on parts of the cyclone that are already simulated well by the global model, such as the frontal cloud (Fig. 3 A–D). In cases C1 and C2 with cold cloud-tops, the domain mean SW flux is simulated within −7 to +12% of the observations from the NASA Clouds and the Earth’s Radiant Energy System (CERES) (33) satellite instrument (Supporting Information) when either the VT17 or the DM15 parameterization is used. The range of INP concentrations in VT17 results in a range of simulated SW fluxes that spans the observations [slightly higher (lower) when INP concentrations are assumed to be at the low (high) end of the VT17 range]. The same is true for the simulated liquid water path, which is higher than observed with low INP and is about right or slightly low with the highest model-derived INP concentrations. In contrast, M92, which predicts unrealistically high INP concentrations over the SO, simulates SW fluxes that are 28–36% too low and liquid water paths that are a factor of seven too low.
Fig. 4.
Top-of-atmosphere outgoing SW radiation and cloud liquid water path for all studied cloud systems. A and B show the domain mean value of reflected SW radiation (A) and liquid water path (LWP) (B). C–E show the distributions of low cloud- and midcloud-reflected SW radiation fluxes for the three clouds studied (C1–C3) for the simulations with the global model and the high-resolution simulations with M92 and the VT17 range of INP values. (More detailed versions of these plots are in Fig. S1.) Model grid boxes with a cloud-top temperature less than −35 °C and columns with an LWP less than 0.001 mm were removed from the calculations to exclude the effect of high clouds and cloud-free areas.
The frequency distribution of reflected SW fluxes improves greatly with the more realistic representations of INP (Fig. 4 C–E and Fig. S1). The correlation of the satellite-derived SW distribution with the simulated distribution based on the INP model is 0.8–0.92, but it is only 0.03 for the global model and 0.03 for the high-resolution model with the M92 parameterization. For cloud systems C1 and C2, the M92 INP parameterization rarely predicts regions of SW fluxes higher than 400 W m−2, while the model with realistic INP concentrations predicts the peak frequency to occur above this value, in good agreement with the measurements.
The cloud system with warmer cloud tops (case 3) is also poorly simulated by the global model (Fig. 4). The low INP parameterizations simulate the frequency distribution of the reflected SW radiation much better than the high INP parameterizations (Fig. 4E). However, the absolute liquid water path (Fig. 4B) is overpredicted by the low INP parameterizations, which might imply that we are missing secondary ice production processes (34). In our simulations, turning off the H–M process did not affect the results. However, it is difficult to draw firm conclusions about its potential importance from these results, because there are currently large uncertainties in the way that this process occurs (34) and hence, in its model representation.
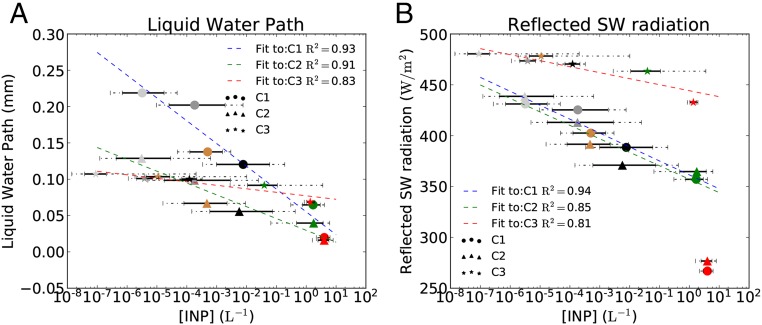
To determine the relationship between INP concentration and cloud properties in the high-resolution runs, we calculated the domain median concentrations of in-cloud INPs that were active at local temperatures for each simulation (Fig. 5 and Supporting Information). There is a clear inverse relationship between the mean reflected SW radiative flux and the INP concentration, which was also seen in previous studies using global model simulations (18, 20, 22). We find this relationship to be linear with the logarithm of the INP concentration up to about 1 L−1, above which the reflected SW radiation drops sharply as the ice processes become efficient enough to deplete most of the liquid water. For INP concentrations below about 1 L−1, the slope is about 15 W m−2 per decade change in INP for the cold cloud cases but about 6 W m−2 per decade increase in INP for the warmer cloud.
Fig. 5.
Relationship between cloud properties and INP concentrations. (A) Median-modeled in cloud-activated INP vs. liquid water path and (B) INP vs. reflected SW flux. The solid line error bars on the INP axis correspond to the 66% confidence intervals of the distribution of in cloud-activated INPs, and the dashed line error bars correspond to the 95% intervals. The colors of the points correspond to the different INP parameterizations, and they follow Fig. 3. A linear fit to the data points corresponding to each cloud is also shown with its corresponding coefficient of determination (R2). The linear regime ends for concentrations higher than about 1 L−1, and therefore, runs with higher values were not included in the linear fit.
While adjustments to model microphysical processes lead to changes in cloud reflectance (17, 22, 35, 36), such changes are likely to have broadly uniform effects in different global regions. Therefore, model tuning, for instance by changing the threshold temperature at which ice is formed via heterogeneous freezing without considering the spatial variations in atmospheric INP and associated ice particle concentrations, will not account for important regional and temporal variations (37) caused by large temporal and spatial variations in INP concentrations (Fig. 2B). Combining the previously computed sensitivities for the cloud systems simulated with the expected variability in INP concentrations in the SO (approximately four orders of magnitude) (Fig. 2B), we estimate that INP could modulate the radiative properties of similar cloud systems by 24–60 W m−2. Globally, the variability in INP concentrations is about seven orders of magnitude. For similar clouds (and dependent on the incoming SW flux), INP variations could modulate the radiative properties by between 42 and 105 W m−2, although increases above 0.1 L−1 could potentially deplete most liquid water, strongly affecting cloud radiative properties. We therefore argue that to better constrain ice processes in models, cloud glaciation needs to be linked to realistic INP concentrations.
Our results suggest that the low INP concentrations over the remote SO are a major factor in causing mixed-phase clouds to persist in a supercooled state for longer than similar clouds in high-INP environments and that this is likely to be an important factor explaining model biases in reflected SW radiation. Effectively, our findings suggest that ice formation processes in global models are causing the SO clouds to behave as if they had higher INP concentrations than in reality. The important role of INP is a complicating factor for climate models, most of which do not currently simulate the number concentration of ice particles and the associated microphysical processes that are required to link INPs to changes in cloud properties in a realistic way. Adjustments to the freezing temperature as a proxy for the proper representation of INP concentrations do not seem to have the same effect on cloud properties (17, 38) and can lead to unphysical relations between cloud cover and cloud glaciation temperature (37). Hence, a representation of cloud microphysical processes that considers the spatial and temporal differences in INP concentrations is crucial to correctly represent mixed-phase clouds in the present climate and the way that they affect past climates (20). Changes in the atmospheric INP concentrations due to natural or human-induced effects on aerosol emissions could also affect climate by modifying the properties of these clouds.
Supplementary Material
Acknowledgments
We acknowledge use of the Monsoon system, a collaborative facility supplied under the Joint Weather and Climate Research Programme, a strategic partnership between the Met Office and the Natural Environment Research Council. Advanced Microwave Scanning Radiometer (AMSR) data are produced by Remote Sensing Systems and were sponsored by the NASA AMSR-E Science Team and the NASA Earth Science Making Earth Science Data Records for Use in Research Environments Program. Data are available online (www.remss.com). Moderate resolution imaging spectroradiometer (MODIS) data were obtained from the NASA Goddard Land Processes data archive. CERES data were downloaded from the CERES data ordering webpage (ceres.larc.nasa.gov/order_data.php). The output from the simulations presented in this study is available at https://doi.org/10.5518/317. This study has been funded by the European Union’s Seventh Framework Programme FP7/2007-797 2013 Grant 603445 (BACCHUS) and European Research Council Grants 240449 ICE and 648661 MarineIce. D.P.G. was funded by both the University of Leeds under P.R.F. and from the Natural Environment Research Council-funded North Atlantic Climate System Integrated Study programme via NCAS. K.S.C. is a Royal Society Wolfson Merit Award holder.
Footnotes
The authors declare no conflict of interest.
This article is a PNAS Direct Submission.
Data deposition: The dataset reported in this paper is available at https://doi.org/10.5518/317.
This article contains supporting information online at www.pnas.org/lookup/suppl/doi:10.1073/pnas.1721627115/-/DCSupplemental.
References
- 1.Trenberth KE, Fasullo JT. Simulation of present-day and twenty-first-century energy budgets of the Southern Oceans. J Clim. 2010;23:440–454. [Google Scholar]
- 2.Bodas-Salcedo A, et al. Origins of the solar radiation biases over the Southern Ocean in CFMIP2 models. J Clim. 2014;27:41–56. [Google Scholar]
- 3.Wang C, Zhang L, Lee S-K, Wu L, Mechoso CR. A global perspective on CMIP5 climate model biases. Nat Clim Chang. 2014;4:201–205. [Google Scholar]
- 4.Ceppi P, Hwang YT, Frierson DMW, Hartmann DL. Southern Hemisphere jet latitude biases in CMIP5 models linked to shortwave cloud forcing. Geophys Res Lett. 2012;39:1–5. [Google Scholar]
- 5.Hwang Y-T, Frierson DMW. Link between the double-Intertropical Convergence Zone problem and cloud biases over the Southern Ocean. Proc Natl Acad Sci USA. 2013;110:4935–4940. doi: 10.1073/pnas.1213302110. [DOI] [PMC free article] [PubMed] [Google Scholar]
- 6.Hawcroft M, et al. Southern Ocean albedo, inter-hemispheric energy transports and the double ITCZ: Global impacts of biases in a coupled model. Clim Dyn. 2017;48:2279–2295. [Google Scholar]
- 7.Kay JE, et al. Global climate impacts of fixing the Southern Ocean shortwave radiation bias in the Community Earth System Model (CESM) J Clim. 2016;29:4617–4636. [Google Scholar]
- 8.Williams KD, et al. The transpose-AMIP II experiment and its application to the understanding of Southern Ocean cloud biases in climate models. J Clim. 2013;26:3258–3274. [Google Scholar]
- 9.Haynes JM, Jakob C, Rossow WB, Tselioudis G, Brown JB. Major characteristics of Southern Ocean cloud regimes and their effects on the energy budget. J Clim. 2011;24:5061–5080. [Google Scholar]
- 10.Bodas-Salcedo A, Andrews T, Karmalkar AV, Ringer MA. Cloud liquid water path and radiative feedbacks over the Southern Ocean. Geophys Res Lett. 2016;43:10938–10946. [Google Scholar]
- 11.McCoy DT, et al. Natural aerosols explain seasonal and spatial patterns of Southern Ocean cloud albedo. Sci Adv. 2015;1:e1500157. doi: 10.1126/sciadv.1500157. [DOI] [PMC free article] [PubMed] [Google Scholar]
- 12.Bodas-Salcedo A, Williams KD, Field PR, Lock AP. The surface downwelling solar radiation surplus over the southern ocean in the Met Office model: The role of midlatitude cyclone clouds. J Clim. 2012;25:7467–7486. [Google Scholar]
- 13.Korolev A, Field PR. The effect of dynamics on mixed-phase clouds: Theoretical considerations. J Atmos Sci. 2008;65:66–86. [Google Scholar]
- 14.Furtado K, Field PR, Boutle IA, Morcrette CJ, Wilkinson JM. A physically-based, subgrid parametrization for the production and maintenance of mixed-phase clouds in a general circulation model. J Atmos Sci. 2016;73:279–291. [Google Scholar]
- 15.McCoy DT, Hartmann DL, Zelinka MD, Ceppi P, Grosvenor DP. Mixed-phase cloud physics and Southern Ocean cloud feedback in climate models. J Geophys Res Atmos. 2015;120:9539–9554. [Google Scholar]
- 16.Tan I, Storelvmo T, Zelinka MD. Observational constraints on mixed-phase clouds imply higher climate sensitivity. Science. 2016;352:224–227. doi: 10.1126/science.aad5300. [DOI] [PubMed] [Google Scholar]
- 17.Furtado K, Field P. The role of ice-microphysics parametrizations in determining the prevalence of supercooled liquid water in high-resolution simulations of a Southern Ocean midlatitude cyclone. J Atmos Sci. 2017;74:2001–2021. [Google Scholar]
- 18.Yun Y, Penner JE. Global model comparison of heterogeneous ice nucleation parameterizations in mixed phase clouds. J Geophys Res Atmos. 2012;117:1–23. [Google Scholar]
- 19.DeMott PJ, et al. Predicting global atmospheric ice nuclei distributions and their impacts on climate. Proc Natl Acad Sci USA. 2010;107:11217–11222. doi: 10.1073/pnas.0910818107. [DOI] [PMC free article] [PubMed] [Google Scholar]
- 20.Sagoo N, Storelvmo T. Testing the sensitivity of past climates to the indirect effects of dust. Geophys Res Lett. 2017;44:5807–5817. [Google Scholar]
- 21.Field PR, et al. Simultaneous radar and aircraft observations of mixed-phase cloud at the 100 m scale. Q J R Meteorol Soc. 2004;130:1877–1904. [Google Scholar]
- 22.Tan I, Storelvmo T. Sensitivity study on the influence of cloud microphysical parameters on mixed-phase cloud thermodynamic phase partitioning in CAM5. J Atmos Sci. 2016;73:709–728. [Google Scholar]
- 23.Forbes RM, Ahlgrimm M. On the representation of high-latitude boundary layer mixed-phase cloud in the ECMWF global model. Mon Weather Rev. 2014;142:3425–3445. [Google Scholar]
- 24.Vergara-Temprado J, et al. Contribution of feldspar and marine organic aerosols to global ice nucleating particle concentrations. Atmos Chem Phys. 2017;17:3637–3658. [Google Scholar]
- 25.Grosvenor DP, et al. In-situ aircraft observations of ice concentrations within clouds over the Antarctic Peninsula and Larsen Ice Shelf. Atmos Chem Phys. 2012;12:11275–11294. [Google Scholar]
- 26.Chubb TH, Jensen JB, Siems ST, Manton MJ. In situ observations of supercooled liquid clouds over the Southern Ocean during the HIAPER Pole-to-Pole Observation campaigns. Geophys Res Lett. 2013;40:5280–5285. [Google Scholar]
- 27.DeMott PJ, et al. Integrating laboratory and field data to quantify the immersion freezing ice nucleation activity of mineral dust particles. Atmos Chem Phys. 2015;15:393–409. [Google Scholar]
- 28.Meyers MP, DeMott PJ, Cotton WR. New primary ice-nucleation parameterizations in an explicit cloud model. J Appl Meteorol. 1992;31:708–721. [Google Scholar]
- 29.Grosvenor DP, Field PR, Hill AA, Shipway BJ. The relative importance of macrophysical and cloud albedo changes for aerosol-induced radiative effects in closed-cell stratocumulus: Insight from the modelling of a case study. Atmos Chem Phys. 2017;17:5155–5183. [Google Scholar]
- 30.Miltenberger AK, et al. Aerosol-cloud interactions in mixed-phase convective clouds. Part 1: Aerosol perturbations. Atmos Chem Phys Discuss. 2017 doi: 10.5194/acp-2017-788. [DOI] [Google Scholar]
- 31.Wilson DR, Ballard SP. A microphysically based precipitation scheme for the UK meteorological office unified model. Q J R Meteorol Soc. 1999;125:1607–1636. [Google Scholar]
- 32.Walters D, et al. The Met Office Unified Model Global Atmosphere 6.0/6.1 and JULES Global Land 6.0/6.1 configurations. Geosci Model Dev. 2017;10:1487–1520. [Google Scholar]
- 33.Kratz DP, et al. The fast longwave and shortwave flux (FLASHFlux) data product: Single-scanner footprint fluxes. J Appl Meteorol Climatol. 2014;53:1059–1079. [Google Scholar]
- 34.Field PR, et al. Secondary ice production–Current state of the science and recommendations for the future. Meteorol Monogr. 2017;58:7.1–7.20. [Google Scholar]
- 35.Storelvmo T, Hoose C, Eriksson P. Global modeling of mixed-phase clouds: The albedo and lifetime effects of aerosols. J Geophys Res. 2011;116:D05207. [Google Scholar]
- 36.Frey WR, Kay JE. The influence of extratropical cloud phase and amount feedbacks on climate sensitivity. Clim Dyn. 2017 doi: 10.1007/s00382-017-3796-5. [DOI] [Google Scholar]
- 37.McCoy DT, Tan I, Hartmann DL, Zelinka MD, Storelvmo T. On the relationships among cloud cover, mixed-phase partitioning, and planetary albedo in GCMs. J Adv Model Earth Syst. 2016;8:650–668. [Google Scholar]
- 38.Bodas-Salcedo A, et al. Large contribution of supercooled liquid clouds to the solar radiation budget of the Southern Ocean. J Clim. 2016;29:4213–4228. [Google Scholar]
- 39.Shipway BJ, Hill AA. Diagnosis of systematic differences between multiple parametrizations of warm rain microphysics using a kinematic framework. Q J R Meteorol Soc. 2012;138:2196–2211. [Google Scholar]
- 40.Mann GW, et al. Description and evaluation of GLOMAP-mode: A modal global aerosol microphysics model for the UKCA composition-climate model. Geosci Model Dev. 2010;3:519–551. [Google Scholar]
- 41.Abdul-Razzak H, Ghan SJ. A parameterization of aerosol activation: 2. Multiple aerosol types. J Geophys Res Atmos. 2000;105:6837–6844. [Google Scholar]
- 42.Atkinson JD, et al. The importance of feldspar for ice nucleation by mineral dust in mixed-phase clouds. Nature. 2013;498:355–358. doi: 10.1038/nature12278. [DOI] [PubMed] [Google Scholar]
- 43.Wilson TW, et al. A marine biogenic source of atmospheric ice-nucleating particles. Nature. 2015;525:234–238. doi: 10.1038/nature14986. [DOI] [PubMed] [Google Scholar]
- 44.Bigg EK. Ice nucleus concentrations in remote areas. J Atmos Sci. 1973;30:1153–1157. [Google Scholar]
- 45.DeMott PJ, et al. Sea spray aerosol as a unique source of ice nucleating particles. Proc Natl Acad Sci USA. 2016;113:5797–5803. doi: 10.1073/pnas.1514034112. [DOI] [PMC free article] [PubMed] [Google Scholar]
- 46.Yin J, Wang D, Zhai G. An evaluation of ice nuclei characteristics from the long-term measurement data over North China. Asia Pac J Atmos Sci. 2012;48:197–204. [Google Scholar]
- 47.Conen F, et al. Atmospheric ice nuclei at the high-altitude observatory Jungfraujoch, Switzerland. Tellus B Chem Phys Meterol. 2015;67:1–10. [Google Scholar]
- 48.Mason RH, et al. Size-resolved measurements of ice-nucleating particles at six locations in North America and one in Europe. Atmos Chem Phys. 2016;16:1637–1651. [Google Scholar]
- 49.Ardon-Dryer K, Levin Z, Lawson RP. Characteristics of immersion freezing nuclei at the South Pole station in Antarctica. Atmos Chem Phys. 2011;11:4015–4024. [Google Scholar]
- 50.Ardon-Dryer K, Levin Z. Ground-based measurements of immersion freezing in the eastern Mediterranean. Atmos Chem Phys. 2014;14:5217–5231. [Google Scholar]
- 51.Rosinski J, et al. Ice-forming nuclei in air masses over the Gulf of Mexico. J Aerosol Sci. 1988;19:539–551. [Google Scholar]
- 52.Khairoutdinov M, Kogan Y. A new cloud physics parameterization in a large-eddy simulation model of marine stratocumulus. Mon Weather Rev. 2000;128:229–243. [Google Scholar]
- 53.Beheng KD. A parameterization of warm cloud microphysical conversion processes. Atmos Res. 1994;33:193–206. [Google Scholar]
- 54.Locatelli JD, Hobbs PV. Fall speeds and masses of solid precipitation particles. J Geophys Res. 1974;79:2185–2197. [Google Scholar]
- 55.Bigg EK. The formation of atmospheric ice crystals by the freezing of droplets. Q J R Meteorol Soc. 1953;79:510–519. [Google Scholar]
- 56.Platnick S, Ackerman S, King M. 2015. MODIS Atmosphere L2 Cloud Product (06_L2). NASA MODIS Adaptive Processing System (Goddard Space Flight Center, Greenbelt, MD)
- 57.Wentz FJT, Meissner C, Gentemann KA, Hilburn JS. 2014. Remote Sensing Systems GCOM-W1 AMSR2 Daily Environmental Suite on 0.25 Deg Grid (Remote Sensing Systems, Santa Rosa, CA), Version 7.2.
- 58.Grosvenor DP, Wood R. The effect of solar zenith angle on MODIS cloud optical and microphysical retrievals within marine liquid water clouds. Atmos Chem Phys. 2014;14:7291–7321. [Google Scholar]
- 59.Zhang Z, Platnick S. An assessment of differences between cloud effective particle radius retrievals for marine water clouds from three MODIS spectral bands. J Geophys Res Atmos. 2011;116:1–19. [Google Scholar]
- 60.Sourdeval O, Labonnote LC, Baran AJ, Mülmenstädt J, Brogniez G. A methodology for simultaneous retrieval of ice and liquid water cloud properties. Part 2: Near-global retrievals and evaluation against A-train products. Q J R Meteorol Soc. 2016;142:3063–3081. [Google Scholar]
Associated Data
This section collects any data citations, data availability statements, or supplementary materials included in this article.


