Abstract
Auditory rhythmic sensory stimulation modulates brain oscillations by increasing phase-locking to the temporal structure of the stimuli and by increasing the power of specific frequency bands, resulting in Auditory Steady State Responses (ASSR). The ASSR is altered in different diseases of the central nervous system such as schizophrenia. However, in order to use the ASSR as biological markers for disease states, it needs to be understood how different vigilance states and underlying brain activity affect the ASSR. Here, we compared the effects of auditory rhythmic stimuli on EEG brain activity during wake and NREM sleep, investigated the influence of the presence of dominant sleep rhythms on the ASSR, and delineated the topographical distribution of these modulations. Participants (14 healthy males, 20–33 years) completed on the same day a 60 min nap session and two 30 min wakefulness sessions (before and after the nap). During these sessions, amplitude modulated (AM) white noise auditory stimuli at different frequencies were applied. High-density EEG was continuously recorded and time-frequency analyses were performed to assess ASSR during wakefulness and NREM periods. Our analysis revealed that depending on the electrode location, stimulation frequency applied and window/frequencies analysed the ASSR was significantly modulated by sleep pressure (before and after sleep), vigilance state (wake vs. NREM sleep), and the presence of slow wave activity and sleep spindles. Furthermore, AM stimuli increased spindle activity during NREM sleep but not during wakefulness. Thus, (1) electrode location, sleep history, vigilance state and ongoing brain activity needs to be carefully considered when investigating ASSR and (2) auditory rhythmic stimuli during sleep might represent a powerful tool to boost sleep spindles.
Keywords: Auditory steady state response, sleep spindles, slow waves, topography, high-density EEG, vigilance state
1. Introduction
Rhythmic auditory stimulations drive and entrain brain oscillations, a response termed Auditory Steady State Response (ASSR, (Picton et al., 2003a; Thut et al., 2011)). This response is reflected in an increased phase-locking to the temporal structure of the stimulation and an increased power of specific frequency bands (Thut et al., 2011). Rhythmic stimuli at 40 Hz (e.g. clicks or amplitude modulated stimuli) seem to elicit the strongest response (Picton et al., 2003a).
The ASSR is altered in certain neuropsychiatric conditions such as schizophrenia and Alzheimer’s disease (Thune et al., 2016; Van Deursen et al., 2011) and has therefore been discussed as a biological marker for these disease states. However, the ability of the brain to respond to rhythmic auditory stimuli is also affected by different conditions in the healthy population. ASSR is modulated by age (Griskova-Bulanova et al., 2013; Picton et al., 2003a; Poulsen et al., 2009), menstrual cycle (Griskova-Bulanova et al., 2014), levels of consciousness (Picton et al., 2003a), and levels of drowsiness (Griskova-Bulanova et al., 2011; Griskova et al., 2007; Picton et al., 2003b), Because ASSR changes as a function of consciousness it has been proposed to monitor the depth of anesthesia. However, this effect depends on the anesthetics used, with ketamine (Plourde et al., 1997) leading to an increase in ASSR at 40 Hz, and propofol and isofluorane to a decrease (Plourde et al., 2008; Plourde et al., 1998). Similarly, sleep also represents a state associated with reduced consciousness (Tononi and Massimini, 2008). A few studies have investigated the effect of sleep and drowsiness on the brain response to rhythmic auditory stimuli. In general, a decrease of the ASSR amplitude to 40Hz stimuli has been reported during sleep compared to the awake in humans (Cohen et al., 1991; Jerger et al., 1986; Linden et al., 1985; Picton et al., 2003b) and rats (Tlumak et al., 2012). This decrease may be more pronounced as sleep stages deepens (Picton et al., 2003b). In contrast, the auditory brain response seems to be enhanced to stimuli with a repetition rate of less than 5 Hz, whereas the response magnitude to 80 Hz and above stimuli does not seem to change as a function of sleep (Cohen et al., 1991; Linden et al., 1985; Picton et al., 2003b; Tlumak et al., 2012). The results on the effects of drowsiness or arousal on ASSR are mixed. Picton et al. (2003b) reported a decrease of ASSR amplitude during NREM stage 1 (drowsy state). However, according to Griskova and colleagues low arousal levels increased ASSR amplitude and phase locking to 40 Hz stimulation compared to high arousal levels (Griskova-Bulanova et al., 2011; Griskova et al., 2007). Collectively, it is important to thoroughly characterize whether and how different conditions such as vigilance state affect the ASSR in the healthy brain in order to be able to understand deficiencies in disorders and to evaluate their validity as markers for disease state.
The thalamocortical system is likely involved in generating the ASSR (Dimitrijevic and Ross, 2008; Ribary et al., 1991). Thalamic neurons exhibit different levels of hyperpolarization and firing properties as a function of vigilance (Avanzini et al., 2000; Llinás and Steriade, 2006) and could therefore explain vigilance state specific changes of the ASSR (Dimitrijevic and Ross, 2008). Along these lines, distinct intrinsic thalamo-cortical oscillations such as alpha oscillations (8–12 Hz), delta oscillations (1–4 Hz) and sleep spindles (11–16 Hz) are characteristic of different vigilance states. NREM sleep is hallmarked by sleep spindles and delta activity whereas wake shows dominate alpha activity (Steriade and Timofeev, 2003). Yet, it remains unclear how these brain oscillations are related to the magnitude of the ASSR response and whether rhythmic stimuli elicit different brain responses during distinct vigilance states. Along these lines, thalamocortical deficiencies have been reported in neuropsychiatric disorders such as schizophrenia (Andreasen et al., 1994; Crail-Melendez et al., 2013; Theberge et al., 2002), which might explain changes in the ASSR.
The aim of this study was to provide a detailed topographical characterization of the ASSR during different vigilance states. Specifically, we compared the effects of different auditory rhythmic stimuli on EEG brain activity during awake and sleep and delineated the topographical distribution of these modulations. We therefore focused on two stimulation frequencies of interest: 14 Hz because it is within the spindle frequency range (De Gennaro and Ferrara, 2003) and 40 Hz because it elicits the strongest ASSR and is among the most often applied frequency in ASSR research studies (Picton et al., 2003a). In addition, we investigated the effect of sleep spindles and delta waves presence on ASSR magnitude. This study provides the first detailed high-density topographical characterization of ASSR in relation to vigilance state, sleep pressure and ongoing brain activity and represents an important step in better understanding the conditions that affect brain responses to rhythmic auditory stimuli in health and disease.
2. Method
2. 1. Participants and procedure
This study was approved by the UNC institutional review board (IRB Number: 15-1994) and all participants gave written informed consent. In this paper, data from 14 healthy, right-handed and non-smoking male participants (age range 20 – 33) are reported. All participants were free of any neurologic, psychiatric, sleep or internal disorders. A urinary drug screen was used to confirm that none of the participants were under the influence of drugs of abuse during study participation. All participants reported to have normal hearing and to be healthy sleepers with nocturnal sleep duration of around 7–9 hours and a regular sleep-wake cycle.
Participants came into the lab for one session shortly before lunch time in order for the nap to be timed around 1pm. During this session they first gave written informed consent and performed a urine drug test. Then they completed screening assessments that included questions about inclusion/exclusion criteria, sleep and circadian habits, and their handedness. A high-density electroencephalography (EEG) net (128 electrodes, including electrooculography (EOG) electrodes, geodesic) and two submental electromyography (EMG) electrodes were applied thereafter. We then started the first auditory stimulation session which lasted for 30 minutes. Participants were required to lie on a bed and focus on a crosshair. They were constantly monitored to assure they were not falling asleep. Every five minutes they were allowed to stretch and move around for a few seconds. After 30 minutes we stopped the auditory stimulation and participants had a break of 10–20 minutes. During this break, we dimmed the lights to prepare them for the following nap period and the participants were provided an opportunity eat a snack and use the bathroom. Afterwards we started the auditory stimulation and participants were given a nap opportunity. After 60 minutes we stopped auditory stimulation and woke them up. They completed a sleep quality questionnaire and had a break of 10–15 minutes. The same wake session performed before the nap was repeated after the nap. Before each wake session, participants completed a visual analogue scale questionnaire to assess their sleepiness, vigor, and affect (Monk, 1989). After the final auditory stimulation, the EEG net was removed and participants were reimbursed.
2.2. Auditory stimulation
Auditory rhythmic stimuli were presented binaurally through Etymotic insert earphones (Etymotic Research Inc., ER 3C,) with a Sound Pressure Level (SPL) of 65 dB. All participants confirmed that the used SPL would not distract them from falling asleep and described the sound/sound level to be comfortable (e.g. quite dishwasher sound or waterfall). Stimuli were embedded in constant white noise (low-pass filtered at 4000 Hz) and consisted of 1000 ms amplitude-modulated (AM) white noise bursts (100% depth, sinusoidal shape) at 10Hz (n = 5, not reported here)/sham (no stimulation, n = 9), 14 Hz (n = 14) and 40 Hz (n = 14). We specifically chose 14 Hz because it is within the spindle frequency range (De Gennaro and Ferrara, 2003) and 40 Hz is among the most often used frequencies because it elicits the strongest ASSR (Picton et al., 2003a). A constant white noise sound level was used to avoid awakenings during sleep due to an abrupt start of noise when a stimulus was presented. Each person had three different stimuli types with an average interstimulus interval (ISI) of 3 s and a range of 2.5 – 3.5 s. All stimuli were presented in a random order throughout the sessions.
2.3. EEG recording and analysis
During auditory stimulation sessions, continuous EEG recordings were performed at a sampling rate of 20,000 Hz and with Cz as the recording reference using the RTXI software (Patel et al., 2017) and an EGI system with SDK AmpServer Pro (Geodesic, Eugene, Oregon). The RTXI system was used to produce the sound to allow for perfect alignment of sound and EEG. Offline EEG pre-processing was performed with the EEGLAB toolbox for MATLAB and consisted of resampling to 250 Hz, bandpass filtering between 1–50 Hz, artifact subspace reconstruction (Mullen et al., 2013), artificial channel removal and spherical channel interpolation, and referencing to average reference. Thereafter independent component analysis (ICA) was performed and components with dominant artifacts (e.g. eye blinks, eye movements, muscle artifacts, heartbeat) were removed. The cleaned EEG was epoched (−0.5 to 2 s around auditory stimulus) and remaining epochs with other artifacts were removed.
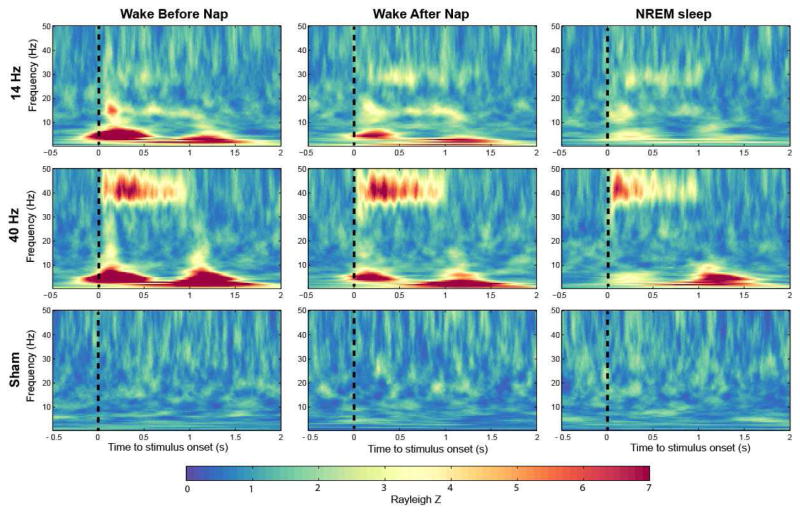
Time-frequency analysis of the EEG was conducted using Morlet wavelet transforms (Morlet wavelets consisting of 7 cycles) and analyzed and averaged for windows (epochs) of −0.5 to 2 s around the auditory stimulus (averaging for each stimulation condition, stimuli type separately). For this study, we mainly focused on the phase-locking aspect of the ASSR, which represents the time-locked, evoked component of the ASSR. We therefore calculated inter-trial phase coherence and scaled it to Rayleigh Z score to account for different number of trials (Fisher, 1995). No baseline-correction was applied for the ITPC analysis, since the number of trials was matched for all conditions. Amplitude changes due to the applied stimuli were estimated using z-score transform of the artifact-free wavelet amplitudes (wake periods for wake recordings and NREM sleep for the nap recording). We also looked at event-related perturbation measures (spectral changes relative to 500ms baseline). However, because the baseline was affected by previous stimulation during sleep we focused on the z-score to illustrate changes in wavelet amplitude. Of note, we matched the number of trials within each participant for the conditions that were compared by randomly choosing the minimal number of trials that occurred in any of the conditions that were compared. For topographical illustration and dimension reduction (statistics) of the ITPC and z-scored wavelet amplitude we averaged over different time windows (e.g. 0–0.5 s relative to stimulus onset) and focused on a specific frequency (e.g. 40 Hz matching the applied stimuli frequency of the 40 Hz stimulus) or averaged over a band of frequencies (e.g. 1–7 Hz). The respective windows and frequencies used are referred to in each topographical figure. The selected windows were based on group averaged time–frequency maps in Figure 1. For the frequencies of 1–7 Hz (relating to classical ERP components) the window 0–0.5 s (ERP relative to the auditory stimuli onset) and 1–1.5 s (which refers to ERP related to stimuli offset) were calculated. For the ITPC at 14 and 40 Hz the windows 0–0.5 s and 0.5 – 1 s were separately analyzed based on the observed temporal structure.
Figure 1.
Group averaged time–frequency maps of inter-trial phase coherence (ITPC) wakefulness before and after sleep, and during NREM (non-rapid eye movement) sleep (electrode FCz). Values are Rayleigh Z-corrected to account for unequal number of trials. Warm colors represent higher values and therefore stronger phase locking.
Sleep staging was performed based on 20-s epochs according to standard criteria. Delta spectral power during NREM sleep (average amount of NREM sleep 36.3 min ± 3.1 min sem) was computed for consecutive 20-s epochs using a Fast Fourier routine (Hanning window, average of five 4 s epochs, frequency resolution 0.25 Hz). We separated the trials into three groups that were defined by the amount of delta activity (EEG power between 1–4 Hz) present in the specific NREM sleep epoch the stimulus occurred. Specifically, we divided the NREM sleep epochs into 3 levels (low, medium, high delta activity) to make sure that a similar number of trials were in each group.
Spindle detection was performed using an established detection algorithm. The procedure has been described in detail elsewhere (Ferrarelli et al., 2007; Lustenberger et al., 2016; Lustenberger et al., 2015b). In short, we band-pass filtered the signal between 10 – 16 Hz to allow spindle characterization in a broad frequency range (11 – 16 Hz) and used an upper threshold of 5 times the mean and a lower threshold of 2 times the mean. A spindle was detected whenever the signal exceeded the upper threshold. Spindles with durations shorter than 300 ms or longer than 3 s were excluded from the analysis. We separated auditory stimuli into 2 groups, no spindle occurrence within 1 s of auditory stimulation and spindle occurrence within this 1 s auditory stimulation window. We restricted our spindle occurrence to be present in a fronto-central cluster of electrodes because spindles are most pronounced over this region (Andrillon et al., 2011; De Gennaro and Ferrara, 2003; Lustenberger et al., 2015b). The “no-spindle condition” was only fulfilled if there was at no time during the 1s window of stimuli presentation an increase of spindle activity above 4 times the mean of the signal in any of the recorded channels to assure maximal contrast between spindle and no-spindle group. Numbers of trials were matched for these two conditions.
2.4. Statistics
Conditions and stimuli types were compared using paired t-tests. The illustration of results for all electrodes on a planar projection of the scalp surface is referred to as a topographical plot. To control for multiple t-tests performed across electrodes in the topographical plots, we performed non-parametric statistical mapping (SnPM) with suprathreshold cluster analysis (Nichols and Holmes, 2002) as previously applied and described in high-density EEG studies (e.g.(Huber et al., 2006; Lustenberger et al., 2015a; Plante et al., 2016). Clusters of significantly different electrodes (defined by t-values) that were at least equal or above the 95th percentile cluster size on either side (minimal and maximal clusters) were considered significant and illustrated in the topographical plots.
3. Results
Time-frequency plots for a fronto-central EEG electrode showed characteristic phase-locking responses to stimuli during both wakefulness sessions and NREM sleep (Figure 1). That is, we saw the expected phase-locking to the stimulus in the stimulation frequency applied. As illustrated in Figure 1, this response showed a more pronounced magnitude for the first 500 ms (w1) of the stimuli and a smaller one the second half of auditory stimulation (0.5 – 1s, w2), especially for the 40-Hz stimulation (Fronto-central electrode: Before nap (BN) w1:5.4±0.9, w2:4.1±0.8; After nap (AN) w1: 5.6±0.8, w2: 4.5 ± 0.6; NREM w1: 4.5± 0.5, w2: 2.7 ± 0.4; all p < 0.05 comparing w1 to w2). Furthermore, within the first 500 ms we obtained a classical auditory event-related potential (ERP) response between 1–7 Hz, this response was repeated when there was a transition from modulated white noise to constant white noise between 1–1.5 s relative to stimuli onset as illustrated in Figure 1. Based on these responses we divided our topographical analysis into windows and frequencies of interest. statistical analyses were performed for these topographical plots between different vigilance states, and with/without presence of dominant NREM sleep oscillation.
3.1. Auditory steady state response (ASSR) changed with vigilance state
We contrasted before nap to after nap wake conditions to compare different levels of sleep pressure and drowsiness, and NREM sleep to AN wake condition.
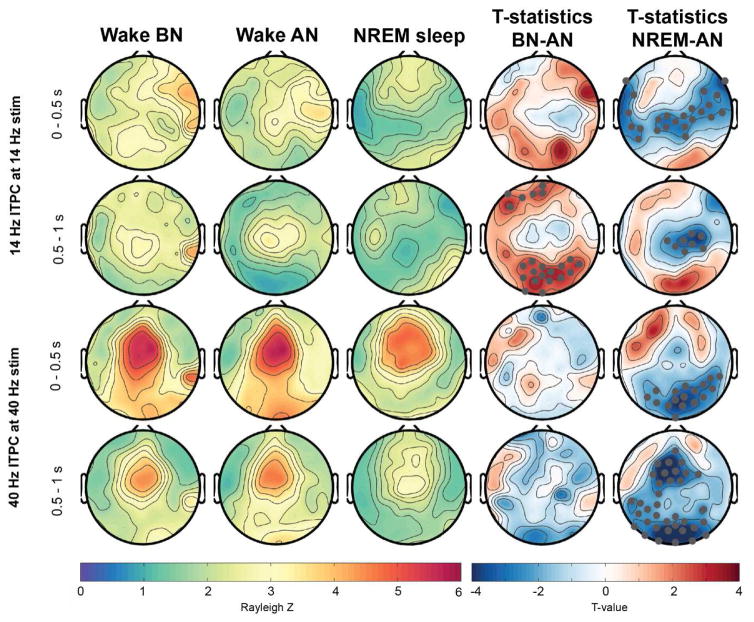
ITPC at 40 Hz during 40-Hz AM stimuli showed a typical topography with fronto-central maximum (Griskova et al., 2007; Meltzer et al., 2015; Zhang et al., 2013) during all conditions and for the first and second half of stimulation (Figure 2). However, the phase-coherence at 40-Hz was significantly reduced during NREM sleep compared to the AN condition in the first half of stimulation as illustrated in the t-value plots in Figure 2. This reduction was topographically widespread across parieto-occipital regions. However, for a few frontal electrodes there was rather an increase in response. This cluster size of significant electrodes did not survive supra-threshold cluster analysis and is therefore not shown in Figure 2. During the second half of the auditory stimuli the reduction in 40 Hz ITPC reached a more widespread significant area including central, parietal and occipital electrodes.
Figure 2.
Topographical (hdEEG) representation of ITPC response at 14- and 40-Hz across wakefulness and NREM sleep. Gray marked dots in the t-value maps indicate electrodes that significantly differ between the conditions and that survive SnPM and suprathreshold cluster analysis. BN: Before nap, AN: After nap.
As further depicted in Figure 2, the topographical distribution of the 14 Hz ASSR to 14-Hz AM stimuli was widespread and did not have a clearly defined maximum in the first half of stimulation. However, there was a central dominance in the wake-conditions whereas NREM sleep showed almost no phase-locking in central electrodes, both in the first and second half of the auditory stimulus. This observation was reflected in a significant reduction of ITPC between NREM sleep and AN condition for central electrodes (see Figure 2, t-value plots). During the second half of the auditory stimuli the ITPC during AN condition revealed a more defined topography with a clear central maximum. In contrast to the AN condition the BN condition had significantly more widespread phase-locking to the auditory stimuli reflected in significant clusters in Figure 2 at frontal and occipital electrode sites.
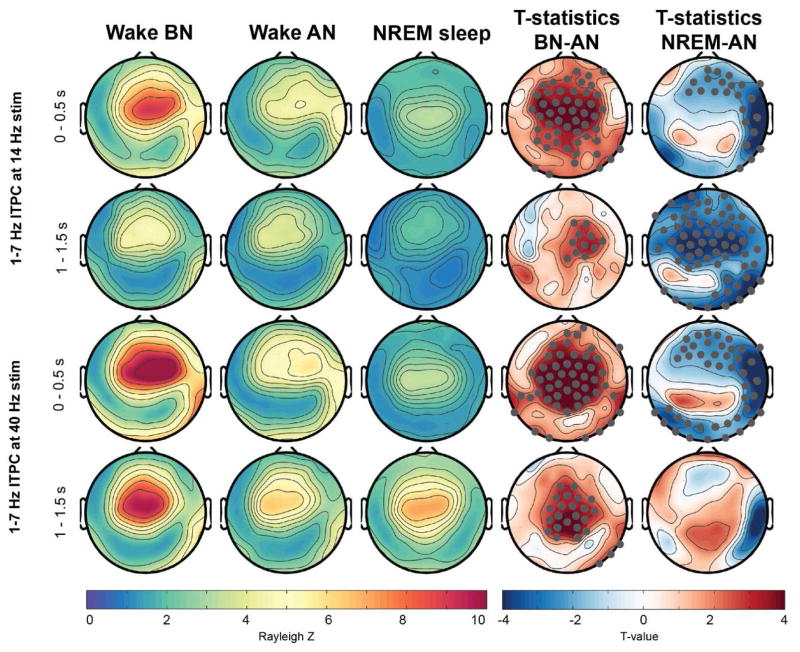
There were further clear changes in ITPC at 1–7 Hz between the conditions (Figure 3). For all conditions, independent of type of stimuli and time window analyzed, the ITPC topography exhibited a clear centro-frontal maximum. However, the strength of the ITPC was profoundly changed across all conditions (indicated as significant electrode clusters in the t-value topographical plots). Specifically, within the 0.5–1 s window the response was strongest in the BN condition and widespread significant reduction during the AN condition was observed. This response was further significantly reduced, specifically for right hemispheric electrodes during NREM sleep compared to AN wakefulness. The ITPC evoked by the offset of the AM stimuli demonstrated a similar, though less pronounced, significant reduction from BN to AN. This response was further different between AN and NREM sleep, however the changes depended on the stimulation frequency applied. For the 14-Hz stimulation, the ITPC was globally significantly, reduced during NREM sleep compared to AN. In contrast, after the 40-Hz stimulation stops the response was on average increased over parietal electrode sites, but this increase was not significant after permutation analysis.
Figure 3.
Topographical representation of ITPC response at 1–7 Hz across wakefulness and NREM sleep. Electrodes that showed significant difference and survived SnPM and suprathreshold cluster analysis are marked in gray in the t-value maps. BN: Before nap, AN: After nap.
Of note, during wake a clear right-hemispheric lateralization of the response in 1–7 Hz was observable but not so during NREM sleep. This was reflected in significant decreased ITPC specifically localized over right electrode locations in all comparisons.
Collectively, regionally distinct and frequency-specific changes in the phase-locking component of the ASSR were observable between wake and NREM sleep, and before and after a nap during wakefulness.
3.2. The presence of slow waves and sleep spindles affected the ASSR
Because ITPC responses to rhythmic stimuli were different during wake and NREM sleep, we wanted to investigate whether the presence of brain oscillations that are specific to NREM sleep affected this response.
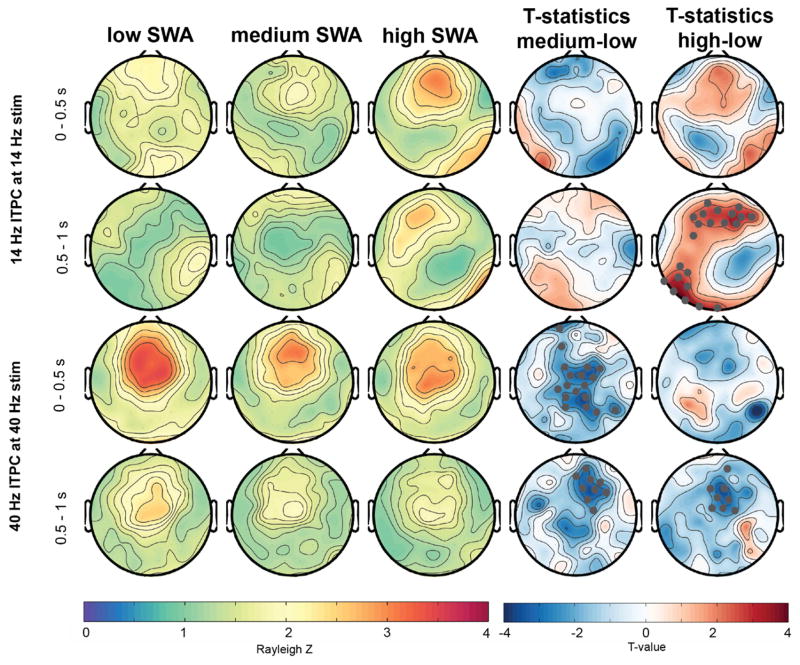
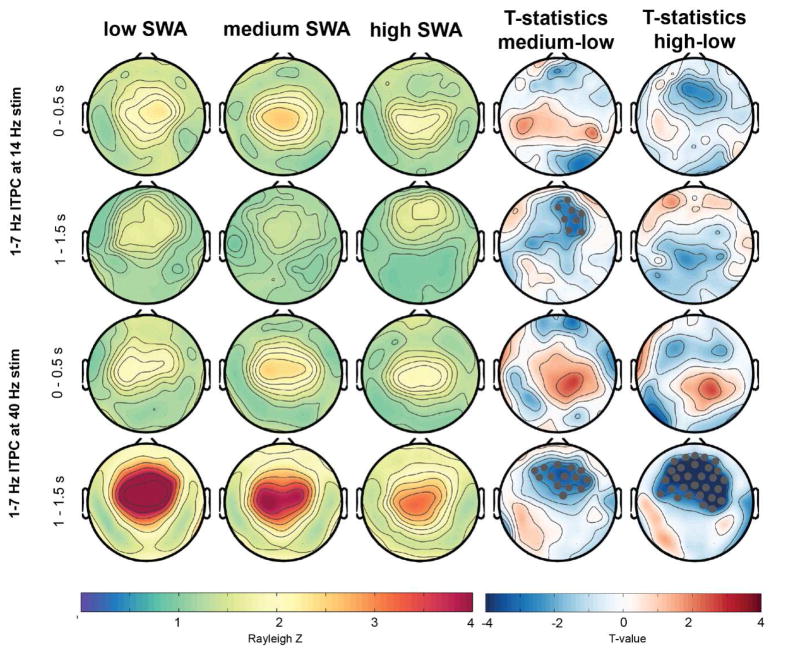
First, we divided the auditory responses in three groups, depending on how much delta activity (1–4 Hz, also termed slow wave activity or SWA) was present while the auditory stimuli were played. Figures 4 and 5 illustrate the ITPC responses relative to these SWA levels (low, medium and high). Higher SWA corresponds to the deeper sleep states in participants (Achermann and Borbély, 2011). With an increase in SWA levels, ITPC at 40 Hz to the 40-Hz stimulus significantly decreased (Figure 4, statistics illustrated in the t-value maps). In contrast, a significantly increased ITPC at 14 Hz to the 14 Hz stimulus for a frontal cluster was found with higher SWA levels. The evoked response at 1–7 Hz was only significantly affected by the amount of SWA for the 40-Hz stimulation (Figure 5). Specifically, a pronounced significant decrease of the evoked response relative to the stimulus offset (window 1–1.5s) with increased SWA was found for a large fronto-central cluster. This frontal decrease was also significant, but less pronounced and widespread in the window of 0–0.5 s.
Figure 4.
Topographical representation of ITPC response at 14- and 40-Hz across different levels of delta activity/slow wave activity (SWA, lowest, mid and highest third percentile). Gray marked dots in the t-value plots indicate electrodes that are significantly different between the conditions and that survive SnPM and suprathreshold cluster analysis.
Figure 5.
Topographical representation of ITPC response at 1–7 Hz across different levels of delta activity/SWA (lowest, mid and highest third percentile). Gray marked dots in the t-value plots indicate electrodes that significantly differ between the conditions and that survive SnPM and suprathreshold cluster analysis.
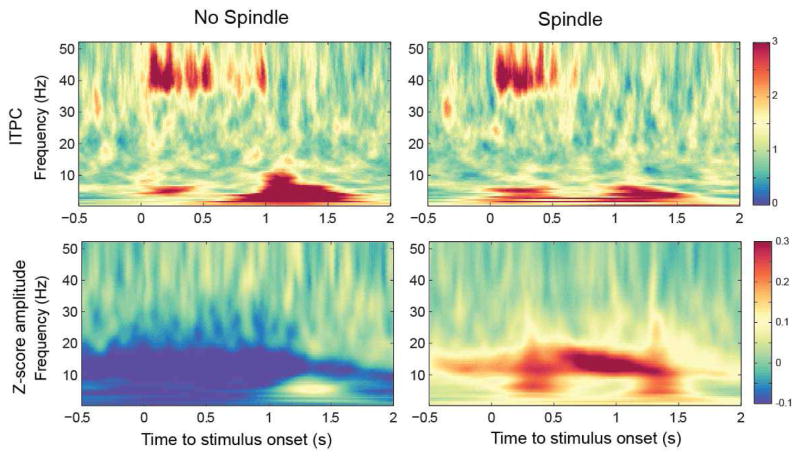
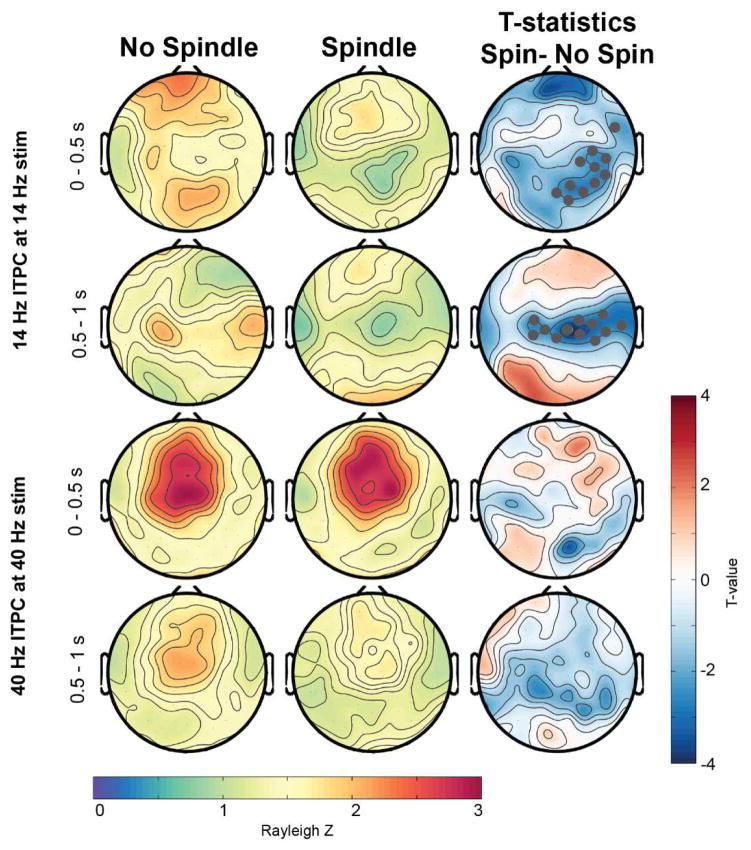
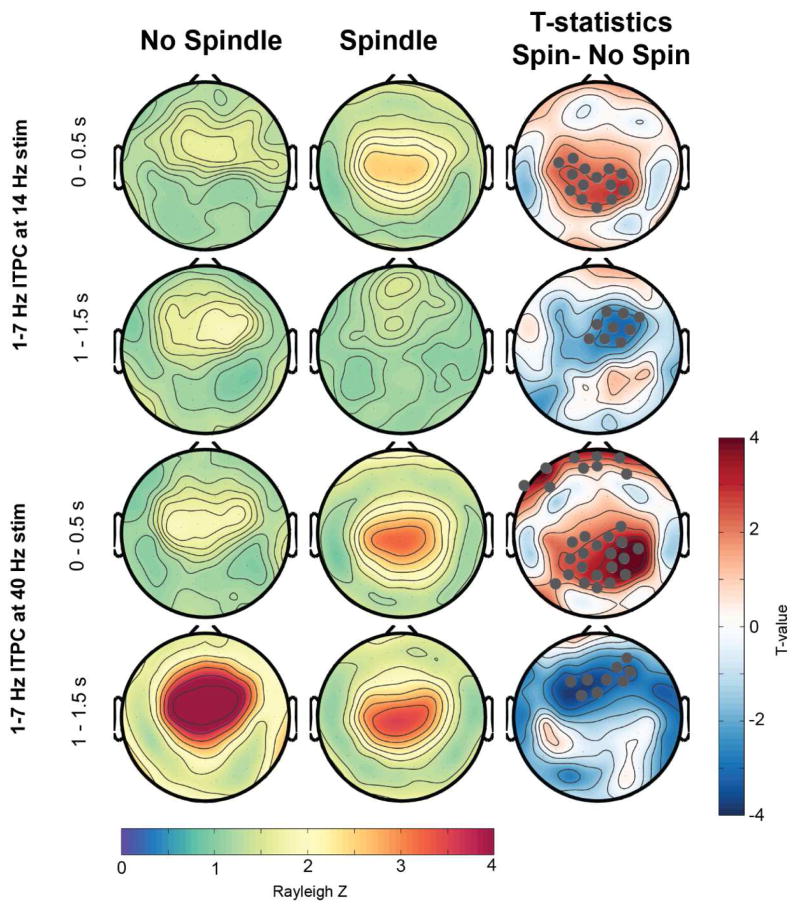
In a next step, we investigated how the presence of a sleep spindle while the stimulus is played affected the ASSR (Figures 6 and 7). Spindle presence only significantly modulated the 14 Hz ITPC during the 14-Hz stimulation (Figure 7), but had no effect on the 40-Hz stimulus response at 40 Hz. In the first 500 ms of auditory stimulation a spindle presence led to a significant reduced ITPC at 14 Hz, specifically for a frontal and occipital cluster (t-value maps in Figure 7). In the second half of the tone stimulation, there was a significant reduction of the ITPC for a central electrode cluster. Intriguingly, when investigating the 1 – 7 Hz response (Figure 8), the initial increase at 0–0.5 s was significantly enhanced in spindle versus no-spindle condition for both the 14- (centro-parietal cluster) and 40-Hz stimuli (centro-parietal and frontal cluster). However, the second response at 1 – 1.5 s was significantly reduced in a frontal electrode cluster when a spindle was present compared to no spindle.
Figure 6.
First row represents group averaged time–frequency maps of inter-trial phase coherence (ITPC) with and without spindle presence during NREM sleep (electrode FCz). Values are Rayleigh Z-corrected to account for unequal number of trials. The second row illustrates z-scored wavelet amplitude values and illustrates a clear increase of spindle activity in the spindle condition relative to the whole NREM recording. Warm colors represent higher values and therefore stronger phase locking or amplitude increase.
Figure 7.
Topographical representation of ITPC response at 14- and 40 Hz during an occurrence of a sleep spindles versus no spindle occurrence. The third column represents the t-value maps. Electrodes that showed significant differences after SnPM and suprathreshold cluster analysis are further marked in gray. Spin: Spindle.
Figure 8.
Topographical representation of ITPC response at 1–7 Hz during an occurrence of a sleep spindles versus no spindle occurrence. Electrodes that showed significant differences after SnPM and suprathreshold cluster analysis are further marked in gray in the t-value plots. Spin: Spindle.
Overall, ASSR was modulated by the presence of slow waves and sleep spindles. As for the vigilance states, the effects were dependent of the electrode location, stimulation frequency, and the analyzed window and frequency.
3.3. Different rhythmic auditory stimuli induced spindle activity during NREM sleep but not during wakefulness
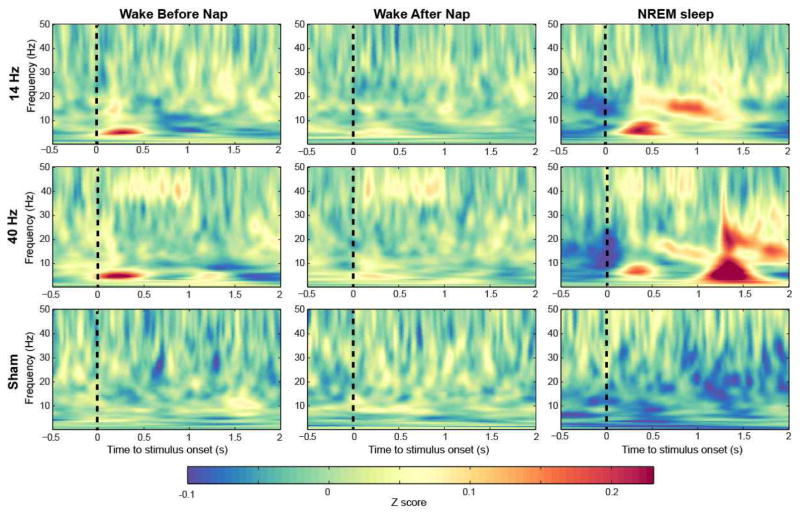
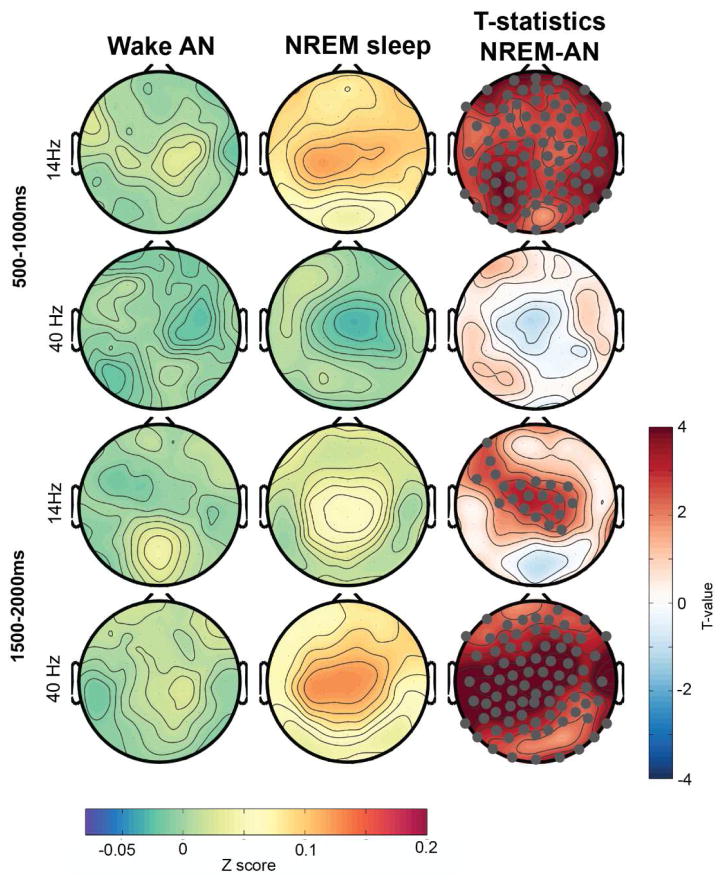
While investigating ASSR response to spindles we observed that the likelihood to observe a spindle in the window of auditory stimulation was significantly increased with 14- and 40-Hz stimulation compared to sham (n=9, sham: 14.5% ± 1.5%, 14 Hz: 19.9% ± 2.0%, 40 Hz: 18.9 ± 2.4, p < 0.05). Thus, rhythmic auditory stimuli did not only produce the classical ASSR during NREM sleep but further induced sleep spindle activity for both, the 14- and the 40-Hz stimulation. This spindle activity increase did not immediately start with stimuli onset but approximately 300–500s after tone onset (Figure 9). The spectral response induced with 40 Hz stimulation led further to pronounced spectrum increases in other frequency bands (e.g. delta-theta to beta), specifically when the tone offset happened. The spindle increase (illustrated as significantly enhanced z-scored spindle amplitude during NREM sleep compared to wakefulness in t-value maps) was topographically widespread with the strongest average response around central regions (Figure 10). The increase was strongest for 14-Hz stimuli within the window 500–1000 ms after stimulation start and for the 40-Hz stimuli after the tone ended between 1500–2000 ms relative to tone onset.
Figure 9.
Group averaged time–frequency maps z-scored wavelet amplitude across wakefulness before and after sleep, and NREM sleep (electrode FCz).
Figure 10.
Topographical distribution of z-scored wavelet amplitude in the spindle frequency range (11 – 16 Hz) for 14- and 40-Hz stimulation during both wakefulness and NREM sleep. Electrodes that showed significant difference using a paired t-test and survived SnPM and suprathreshold cluster analysis are marked in gray (in t-value maps). AN: After nap.
Consequently, different rhythmic auditory stimuli can globally induce sleep spindles, but only during NREM sleep and not during wakefulness. The time relative to the tone onset in which the magnitude of power increase is strongest depends on the stimulation frequency applied.
4. Discussion
Our study revealed that ASSR for different rhythmic stimuli is affected by vigilance states and the presence of dominant NREM sleep rhythms. In addition, when rhythmic auditory stimuli are applied during NREM sleep they do not only produce an ASSR, but also they further increase spindle activity during and shortly after the presentation of the tone.
4.1. ASSR during wakefulness: effect of high and low sleep pressure
The wakefulness session before the nap condition is characterized by higher sleep pressure than the wakefulness session after nap. Sleep pressure refers to the homeostatic process, which is part of the two-stage model of sleep regulation (Achermann and Borbély, 2011; Borbely et al., 2016). The homeostatic process, reflecting sleep pressure or sleep need, builds up with longer times awake without sleep in between. Consequently, a nap reduces this homeostatic process and therefore sleep pressure. When perceived sleepiness was assessed before each wakefulness block, participants tended to report being less sleepy after the nap (VAS scale 0 not sleepy at all, 10 very much sleepy, BN: 6.1±0.4, AN: 4.7±0.6, p=0.1). However, as subjectively perceived by the experimenter, the difference of drowsiness became more obvious in the course of the wakefulness session. That is, participants had consistently more difficulties to stay awake before the nap than after the nap. Increased drowsiness did not significantly affect 40 Hz ITPC to 40-Hz stimuli. This is in contrast with Griskova et al. (2007) who reported increased phase-locking in higher drowsiness states. A possible explanation for this discrepancy could be that the high and low arousal conditions in the Griskova et al. (2007) study had a stronger contrast, e.g. reading vs. laying and having eyes closed. This subtle difference in drowsiness with otherwise similar conditions (e.g. laying with eyes open and focusing on a crosshair) does not affect the 40 Hz ITPC. The ITPC at 14 Hz relative to the 14-Hz stimulus was more widespread before the nap than after the nap, which was reflected in significantly higher ITPC for the before nap condition specifically for occipital electrodes. This finding is novel and cannot be compared to previous literature. Whether this effect is related to the level of drowsiness or the difference in sleep history needs further investigation.
Both, 14- and 40-Hz stimuli elicited a classical ERP response (reflected in ITPC between 1–7 Hz) when the amplitude modulation of the white noise started and ended. However, this response was strongly affected by the wakefulness condition. That is, the ERP response was consistently stronger before the nap than after the nap over fronto-central regions. It was recently shown that there is a significant decline in auditory evoked amplitude (N1, P2) after a period of sleep, specifically for fronto-central electrodes (Goldstein et al., 2011; Hulse et al., 2011). This change might be attributed to the synaptic strength decline observed during sleep and possibly reduced post synaptic potentials evoked by auditory stimuli after sleep (Goldstein et al., 2011; Hulse et al., 2011; Tononi and Cirelli, 2014). Thus, our observed ITPC decreases at 1–7 Hz might reflect reduced auditory evoked potentials due to synaptic renormalization after sleep.
Overall, these results emphasize the importance of carefully controlling levels of drowsiness and sleep history when brain responses to auditory stimuli are investigated.
4.2. ASSR differences between wake and NREM sleep
In accordance to previous studies (Cohen et al., 1991; Jerger et al., 1986; Linden et al., 1985; Picton et al., 2003b) we found a significantly decreased ASSR at 40 Hz (reflected in reduced phase-locking) to 40-Hz stimuli and at 14 Hz to 14-Hz stimuli during NREM sleep compared to wakefulness. The reduced 40-Hz response might be related to the presence of slow waves (reflected in increased delta activity) because it was more reduced when participants were in deeper sleep stages that is when more delta activity was present. This is in accordance with Picton et al. (2003b) who showed further reduced 40 Hz response in sleep stage 3 (more delta activity) compared to sleep stage 2 (less delta activity). The decrease of ASSR with sleep depth did not seem to hold true for all stimulus frequencies applied. We found an increased phase-locking to 14-Hz when SWA was strongest. Along the same line, the presence of sleep spindles had different effects on the ITPC depending on the stimulation frequency applied. Phase locking at 14 Hz to the 14-Hz stimulus was reduced when spindle activity was high. Furthermore, this decrease was specifically for a centro-parietal sensor band, the same band that was reduced when comparing the 14 Hz response from wakefulness to NREM sleep. Thus, the presence of sleep spindles that are restricted to NREM sleep might explain the ASSR difference from wakefulness to NREM sleep. These results are in line with the hypothesis that spindles shield sleep from disruption, e.g. protect from noise by blocking auditory transmission (Dang-Vu et al., 2011; Dang-Vu et al., 2010; Schabus et al., 2012). Yet, this blocking of auditory transmission was not present for the 40-Hz condition. One possible explanation for this discrepancy could be that the spindle activity was not that high in the first 500ms when the tone started but only the second half of the stimulus presentation. Because the 40 Hz ITPC was clearly reduced in the second half of sound stimulus, independent whether it was sleep or wakefulness, the presence of a spindle only resulted in a slight reduction of the response and did not reach significance. This explanation also points to the idea that only a strong presence of sleep spindle activity will reduce the transmission of 40-Hz stimuli. Future animal studies are needed to investigate this hypothesis and possible underlying mechanisms.
Of note, not all EEG sensors showed a NREM sleep related decrease in phase-locking but a few frontal (40 Hz ITPC) or occipital electrodes (14 Hz ITPC) even exhibited an enhancement. Specifically for the 14 Hz ITPC topographical distributing between wake and sleep seemed to be clearly different. Phase-locking in the wakefulness (AN) session had a distinct central maximum whereas NREM sleep had maximal phase-locking over frontal and occipital regions. Thus, it is important to take the sensor location into account when the ASSR response is measured and used to compare conditions. For instance, ASSR at 40-Hz has been used to monitor level of anesthesia (e.g. (Bonhomme et al., 2000)), however it remains to date unclear whether the changes in ASSR with anesthesia are consistent for different EEG sensor locations or not.
The phase-locking at 1–7 Hz was overall reduced following 14-Hz and 40-Hz stimulation, except for a parietal cluster in the 40 Hz condition (tone offset ITPC). Intriguingly, topographical distribution of phase-locking at 1–7 Hz showed a clear right lateralization during wakefulness. This right lateralization is also slightly visible in the 14 Hz and 40 Hz ITPC that has been reported in previous studies (Ross et al., 2005). However, during NREM sleep the right lateralization is completely vanished. The effects of the presence of delta and spindle activity on 1–7 Hz phase locking response were mixed and mainly dependent of which time window the analysis was focused on. The amount of slow waves only significantly reduced the 1–7 Hz phase locking response with the tone offset. In contrast when comparing the spindle to no spindle condition, the initial 1–7 Hz phase locking was significantly increased and the ITPC to the offset was decreased. As for the 40 Hz ITPC, because the strongest spindle activity increase was not immediately when the tone stimulus started but about 0.5 s after the start to 1.5s phase-locking might have specifically decreased the 1–1.5 s 1–7 Hz because spindle activity was strongest at this time. The significant increased phase-locking for the initial 1–7 Hz response at 0 – 0.5 s is more difficult to interpret. We see a clear increase in spindle activity with the application of frequency modulated auditory stimuli and the likelihood of detecting a spindle while auditory stimuli are presented compared to just having white noise. Thus, it could be that specifically stimuli that elicited a strong initial 1–7 Hz response might induce a sleep spindle. Overall, the presence of sleep spindles and slow waves cannot fully explain why we see clear reductions in the 1–7 Hz ITPC (also specifically at the tone offset) and a vanished lateralization of this response in NREM sleep compared to wakefulness.
Rhythmic auditory stimuli not only produce the classical ASSR in NREM sleep but further induce sleep spindles. Thus, rhythmic stimuli cannot only be used to probe the system but further to modulate brain activity during sleep. A recent study reported an increase of amount of sleep spindles with the application of rhythmic stimuli (Antony and Paller, 2016). In contrast to our results, they only obtained and increased spindle density if the modulation frequency of the white noise was in the spindle frequency range (e.g. 12 and 15 Hz) but they did not see a change with 50 Hz stimulation. Sleep spindles play an important role in memory consolidation and several conditions, e.g. ageing and schizophrenia, are characterized by reduced sleep spindles along with impaired memory functions (Fogel et al., 2014; Lustenberger et al., 2016; Manoach et al., 2015; Rasch and Born, 2013). Thus, non-invasive approaches that can enhance sleep spindles are of central interest. Future studies are needed to test the potential of our approach to enhance sleep spindles during sleep and memory consolidation.
The changes in phase-locking between wakefulness and NREM sleep might be related to different hyperpolarization levels and firing properties of the thalamo-cortical system that is involved in generating the ASSR. The thalamo-cortical transmission of auditory stimuli has been shown to be affected by neuromodulators, such as acetylcholine (McCormick, 1989). The input of neuromodulators to the thalamic-cortical system changes dramatically between wakefulness and sleep (Saper et al., 2005). Neuromodulatory input from the brainstem is inhibited during NREM sleep, which promotes a burst-firing mode in thalamo-cortical neurons. This mode facilitates the occurrence of slow waves and sleep spindles. During wakefulness these neurons are tonically firing preventing the occurrence of sleep specific rhythms. Thus, sleep spindles can only be induced by tones when a person is in NREM sleep and thalamocortical system in the burst firing mode. A reduced input of acetylcholine to the thalamus has been shown to reduce thalamic transmission of information (e.g. auditory stimuli) to the cortex (McCormick, 1989). Several features of the investigated ASSR response are reduced during NREM sleep compared to wake, which can be explained by a reduced transmission. Yet, it still remains unclear why some specific properties of auditory processing we investigated are even increased during NREM sleep or why we see contrary effects for different stimulation frequencies.
Acknowledgments
We thank Angela Pikus for helping data acquisition. Research reported in this publication was partially supported by the National Institute of Mental Health under Award Number R01MH101547 (to F.F.). The content is solely the responsibility of the authors and does not necessarily represent the official views of the National Institutes of Health. This work was also partially supported by UNC Psychiatry, UNC School of Medicine (to F.F.), the Swiss National Science Foundation (to C.L., grant P300PA_164693) and the Helen Lyng White postdoctoral fellowship (to S.A.).
Footnotes
Conflict of interest
Flavio Fröhlich is the lead inventor of IP filed on the topics of brain stimulation and sleep by UNC. Flavio Fröhlich is the founder, CSO and majority owner of Pulvinar Neuro LLC. The study reported here is unrelated to Pulvinar Neuro.
Publisher's Disclaimer: This is a PDF file of an unedited manuscript that has been accepted for publication. As a service to our customers we are providing this early version of the manuscript. The manuscript will undergo copyediting, typesetting, and review of the resulting proof before it is published in its final citable form. Please note that during the production process errors may be discovered which could affect the content, and all legal disclaimers that apply to the journal pertain.
References
- Achermann P, Borbély AA. Sleep homeostasis and models of sleep regulation. In: Kryger MH, Roth T, Dement WC, editors. Principles and practice of sleep medicine. Elsevier Saunders; Philadelphia: 2011. pp. 405–417. [Google Scholar]
- Andreasen NC, Arndt S, Swayze V, 2nd, Cizadlo T, Flaum M, O’Leary D, Ehrhardt JC, Yuh WT. Thalamic abnormalities in schizophrenia visualized through magnetic resonance image averaging. Science. 1994;266:294–298. doi: 10.1126/science.7939669. [DOI] [PubMed] [Google Scholar]
- Andrillon T, Nir Y, Staba RJ, Ferrarelli F, Cirelli C, Tononi G, Fried I. Sleep spindles in humans: insights from intracranial EEG and unit recordings. J Neurosci. 2011;31:17821–17834. doi: 10.1523/JNEUROSCI.2604-11.2011. [DOI] [PMC free article] [PubMed] [Google Scholar]
- Antony JW, Paller KA. Using Oscillating Sounds to Manipulate Sleep Spindles. Sleep. 2016 doi: 10.1093/sleep/zsw068. [DOI] [PMC free article] [PubMed] [Google Scholar]
- Avanzini G, Panzica F, De Curtis M. The role of the thalamus in vigilance and epileptogenic mechanisms. Clinical neurophysiology. 2000;111:S19–S26. doi: 10.1016/s1388-2457(00)00398-9. [DOI] [PubMed] [Google Scholar]
- Bonhomme V, Plourde G, Meuret P, Fiset P, Backman SB. Auditory steady-state response and bispectral index for assessing level of consciousness during propofol sedation and hypnosis. Anesth Analg. 2000;91:1398–1403. doi: 10.1097/00000539-200012000-00018. [DOI] [PubMed] [Google Scholar]
- Borbely AA, Daan S, Wirz-Justice A, Deboer T. The two-process model of sleep regulation: a reappraisal. J Sleep Res. 2016;25:131–143. doi: 10.1111/jsr.12371. [DOI] [PubMed] [Google Scholar]
- Cohen LT, Rickards FW, Clark GM. A comparison of steady-state evoked potentials to modulated tones in awake and sleeping humans. The Journal of the Acoustical Society of America. 1991;90:2467–2479. doi: 10.1121/1.402050. [DOI] [PubMed] [Google Scholar]
- Crail-Melendez D, Atriano-Mendieta C, Carrillo-Meza R, Ramirez-Bermudez J. Schizophrenia-like psychosis associated with right lacunar thalamic infarct. Neurocase. 2013;19:22–26. doi: 10.1080/13554794.2011.654211. [DOI] [PubMed] [Google Scholar]
- Dang-Vu TT, Bonjean M, Schabus M, Boly M, Darsaud A, Desseilles M, Degueldre C, Balteau E, Phillips C, Luxen A, Sejnowski TJ, Maquet P. Interplay between spontaneous and induced brain activity during human non-rapid eye movement sleep. Proc Natl Acad Sci U S A. 2011;108:15438–15443. doi: 10.1073/pnas.1112503108. [DOI] [PMC free article] [PubMed] [Google Scholar]
- Dang-Vu TT, McKinney SM, Buxton OM, Solet JM, Ellenbogen JM. Spontaneous brain rhythms predict sleep stability in the face of noise. Curr Biol. 2010;20:R626–627. doi: 10.1016/j.cub.2010.06.032. [DOI] [PubMed] [Google Scholar]
- De Gennaro L, Ferrara M. Sleep spindles: An overview. Sleep Med Rev. 2003;7:423–440. doi: 10.1053/smrv.2002.0252. [DOI] [PubMed] [Google Scholar]
- Dimitrijevic A, Ross B. Neural Generators of the Auditory Steady-State. The Auditory Steady-State Response: Generation, Recording, and Clinical Application. 2008:83. [Google Scholar]
- Ferrarelli F, Huber R, Peterson MJ, Massimini M, Murphy M, Riedner BA, Watson A, Bria P, Tononi G. Reduced sleep spindle activity in schizophrenia patients. Am J Psychiatry. 2007;164:483–492. doi: 10.1176/ajp.2007.164.3.483. [DOI] [PubMed] [Google Scholar]
- Fisher NI. Statistical analysis of circular data. Cambridge University Press; 1995. [Google Scholar]
- Fogel SM, Albouy G, Vien C, Popovicci R, King BR, Hoge R, Jbabdi S, Benali H, Karni A, Maquet P, Carrier J, Doyon J. fMRI and sleep correlates of the age-related impairment in motor memory consolidation. Hum Brain Mapp. 2014;35:3625–3645. doi: 10.1002/hbm.22426. [DOI] [PMC free article] [PubMed] [Google Scholar]
- Goldstein MR, Plante DT, Hulse BK, Sarasso S, Landsness EC, Tononi G, Benca RM. Overnight changes in waking auditory evoked potential amplitude reflect altered sleep homeostasis in major depression. Acta Psychiatr Scand. 2011 doi: 10.1111/j.1600-0447.2011.01796.x. [DOI] [PMC free article] [PubMed] [Google Scholar]
- Griskova-Bulanova I, Dapsys K, Maciulis V. Does brain ability to synchronize with 40 Hz auditory stimulation change with age? Acta Neurobiol Exp (Wars) 2013;73:564–570. doi: 10.55782/ane-2013-1960. [DOI] [PubMed] [Google Scholar]
- Griskova-Bulanova I, Griksiene R, Korostenskaja M, Ruksenas O. 40 Hz auditory steady-state response in females: When is it better to entrain? Acta Neurobiol Exp (Wars) 2014;74:91–97. doi: 10.55782/ane-2014-1975. [DOI] [PubMed] [Google Scholar]
- Griskova-Bulanova I, Ruksenas O, Dapsys K, Maciulis V, Arnfred SM. Distraction task rather than focal attention modulates gamma activity associated with auditory steady-state responses (ASSRs) Clin Neurophysiol. 2011;122:1541–1548. doi: 10.1016/j.clinph.2011.02.005. [DOI] [PubMed] [Google Scholar]
- Griskova I, Morup M, Parnas J, Ruksenas O, Arnfred SM. The amplitude and phase precision of 40 Hz auditory steady-state response depend on the level of arousal. Exp Brain Res. 2007;183:133–138. doi: 10.1007/s00221-007-1111-0. [DOI] [PubMed] [Google Scholar]
- Huber R, Ghilardi MF, Massimini M, Ferrarelli F, Riedner BA, Peterson MJ, Tononi G. Arm immobilization causes cortical plastic changes and locally decreases sleep slow wave activity. Nat Neurosci. 2006;9:1169–1176. doi: 10.1038/nn1758. [DOI] [PubMed] [Google Scholar]
- Hulse BK, Landsness EC, Sarasso S, Ferrarelli F, Guokas JJ, Wanger T, Tononi G. A postsleep decline in auditory evoked potential amplitude reflects sleep homeostasis. Clin Neurophysiol. 2011;122:1549–1555. doi: 10.1016/j.clinph.2011.01.041. [DOI] [PMC free article] [PubMed] [Google Scholar]
- Jerger J, Chmiel R, Frost JD, Jr, Coker N. Effect of sleep on the auditory steady state evoked potential. Ear Hear. 1986;7:240–245. doi: 10.1097/00003446-198608000-00004. [DOI] [PubMed] [Google Scholar]
- Linden RD, Campbell KB, Hamel G, Picton TW. Human auditory steady state evoked potentials during sleep. Ear Hear. 1985;6:167–174. doi: 10.1097/00003446-198505000-00008. [DOI] [PubMed] [Google Scholar]
- Llinás RR, Steriade M. Bursting of thalamic neurons and states of vigilance. Journal of neurophysiology. 2006;95:3297–3308. doi: 10.1152/jn.00166.2006. [DOI] [PubMed] [Google Scholar]
- Lustenberger C, Boyle MR, Alagapan S, Mellin JM, Vaughn BV, Frohlich F. Feedback-Controlled Transcranial Alternating Current Stimulation Reveals a Functional Role of Sleep Spindles in Motor Memory Consolidation. Current Biology. 2016;26:2127–2136. doi: 10.1016/j.cub.2016.06.044. [DOI] [PMC free article] [PubMed] [Google Scholar]
- Lustenberger C, Murbach M, Tushaus L, Wehrle F, Kuster N, Achermann P, Huber R. Inter-individual and intra-individual variation of the effects of pulsed RF EMF exposure on the human sleep EEG. Bioelectromagnetics. 2015a;36:169–177. doi: 10.1002/bem.21893. [DOI] [PubMed] [Google Scholar]
- Lustenberger C, Wehrle F, Tushaus L, Achermann P, Huber R. The Multidimensional Aspects of Sleep Spindles and Their Relationship to Word-Pair Memory Consolidation. Sleep. 2015b doi: 10.5665/sleep.4820. [DOI] [PMC free article] [PubMed] [Google Scholar]
- Manoach DS, Pan JQ, Purcell SM, Stickgold R. Reduced Sleep Spindles in Schizophrenia: A Treatable Endophenotype That Links Risk Genes to Impaired Cognition? Biol Psychiatry. 2015 doi: 10.1016/j.biopsych.2015.10.003. [DOI] [PMC free article] [PubMed] [Google Scholar]
- McCormick DA. Cholinergic and noradrenergic modulation of thalamocortical processing. Trends in neurosciences. 1989;12:215–221. doi: 10.1016/0166-2236(89)90125-2. [DOI] [PubMed] [Google Scholar]
- Meltzer B, Reichenbach CS, Braiman C, Schiff ND, Hudspeth AJ, Reichenbach T. The steady-state response of the cerebral cortex to the beat of music reflects both the comprehension of music and attention. Frontiers in human neuroscience. 2015:9. doi: 10.3389/fnhum.2015.00436. [DOI] [PMC free article] [PubMed] [Google Scholar]
- Monk TH. A visual analogue scale technique to measure global vigor and affect. Psychiatry research. 1989;27:89–99. doi: 10.1016/0165-1781(89)90013-9. [DOI] [PubMed] [Google Scholar]
- Mullen T, Kothe C, Chi YM, Ojeda A, Kerth T, Makeig S, Cauwenberghs G, Jung T-P. Real-time modeling and 3D visualization of source dynamics and connectivity using wearable EEG. Engineering in Medicine and Biology Society (EMBC), 2013 35th Annual International Conference of the IEEE; IEEE; 2013. pp. 2184–2187. [DOI] [PMC free article] [PubMed] [Google Scholar]
- Nichols TE, Holmes AP. Nonparametric permutation tests for functional neuroimaging: a primer with examples. Human brain mapping. 2002;15:1–25. doi: 10.1002/hbm.1058. [DOI] [PMC free article] [PubMed] [Google Scholar]
- Patel YA, George A, Dorval AD, White JA, Christini DJ, Butera RJ. Hard real-time closed-loop electrophysiology with the Real-Time eXperiment Interface (RTXI) PLOS Computational Biology. 2017;13:e1005430. doi: 10.1371/journal.pcbi.1005430. [DOI] [PMC free article] [PubMed] [Google Scholar]
- Picton TW, John MS, Dimitrijevic A, Purcell D. Human auditory steady-state responses: Respuestas auditivas de estado estable en humanos. Int J Audiol. 2003a;42:177–219. doi: 10.3109/14992020309101316. [DOI] [PubMed] [Google Scholar]
- Picton TW, John MS, Purcell DW, Plourde G. Human auditory steady-state responses: the effects of recording technique and state of arousal. Anesth Analg. 2003b;97:1396–1402. doi: 10.1213/01.ANE.0000082994.22466.DD. [DOI] [PubMed] [Google Scholar]
- Plante DT, Goldstein MR, Cook JD, Smith R, Riedner BA, Rumble ME, Jelenchick L, Roth A, Tononi G, Benca RM, Peterson MJ. Effects of partial sleep deprivation on slow waves during non-rapid eye movement sleep: A high density EEG investigation. Clin Neurophysiol. 2016;127:1436–1444. doi: 10.1016/j.clinph.2015.10.040. [DOI] [PMC free article] [PubMed] [Google Scholar]
- Plourde G, Baribeau J, Bonhomme V. Ketamine increases the amplitude of the 40-Hz auditory steady-state response in humans. Br J Anaesth. 1997;78:524–529. doi: 10.1093/bja/78.5.524. [DOI] [PubMed] [Google Scholar]
- Plourde G, Garcia-Asensi A, Backman S, Deschamps A, Chartrand D, Fiset P, Picton TW. Attenuation of the 40-hertz auditory steady state response by propofol involves the cortical and subcortical generators. Anesthesiology. 2008;108:233–242. doi: 10.1097/01.anes.0000299839.33721.6d. [DOI] [PubMed] [Google Scholar]
- Plourde G, Villemure C, Fiset P, Bonhomme V, Backman SB. Effect of isoflurane on the auditory steady-state response and on consciousness in human volunteers. Anesthesiology. 1998;89:844–851. doi: 10.1097/00000542-199810000-00008. [DOI] [PubMed] [Google Scholar]
- Poulsen C, Picton TW, Paus T. Age-related changes in transient and oscillatory brain responses to auditory stimulation during early adolescence. Dev Sci. 2009;12:220–235. doi: 10.1111/j.1467-7687.2008.00760.x. [DOI] [PubMed] [Google Scholar]
- Rasch B, Born J. About Sleep’s Role in Memory. Physiol Rev. 2013;93:681–766. doi: 10.1152/physrev.00032.2012. [DOI] [PMC free article] [PubMed] [Google Scholar]
- Ribary U, Ioannides AA, Singh KD, Hasson R, Bolton JP, Lado F, Mogilner A, Llinas R. Magnetic field tomography of coherent thalamocortical 40-Hz oscillations in humans. Proc Natl Acad Sci U S A. 1991;88:11037–11041. doi: 10.1073/pnas.88.24.11037. [DOI] [PMC free article] [PubMed] [Google Scholar]
- Ross B, Herdman AT, Pantev C. Right hemispheric laterality of human 40 Hz auditory steady-state responses. Cereb Cortex. 2005;15:2029–2039. doi: 10.1093/cercor/bhi078. [DOI] [PubMed] [Google Scholar]
- Saper CB, Scammell TE, Lu J. Hypothalamic regulation of sleep and circadian rhythms. Nature. 2005;437:1257–1263. doi: 10.1038/nature04284. [DOI] [PubMed] [Google Scholar]
- Schabus M, Dang-Vu TT, Heib DP, Boly M, Desseilles M, Vandewalle G, Schmidt C, Albouy G, Darsaud A, Gais S, Degueldre C, Balteau E, Phillips C, Luxen A, Maquet P. The Fate of Incoming Stimuli during NREM Sleep is Determined by Spindles and the Phase of the Slow Oscillation. Front Neurol. 2012;3:40. doi: 10.3389/fneur.2012.00040. [DOI] [PMC free article] [PubMed] [Google Scholar]
- Steriade M, Timofeev I. Neuronal plasticity in thalamocortical networks during sleep and waking oscillations. Neuron. 2003;37:563–576. doi: 10.1016/s0896-6273(03)00065-5. [DOI] [PubMed] [Google Scholar]
- Theberge J, Bartha R, Drost DJ, Menon RS, Malla A, Takhar J, Neufeld RW, Rogers J, Pavlosky W, Schaefer B, Densmore M, Al-Semaan Y, Williamson PC. Glutamate and glutamine measured with 4.0 T proton MRS in never-treated patients with schizophrenia and healthy volunteers. Am J Psychiatry. 2002;159:1944–1946. doi: 10.1176/appi.ajp.159.11.1944. [DOI] [PubMed] [Google Scholar]
- Thune H, Recasens M, Uhlhaas PJ. The 40-Hz Auditory Steady-State Response in Patients With Schizophrenia: A Meta-analysis. JAMA Psychiatry. 2016;73:1145–1153. doi: 10.1001/jamapsychiatry.2016.2619. [DOI] [PubMed] [Google Scholar]
- Thut G, Schyns PG, Gross J. Entrainment of perceptually relevant brain oscillations by non-invasive rhythmic stimulation of the human brain. Front Psychol. 2011;2:170. doi: 10.3389/fpsyg.2011.00170. [DOI] [PMC free article] [PubMed] [Google Scholar]
- Tlumak AI, Durrant JD, Delgado RE, Boston JR. Steady-state analysis of auditory evoked potentials over a wide range of stimulus repetition rates in awake vs. natural sleep. Int J Audiol. 2012;51:418–423. doi: 10.3109/14992027.2011.645509. [DOI] [PubMed] [Google Scholar]
- Tononi G, Cirelli C. Sleep and the price of plasticity: from synaptic and cellular homeostasis to memory consolidation and integration. Neuron. 2014;81:12–34. doi: 10.1016/j.neuron.2013.12.025. [DOI] [PMC free article] [PubMed] [Google Scholar]
- Tononi G, Massimini M. Why does consciousness fade in early sleep? Annals of the New York Academy of Sciences. 2008;1129:330–334. doi: 10.1196/annals.1417.024. [DOI] [PubMed] [Google Scholar]
- Van Deursen J, Vuurman E, van Kranen-Mastenbroek V, Verhey F, Riedel W. 40-Hz steady state response in Alzheimer’s disease and mild cognitive impairment. Neurobiology of Aging. 2011;32:24–30. doi: 10.1016/j.neurobiolaging.2009.01.002. [DOI] [PubMed] [Google Scholar]
- Zhang L, Peng W, Zhang Z, Hu L. Distinct Features of Auditory Steady-State Responses as Compared to Transient Event-Related Potentials. PLoS One. 2013;8:e69164. doi: 10.1371/journal.pone.0069164. [DOI] [PMC free article] [PubMed] [Google Scholar]


