Abstract
The common marmoset (Callithrix jacchus) is a New-World monkey of growing interest in neuroscience. Magnetic resonance imaging (MRI) is an essential tool to unveil the anatomical and functional organization of the marmoset brain. To facilitate identification of regions of interest, it is desirable to register MR images to an atlas of the brain. However, currently available atlases of the marmoset brain are mainly based on 2D histological data, which are difficult to apply to 3D imaging techniques. Here, we constructed a 3D digital atlas based on high-resolution ex-vivo MRI images, including magnetization transfer ratio (a T1-like contrast), T2w images, and multi-shell diffusion MRI. Based on the multi-modal MRI images, we manually delineated 54 cortical areas and 16 subcortical regions on one hemisphere of the brain (the core version). The 54 cortical areas were merged into 13 larger cortical regions according to their locations to yield a coarse version of atlas, and also parcellated into 106 sub-regions using a connectivity-based parcellation method to produce a refined atlas. Finally, we compared the new atlas set with existing histology atlases and demonstrated its applications in connectome studies, and in resting state and stimulus-based fMRI. The atlas set has been integrated into the widely-distributed neuroimaging data analysis software AFNI and SUMA, providing a readily usable multi-modal template space with multi-level anatomical labels (including labels from the Paxinos atlas) that can facilitate various neuroimaging studies of marmosets.
Keywords: AFNI, Callithrix jacchus, Diffusion MRI, Non-human primate, Parcellation, Template
Graphical Abstract
1. Introduction
Neuroimaging techniques, especially magnetic resonance imaging (MRI), are important tools to reveal the anatomical and functional architecture of the brain, and have substantially expanded our knowledge of the human brain (Glasser et al., 2016b; Van Essen et al., 2013). Several recent large projects in particular have been launched that mainly utilize multi-modal MRI techniques to map the complex wiring diagram in human brains, such as the Human Connectome Project (Van Essen et al., 2013) and the Brainnetome Project (Jiang, 2013). Advancements in human neuroimaging studies have led to MRI techniques gradually becoming mainstream for translational studies in animal models (Liu et al., 2015; Silva, 2017; Zhang et al., 2012b). Historically, most animal studies were performed using non-MRI techniques, such as histology, microscopy, and electrophysiology, which examined the brain at different spatial resolutions from human neuroimaging studies, resulting in a large translational gap. One crucial advantage of MRI techniques is their high applicability in both humans and animals, allowing us to study the brain of multiple species at approximately the same spatial scale. This could facilitate the translation of preclinical studies (Oguz et al., 2012).
The common marmoset (Callithrix jacchus), a small New World monkey, is a valuable non-human primate model that has gained significant recent interest in neuroscience and preclinical research (Hashikawa et al., 2015; Homman-Ludiye and Bourne, 2017; Mitchell and Leopold, 2015). Due to its great potential in genetic engineering and its phylogenetic closeness to humans, the common marmoset has become an ideal animal model to fill the translational gap borne by rodent models (Kishi et al., 2014). As the marmoset is a relatively new animal model in neuroscience research, it is not yet fully supported by some of the many basic tools of neuroimaging studies that are already available for human brain research, such as a three-dimensional (3D) MRI-based brain atlas. Brain atlases are indispensable tools for identifying and analyzing neurological structures and connectomes (Fan et al., 2016; Glasser et al., 2016a). A few traditional paper atlases are available for the common marmoset, in which brain structures are delineated in 2D histological sections according to their cytoarchitecture and/or chemoarchitecture (Palazzi and Bordier, 2008; Paxinos et al., 2012; Yuasa et al., 2010). These atlases provide useful information regarding the marmoset neuroanatomy, but are insufficient to analyze MRI and connectome data. While recently published digital versions of the histology-based atlases may make such analysis feasible, for example by allowing registration of these atlases to MRI images (Hashikawa et al., 2015; Majka et al., 2016; Newman et al., 2009; Paxinos et al., 2012; Tokuno et al., 2009), the large gaps between consecutive sections of the histological plate and the different image contrasts make registration inaccurate without intensive manual correction. In addition, none of these atlases are integrated into any modern neuroimaging software, further limiting their usability.
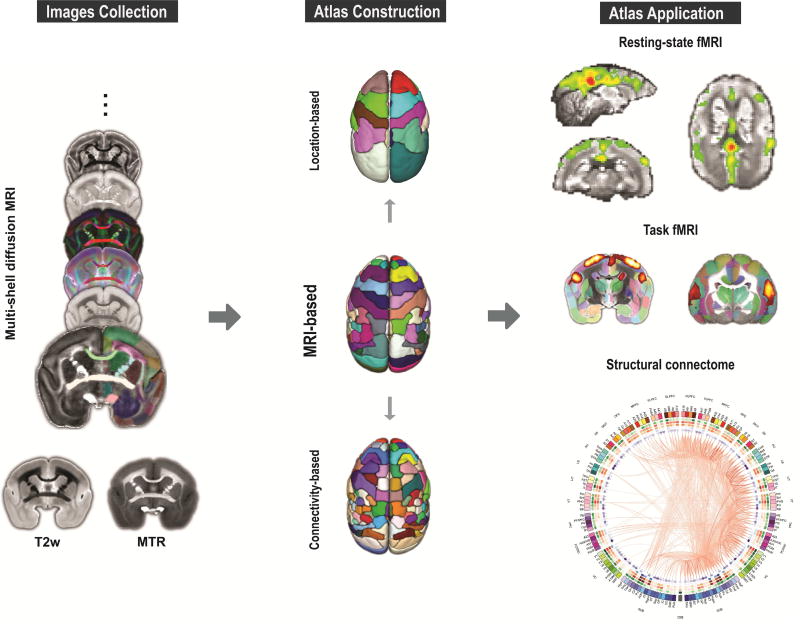
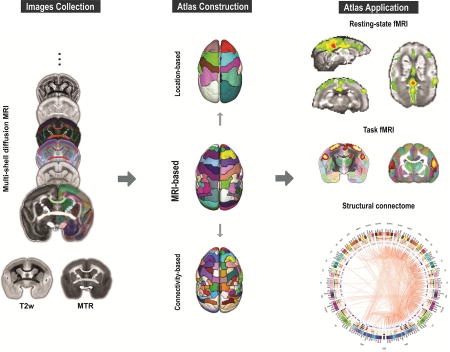
In the current study, we present a new MRI-based 3D digital atlas set of the marmoset brain (“NIH marmoset brain atlas”, or “NIH-MBA” for short) that is designed for MRI and connectome studies (Figure 1). A marmoset brain template space was created from a set of ex-vivo multi-modal high-resolution MR images, including magnetization transfer ratio (MTR, a T1-like contrast), T2-weighted (T2w) images, and multi-shell diffusion MRI. The core version of the atlas includes 54 cortical and 16 subcortical areas (in one brain hemisphere) that were manually delineated and annotated on the multi-modal MRI dataset with data-driven refinements. From this original core annotation, a coarse version was created by merging the original 54 cortical areas into 13 larger cortical areas based on their spatial locations. A refined version of the atlas was also created by subdividing the original 54 regions of the core version into 106 regions using an optimized structural connectivity-based parcellation method. Finally, we evaluated the atlas reliability by comparing it with existing histology-based atlases, and demonstrated its usability in various applications, including both resting-state and stimulus-based fMRI, as well as diffusion tractography and structural connectomes. The 3D digital atlas and its multi-modal templates will be distributed publicly in standard NIFTI formats that can be easily integrated with most neuroimaging software packages, for example AFNI and SUMA (https://afni.nimh.nih.gov/), and will become an invaluable tool to study the anatomical and functional architecture of the marmoset brain.
Figure 1. Overview of the construction of the marmoset brain atlas.
The marmoset brain atlas was built from a set of ex-vivo multi-modal high-resolution MRI images that included multi-shell diffusion MRI, T2w, and magnetization transfer ratio (MTR). Based on the manifold local MRI contrasts, we manually delineated 54 cortical areas and 16 subcortical regions on one brain hemisphere. From this original version, we also created a coarser version with 13 larger cortical regions joined together based on their spatial locations, as well as a refined version in which 106 cortical areas were determined by performing a connectivity-based parcellation using diffusion tractography. All 3 versions of the atlas were constructed on the right hemisphere and mirrored on the left hemisphere to create symmetric versions. The atlas set provides a readily usable 3D template space with anatomical labels that can facilitate various neuroimaging studies of marmosets.
2. Materials & Methods
2.1 Animals, MRI data collection and preprocessing
All procedures were approved by the Animal Care and Use Committee of the National Institute of Neurological Disorders and Stroke. Brain samples of five adult marmosets were recruited for the construction of the atlas. One marmoset (male, 4.5-year-old) was picked as the template subject to build the core version of the atlas, and the other four marmosets (two males, 8.4-year-old and 10.9-year-old; two females, 4.7-year-old and 3.9-year-old) were used as the validation dataset.
Ex-vivo MRI data were acquired on a 7T 30cm (Bruker Biospin) MRI platform with a 35-mm birdcage volume coil. Before MRI scanning, formalin-fixed marmoset brains were soaked with 0.15% gadopentetate dimeglumine (Magnevist, Bayer, Leverkusen, Germany) for 3 weeks to reduce the T1 relaxation time. The brains were fitted into 3D-printed brain holders to maintain them in an orientation convenient for later data processing (Guy et al., 2016). Multi-modal MRI data were collected for the template subject, including MTR, T2w image, and multi-shell diffusion MRI. The MTR image was collected with a 3D FLASH sequence: TR = 21.5 ms, TE = 3.6 ms, flip angle = 20°, FOV = 38.4×28.8×28.8 mm, matrix size = 256×192×192, resolution = 0.15 mm isotropic, number of averages = 4 and number of repetitions = 5, with (Ms) and without (M0) an offset magnetization transfer (±2000 HZ off resonance, Gaussian shaped), and total acquisition time was about 17.6 h. The T2w image was collected with a 3D MSME sequence: TR = 2000 ms, TE = 10.4 ms, flip angle = 180 °, FOV = 38.4×25.5×25.5 mm, matrix size = 256×170×170, resolution = 0.15 mm isotropic, number of averages = 1, and total acquisition time was about 13h. The multi-shell diffusion MRI was collected with a 3D diffusion-weighted spin-echo sequence: TR = 450ms, TE = 34ms, flip angle = 90°, FOV = 38.4×28.8×28.8 mm, matrix size = 256×192×192, resolution = 0.15 mm isotropic, a total of 396 DWI images for 3 shells (b = 2400, 4800, and 7200), 6 b0 and 126 directions per shell, number of average = 1 for the shells b= 2400 and 4800, number of averages = 2 for the shell b= 7200, and total acquisition time was about 150 hours (more than 6 days). Multi-shell gradient sampling schemes were generated by the IMOC method of the DMRITool (Cheng et al., 2015). For the other four marmosets, only a single-shell diffusion MRI (b = 4800) and an MTR image were collected. Diffusion MRI data were preprocessed and fitted the following diffusion models, including the diffusion tensor model (DTI), the diffusional kurtosis model (DKI) (Tabesh et al., 2011), the neurite orientation dispersion and density model (NODDI) (Zhang et al., 2012a) and the constrained spherical deconvolution (Tournier et al., 2004). These models provided alternative structural contrasts that complemented the T2w and MTR images. Detailed preprocessing procedures are described in Supplementary Methods.
The AC-PC coordinate system was adopted for the atlas set. All MRI images were co-registered so that the top slice of the anterior commissure (AC) and the bottom slice of the posterior commissure (PC) were on the same horizontal plane (z=0). The midpoint of the AC on the z=0 axis plane was set as the original of the template space (0,0,0). In addition, we also provided a transformation that converted the AC-PC coordinates to stereotaxic coordinates (Supplementary Figure S1 and Supplementary Methods). The transformation was estimated by affine aligning the ex-vivo images to an in-vivo structural image (with stereotaxic coordinates) from the same animal.
2.2 Construction of the MRI-based atlas
2.2.1 Manual delineation
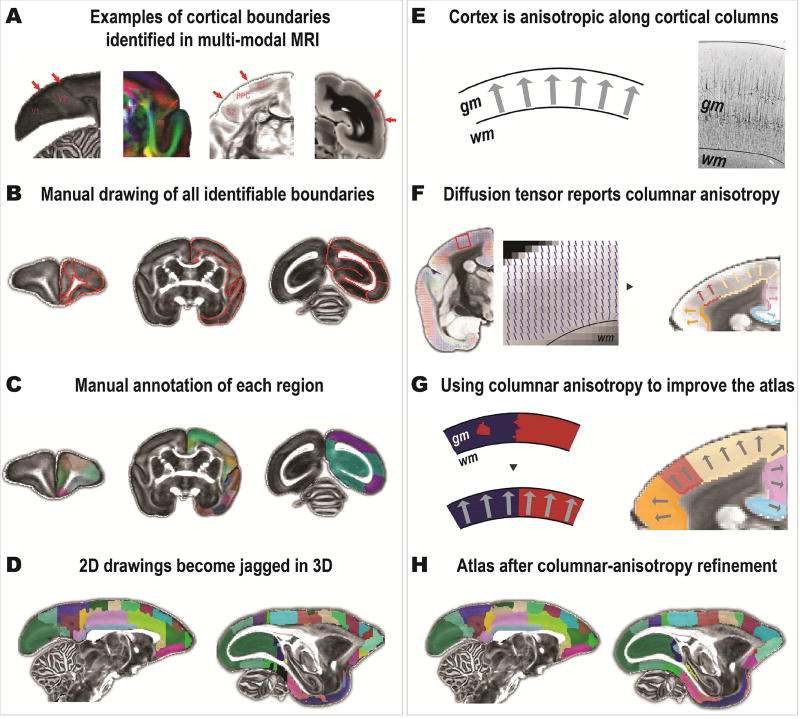
The MRI-based atlas (the core version) was constructed using the multi-modal MRI contrasts from the template subject. Each modality provided alternative views of the marmoset brain anatomy (Figure 2A and Supplementary Table S1). For example, the boundaries of the visual area V1 and V2 can be clearly identified in the fractional anisotropy (FA) image; the boundary between secondary somatosensory cortex (S2) and the insular cortex (Ins) is identifiable in the FA-weighted principal direction of the diffusion tensor; the posterior parietal cortex (PPC) can be isolated from somatosensory cortex (S1 and S2) in the orientation dispersion index of the NODDI model; and the MT area was a dark band in the T2w image. Based on these MRI contrasts, all possible regional boundaries were manually delineated on each coronal slice and then manually labeled and named using a similar nomenclature to the Paxinos atlas (Paxinos et al., 2012) (Figure 2B and 2C). In total, 54 cortical regions were drawn on the right hemisphere of the template. Additionally, 16 subcortical structures and the cerebellum were also delineated in our atlas. The labels of all brain regions are provided in Supplementary Table S2.
Figure 2. Construction of the MRI-based atlas and refinement based on columnar anisotropy.
(A) Examples of regional boundaries revealed by different MRI contrasts. From left to right, image contrasts are the fractional anisotropy, the principal direction of the diffusion tensor, the orientation dispersion index (ODI) of the NODDI, and a T2w image. (B) Regional boundaries were manually identified and delineated based on different image contrasts. (C) Each region was then manually labeled using a similar nomenclature as in the Paxinos atlas. (D) The manually-drawn atlas had “jagged” labels and errors. (E) Based on the cellular organization of the cortex, a “columnar anisotropy” can be identified. An example of SMI32-stained image demonstrates the vertically arranged neurons. (F) The principal direction of the diffusion tensor reflects the columnar anisotropy. Labels of the gray matter and the white matter boundaries could be used to relabel the cortex by following the columnar anisotropy. (G) The columnar anisotropy was used to improve cortical labelling. (H) The atlas after the relabeling process based on the columnar anisotropy.
2.2.2 Improving the atlas by the “columnar anisotropy”
As the atlas was drawn mainly on coronal sections, it appeared to be reasonably smooth in the coronal view, yet when viewing the atlas in either sagittal or axial views, many mismatches of cross-coronal-section boundaries (jagged labels) were noticed (Figure 2D). This is also a known issue when converting 2D drawings from 2D histology-based atlases into a 3D volume (Reveley et al., 2016). This could be improved by exploiting the columnar orientation (anisotropy) of the cortex. Cortical tissue tends to form columns whose orientation is approximately perpendicular to the cortical surface. In a previous study of the macaque atlas, an algorithm was used to find the radial columnar direction by simulating vector fields between the cortical surfaces (Reveley et al., 2016). When the direction can be found, the cortical voxels along the direction should be assigned with the same label (Figure 2E). In our high-resolution marmoset data, the principal diffusion direction map clearly outlines the cortical columnar orientation (Figure 2F). The cortex presents anisotropies along the direction of the cortical columns because most of the neurons are oriented perpendicular to the cortical surface and the most prominent neurons are pyramidal cells (Figure 2E). Here, we proposed an easier to implement, data-driven method to find the cortical columnar anisotropy, which was estimated by local probabilistic tractography. The probabilistic tracking was conducted using the PROBTRACKX2 of the FSL (Behrens et al., 2007; Behrens et al., 2003), and is described in Supplementary Methods. For each voxel within the volume of the cortex, the tractography could find one voxel on the GM-WM boundary that had the highest connectivity probability with it. The label of the voxel on the GM-WM boundary was then used to relabel the corresponding voxel of the cortex (Figure 2F). This approach corrected most jagged labels and errors (Figure 2G and 2H). Finally, a mode filter to find the most commonly found region index within a small local neighborhood (a kernel of 0.3 mm) was used to effectively smooth the atlas (Reveley et al., 2016).
2.2.3 Refining boundaries by comparing atlases
We compared our atlas directly with existing histology-based atlases (Figure 3). Currently, there are two published histology-based atlases with digital access that follow a similar nomenclature to ours, the digital Paxinos atlas (Majka et al., 2016) from Marmoset Brain Architecture Project (http://marmoset.braincircuits.org/) and the digital Riken atlas (Hashikawa et al., 2015) from BSI-NI Marmoset (http://brainatlas.brain.riken.jp/marmoset/). The original parcellation of these two atlases has many small sub-regions, most of which are defined according to relative spatial positions. These sub-regions were merged to match the number of regions in our MRI-based atlas (Supplementary Table S3). For example, “area 46 dorsal part” and “area 46 ventral part” were merged into “area 46”. These two atlases (with Nissl stained images) were nonlinearly registered to the MTR template of our atlas by using Advanced Normalization Tools (ANTs) (Avants et al., 2011). Due to different contrasts and the large slice gaps of histology-based atlases, the registration between histology images (Nissl) and MRI images always produced many errors. We manually corrected those identifiable registration errors. Here, we used the Riken atlas for the comparison, as it had a smaller slice gap than the digital Paxinos atlas. We also registered and compared the two histology-based atlases with each other, and their differences could be regarded as a benchmark.
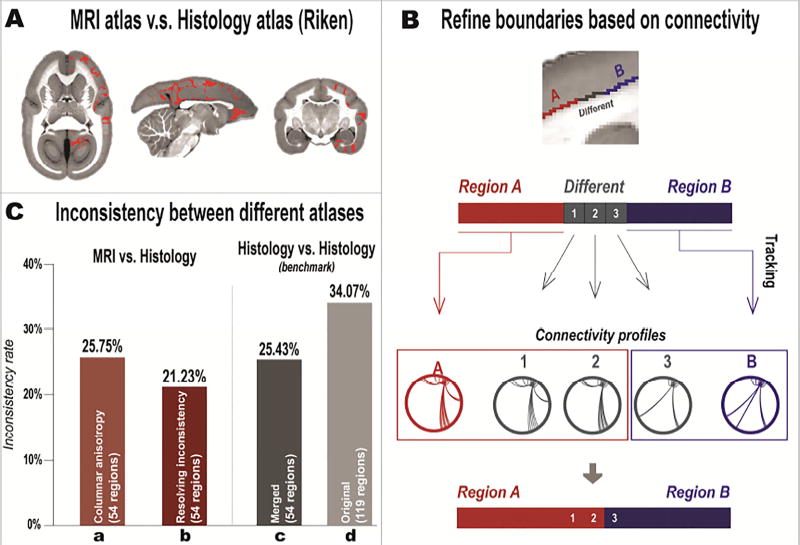
Figure 3. Refining the MRI-based atlas based on its differences from the existing histology-based atlas.
(A) Example of voxels that have different (inconsistent) labels (indicated in red) between the MRI atlas (after the columnar-anisotropy relabeling) and the Riken atlas. (B) Cortical areas that show inconsistencies between atlases were refined based on their connectivity profiles. Regions A (red) and B (blue) represent two adjacent areas that have the same (consistent) labels in both MRI and Riken atlases, while the boundary voxels (gray) represent areas with different (inconsistent) labels in the two atlases. Whole-brain tractography was performed for region A, region B, and for each gray voxel to map their connectivity patterns. The gray voxels were then assigned to either region A or B according to similarities of their connectivity patterns to each of the two regions. (C) Inconsistency rates between different atlases. “MRI vs. Histology” bars show inconsistency rates between the MRI atlas and the merged Riken atlas. “Columnar anisotropy” represents the MRI atlas after relabeling by the columnar anisotropy. “Resolving inconsistency” represents the MRI atlas after refining the cortical boundaries based on their connectivity patterns. “Histology vs. Histology” bars show the inconsistency rate between two histological atlases, the Riken atlas and the Paxinos atlas. “Original” represents the original histology atlases (119 cortical regions). “Merged” represents the histology atlases with the number of regions matched with the MRI atlas (54 cortical regions).
Our MRI-based atlas showed high consistency with the histology-based atlases with most differences located within regional boundaries (Figure 3A). The inconsistency rate between the MRI-based atlas (with the “columnar-anisotropy” refinement) and the Riken histology-based atlas was 25.75% (Figure 3C), which was similar to the benchmark rate of 25.43% measured between two histology-based atlases. The calculation of “inconsistency rate” is described in Supplementary Methods. Three factors could contribute to the inconsistency, including registration errors, individual variabilities and human biases (subjective errors) of manual delineation, which are difficult to manually correct.
Instead of ignoring those differences, we used them to refine the MRI-based atlas employing a data-driven approach (Figure 3B). For every two adjacent brain regions, we performed whole-brain tractography on each respective sub-region that was consistently labeled in both MRI-based and histology-based atlases, and also on each of the boundary voxels that were labeled differently (inconsistently) between the two atlases. The detailed tractography method is described in Supplementary Methods. Based on the tractography, we mapped the connectivity profiles of each consistent sub-region and of all boundary voxels with the rest of the brain, and calculated the Euclidean distance between the profiles. Each boundary voxel was then reassigned to the region with a similar connectivity pattern. By using this objective approach, we refined regional boundaries of the MRI-based atlas and reduced its inconsistency rate with the histology-based atlas to 21.23%, smaller than the benchmark rate (Figure 3C).
2.3 Construction of the location-based atlas
After the core version of the MRI-based atlas was constructed, we made two other versions (Figure 1): a coarse location-based atlas and a refined connectivity-based atlas. To obtain the location-based atlas, we merged the 54 cortical areas of the MRI-based atlas into 13 larger regions according to their spatial locations adopted from the Paxinos atlas (Paxinos et al., 2012). The 13 regions were: the dorsolateral prefrontal cortex; the ventrolateral prefrontal cortex; the medial prefrontal cortex; the orbital frontal cortex; the motor and premotor cortex; the somatosensory cortex; the auditory cortex; regions in lateral sulcus; lateral and inferior temporal areas; ventral areas of the temporal lobe; the posterior parietal cortex; the posterior cingulate and retrosplenial cortex regions; and the visual cortex.
2.4 Construction of the connectivity-based atlas
2.4.1 Connectivity-based parcellation
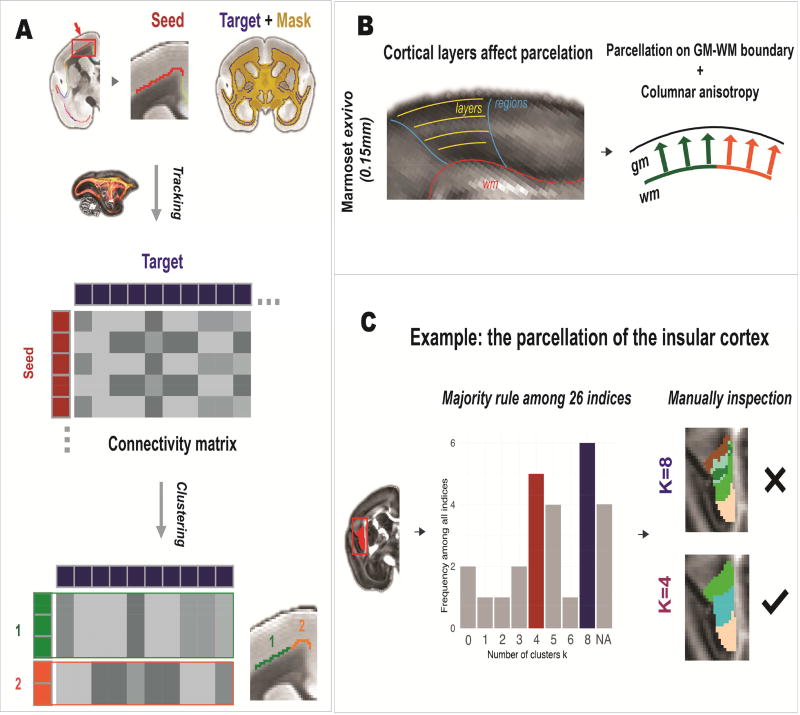
The refined connectivity-based atlas was obtained by parcellating the core version into 106 regions using a connectivity-based parcellation algorithm (Figure 1). The general pipeline of the parcellation was similar to those commonly used in the parcellation of the human brain (Figure 4A), in which whole-brain tractography was conducted from each voxel of a seed region to construct a seed-to-target connectivity matrix for the clustering. The detailed tractography method is described in Supplementary Methods. We used the same spectral clustering method used in previous studies of the human brain, which was implemented in the ATPP software (Li et al., 2017). The spectral clustering calculates the eigenvectors (spectrum) of the similarity matrix of the data and uses the spectrum as features for the clustering (Ng et al., 2002), and is a commonly-used method for the connectivity-based parcellation.
Figure 4. Construction of the connectivity-based atlas.
(A) Pipeline of the connectivity-based parcellation. Whole-brain tractography was performed for each seed voxel. The connectivity probability between each seed voxel and each target voxel was calculated to construct a seed-target connectivity matrix, which was then used to parcellate each seed region using a spectral clustering algorithm. (B) To avoid the influence of different cortical layers on the parcellation, only voxels residing in the GM-WM boundary were parcellated and then fused to the whole cortex according to our “columnar-anisotropy” method. (C) The number of clusters (K) was determined by computing multiple statistical indices followed by manual inspection. For example, although the indices suggested K=8 as the best solution to parcellate the insular cortex, manual inspection showed it resulted in many small and jagged clusters; on the other hand, the second optimal K=4 generated a better result and was selected for the final parcellation.
Although the general pipeline used was similar to the one used in human studies, we optimized the method to better fit our data. For high-resolution data of marmosets, cortical layers can be distinguished and therefore may be parcellated into different sub-regions. To avoid this issue, the parcellation algorithm was only performed on voxels residing in the GM-WM boundary of each brain region, and then the parcellation results were fused into the entire cortex using our columnar-anisotropy approach (Figure 4B).
The remaining question concerning the clustering algorithm was to define the optimal number of clusters (K). Many indices have been developed to estimate the optimal K. Instead of relying on a single index, we calculated 26 commonly-used indices using the Nbclust package of R language (Charrad et al., 2014), also listed in Supplementary Methods, and manually examined the optimal K according to a majority rule. Using the insular cortex as an example (Figure 4C), these indices suggested K=8 was the optimal number of clusters, however, the solution K=8 resulted in the insular cortex being parcellated into too many small and jagged sub-regions. We then examined the second optimal value for K (K=4), which generated a better result and was thus selected for the final parcellation. A threshold of 3 mm3 was used as the minimum volume for acceptable clusters. This threshold was chosen based on the size of the smallest region (3.1 mm3) in the MRI-based atlas. In result, a few small brain regions were not parcellated further. The parcellation was repeated for all brain regions of the core MRI-based atlas and finally produced a connectivity-based atlas with 106 cortical regions. The nomenclature of the connectivity-based atlas is described in Supplementary Methods.
2.4.2 Maximum probability map and cross-validation
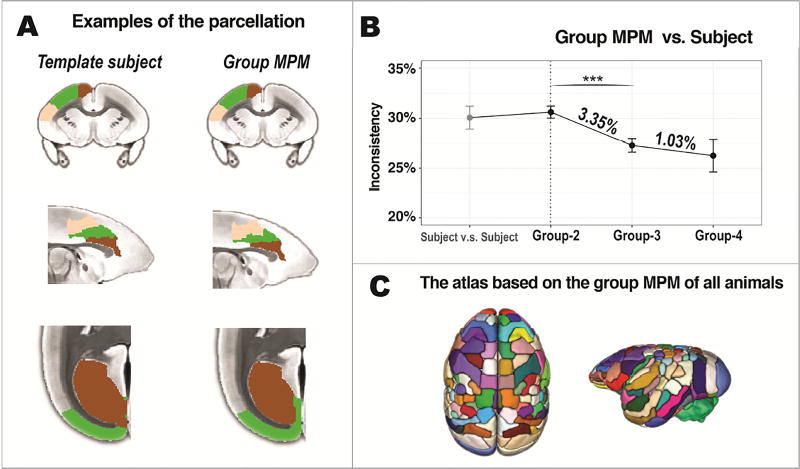
We parcellated the MRI-based atlas into a fine-grained version with 106 regions using a connectivity-based parcellation approach optimized for the marmoset data (Figure 4). The parcellation was performed directly on the template subject and on the other four marmosets after registering the MRI-based atlas to their native spaces. Their parcellation results were then transformed back to the template space and were used to construct the group Maximum Probability Map (MPM) that assigned most probable labels to each voxel according to the majority rule across subjects (Eickhoff et al., 2005; Fan et al., 2016). The parcellation of the template marmoset showed a high consistency with the group MPM (Figure 5A). To quantitatively evaluate the reproducibility of the parcellation, we conducted leave-k-out cross-validation on the parcellation results (Figure 5B). For the subject-subject comparison, the inconsistency rate was 30.09% on average. As two marmosets (Group-2) were insufficient to make a valid group MPM, its inconsistency rate was not improved (30.64%) for the group-subject comparison. However, when a valid group MPM was created (≥ 3 marmosets), the inconsistency rates were improved significantly to 27.29% (Group-3) and to 26.26% (Group-4). The group MPM was also close to a convergence, as “Group-3” had a significantly lower rate (3.35%, p < 0.001) than “Group-2” but “Group-4” had a non-significant lower rate (1.03%, p = 0.5854) than “Group-3”. Because lower inconsistency rate was observed with the group MPM than any subject parcellation, the final connectivity-based atlas was constructed based on the MPM of all five marmosets.
Figure 5. Evaluation of the connectivity-based atlas.
(A) Examples of parcellation. The left column shows the parcellation on the template subject. The right column shows the group Maximum Probability Map (MPM) of all marmosets. From top to bottom: parcellations of area 4, area 24 and visual area V1. Individual subject parcellations show high similarity with the group MPM parcellations (B) Cross-validation of the connectivity-based atlases. “Subject vs. Subject” represents differences in the connectivity-based atlases between any two marmosets; “Group vs. Subject” represents differences between the parcellation from one marmoset and from a group MPM of several other marmosets; “Group-2” represents an MPM based on two marmosets; “Group-3” based on three; and “Group-4” based on four marmosets, which is the maximum number can be tested with five marmosets in total. Values are presented as mean ± SEM. ***p<0.001, adjusted for multiple comparisons. (C) The final connectivity-based atlas was constructed based on the group MPM of all marmosets.
In the previous section (Figure 3C), we showed that the benchmark inconsistency rates (histology vs. histology) was 25.43% for the merged histology atlases (54 regions) and 30.64% for the original atlases (119 regions), suggesting that more brain regions result in higher inconsistency. Here, the inconsistency rate with 106 regions (26.26%) was close to the benchmark rate (25.43%; 54 regions), demonstrating the high reproducibility of the connectivity-based parcellation (Figure 5B).
2.5 Evaluation and applications
2.5.1 Structural connectome
The MRI-based atlas and the connectivity-based atlas provide a framework with brain regions as network nodes for constructing a whole-brain connectome. These two atlases were first nonlinearly transformed to each marmoset’s native space by ANTs, and network edges were then computed between each pair of nodes via probabilistic tractography. The detailed approach of the connectome construction is described in Supplementary Methods. These connectivity probabilities composed a structural connectome of each marmoset, which was displayed using the connectogram created by the Circos software (http://circos.ca).
2.5.2 Performance of registration
Using the same algorithm of ANTs, our MRI-based atlas, the Riken atlas, and the digital Paxinos atlas, were nonlinearly registered to different MR images, including ex-vivo MTR, ex-vivo T2w, ex-vivo FA (0.15 mm isotropic), in-vivo T1w (0.25 mm isotropic), in-vivo T2w (0.25 mm isotropic) and in-vivo EPI (0.5 mm isotropic) images. These images were collected from other marmosets unrelated to the atlases. For the MRI-based atlas, the MTR image of the template subject was used for the registration of ex-vivo MTR and in-vivo T1w image; the S0 image was used for ex-vivo T2w, in-vivo T2w and in-vivo EPI; the FA image was used for ex-vivo FA image. For the two histology-based atlases, their Nissl stained images were used for the registrations.
2.5.3 Resting-state and stimulus-based fMRI
Resting-state fMRI was collected from one awake marmoset on the same 7T MR platform. Training and awake imaging restraint procedures were described in our previous studies (Belcher et al., 2013; Silva et al., 2011). Data acquisition and preprocessing procedure is described in Supplementary Methods. By transforming our atlas to the data, the mean time course of a seed (PGMa) was extracted, and the seed’s temporal correlation with the whole brain was calculated to generate a correlation map.
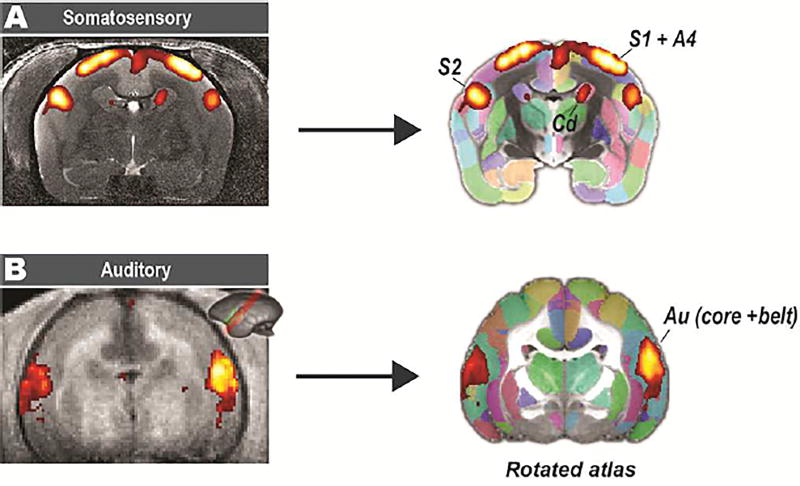
Two marmosets were recruited for the stimulus-based fMRI, one for somatosensory stimuli and the other for auditory stimuli. In brief, electrical stimuli were delivered to both hands of the awake marmoset using a block design, and a general linear model (GLM) was used to calculate activation maps. For the auditory stimuli, sound stimuli were delivered to the marmoset via MRI-compatible headphones designed for the marmoset. Only 8 slices were collected with an orientation parallel to the lateral sulcus with partial brain coverage.
2.6 Implementation and distribution
Our atlases and multi-modal MRI templates (NIH-MBA) are publicly available in NIFTI formats via the NITRC site (https://www.nitrc.org/projects/nih_marmoset/) or via an installation script from AFNI (@Install_NIH_Marmoset for version > 17.2.12). We integrated all atlases into the AFNI that provides fully-featured atlas functions, in which any brain regions and coordinates can be easily located and reported with multiple labels from different versions of atlases (Supplementary Figure S2), including our three atlases and the Paxinos atlas. In addition, the raw multi-shell diffusion MRI data are available and shared upon request. As the digital Paxinos atlas from the Marmoset Brain Architecture Project (http://marmoset.braincircuits.org/) was licensed under a CC BY-SA 4.0 License (https://creativecommons.org/licenses/by-sa/4.0/), the digital Paxinos atlas registered on our MRI template was included in the release as well under the same license.
3. Results
3.1 Structural connectome
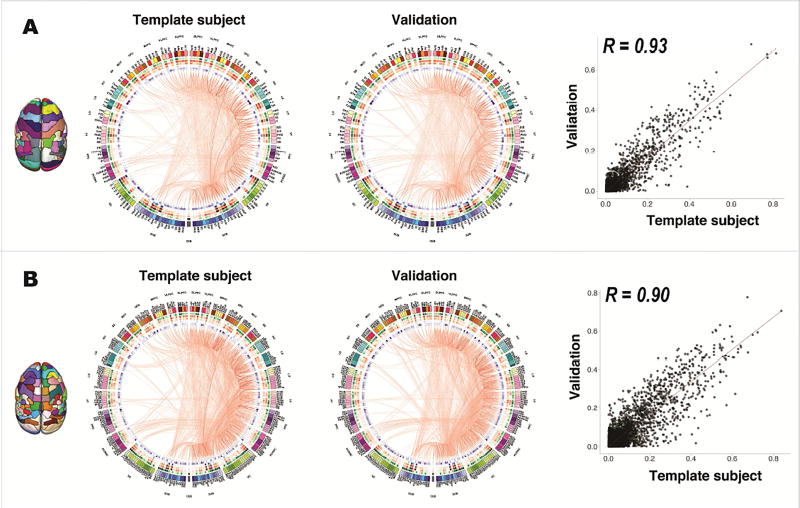
We used the atlas set to map the structural connectome of the marmoset brain by performing probabilistic tractography from each brain region (Figure 6). The connectome of the template subject shows highly similar patterns compared to the connectome of the validation dataset (the other four marmosets): the MRI-based atlas resulted in a high correlation of r=0.93 between the connectome of the template subject and that of the validation dataset (Figure 6A), and the connectivity-based atlas had a correlation of r=0.9 (Figure 6B), demonstrating the high reproducibility of the atlases.
Figure 6. Structural connectomes of the atlases.
(A) Structural connectome of the MRI-based atlas. For demonstration purposes, the connectomes were thresholded at a 20% network sparsity to remove potential false-positive edges with low connectivity probabilities, and only the edges of the right hemisphere are displayed. (B) Structural connectome of the connectivity-based atlas. The same probability thresholds were applied. From left to right are the connectome of the template subject, the averaged connectome of the other four validation animals, and the correlation of all connectivity probabilities between the connectome of the template subject and the averaged connectome of the validation animals. For the connectome graph, each color-coded column represents one brain region and a red line represents an edge between two brain regions. The thickness and the color depth represent the connectivity probability of each edge, where a thicker line and a darker color mean a higher probability. The heatmaps show network features, including regional volume (green), degree centrality (red), weighted strength (orange), betweenness centrality (blue) and cluster coefficient (purple), where a darker color means a higher value.
3.2 Performance of registration
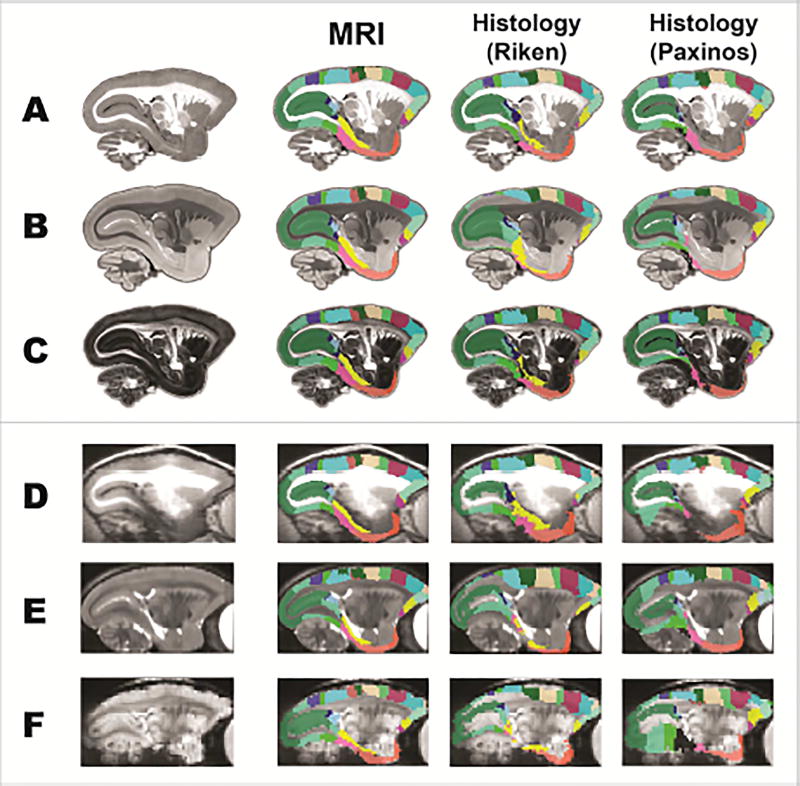
The usability of an atlas for an MRI study relies on the accuracy of the registration of its templates. The most commonly used anatomical image for registration in the ex-vivo MRI studies includes MTR, T2w and FA, and in the in-vivo studies includes T1w, T2w and EPI (DWI or fMRI). Here, we tested the performance of our MRI-based atlas (multi-modal MR images as the templates) with two existing histology-based atlases (Nissl stained images as the templates) on their nonlinear registration to these MRI modalities (Figure 7). The MRI-based atlas had better registration results, even in low-resolution and distorted EPI images. On the contrary, most of the registrations from the histology-based atlases were erroneous. Only their registrations to the MTR image was acceptable, but they still had many errors that were required intensive manually correction. Consequently, our 3D MRI-based atlas with multi-modal MRI templates provides an important advantage over the histology images in the registration of MRI images.
Figure 7. The MRI-based atlas (with multi-modal MRI templates) outperforms the histology-based atlases (with Nissl-stained images as templates) in the registration of ex-vivo and in-vivo MRI images.
Our MRI-based atlases (MRI), the Riken atlas and the digital Paxinos atlas were spatially transformed to an ex-vivo MTR image (A), an ex-vivo FA image (B), an ex-vivo T2w image (C), an in-vivo T1w image (D), an in-vivo T2w image (E), and an echo planar imaging data (F) from marmosets that were not involved in the atlas construction.
3.3 Resting state fMRI and stimulus-based fMRI
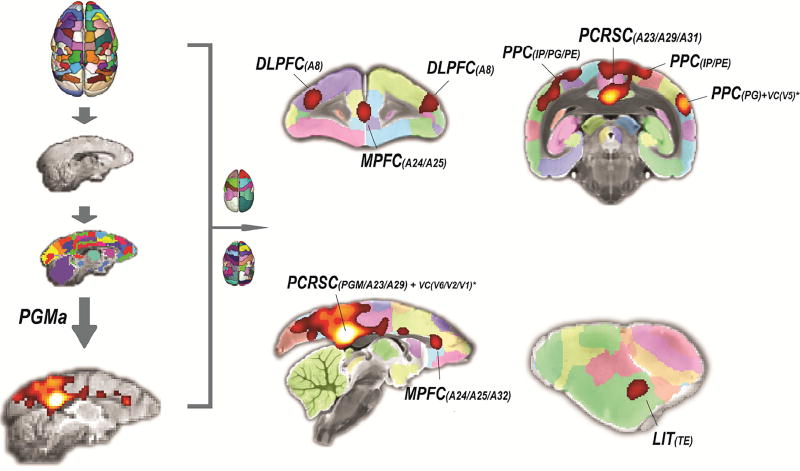
The atlas set is useful for any region-of-interest (ROI) based studies. Here we performed a conventional seed-based correlation analysis on the area PGMa from the atlas (Figure 8), and could readily locate regions that mostly correlated with the PGMa, including the posterior cingulate and retrosplenial cortices (PCRSC), posterior parietal cortex (PPC), and inferior temporal cortex (TE) and dorsolateral prefrontal cortex (DLPFC) and medial prefrontal cortex (MPFC).
Figure 8. Application of the atlas to resting-state fMRI.
The connectivity-based atlas was spatially transformed to the mean EPI image of resting-state fMRI data collected from an awake marmoset. The mean time course of the area PGMa was extracted from the preprocessed data, and its temporal correlations with the whole brain voxels were calculated. The final correlation map consisted of the top 5% of voxels that are mostly correlated with the PGMa. The correlation map was directly transformed to our template (T2w), and the most correlated regions can be easily labeled using our atlas. MPFC: medial prefrontal cortex, PCRSC: posterior cingulate and retrosplenial cortices, PPC: posterior parietal cortex, LIT: lateral and inferior temporal cortical region, DLPFC: dorsolateral prefrontal cortex, TE: inferior temporal cortex, IP: intraparietal area, VC: visual cortex.
The atlas set is also capable of locating regions of any activation maps from stimulus-based fMRI (Figure 9). For somatosensory stimuli, where the data were collected with full brain coverage, we directly registered the activity map to our MRI templates and accurately located the activated regions, including the primary motor cortex (A4), primary somatosensory cortex (S1) and secondary somatosensory cortex (S2). For auditory stimuli, only a few slices were collected parallel to the lateral sulcus with partial coverage. It was difficult to register it to 2D histology-based template and many existing tools may fail to find the correct orientation. Instead, we could easily rotate the 3D atlas to a similar orientation and then perform the registration. In addition, with multi-modal templates, we could select a template modality that was matched with the experimental data to ensure an accurate registration. For example, we used the T2w image of the atlas for the somatosensory stimuli (with a T2w anatomical image) and the MTR image for the auditory stimuli (with a T1w image).
Figure 9. Application of the atlas on stimulus-based fMRI.
(A) A somatosensory task with the electrical stimuli delivered to both hands of an awake marmoset. The activated areas can be readily located after being spatially transformed to our atlas template (T2w), including the primary somatosensory cortex (S1), secondary somatosensory cortex (S2), and primary motor cortex (A4). (B) An auditory task with sound stimuli delivered via MRI-compatible headphones designed for the marmoset. Because the data was oriented parallel to the lateral sulcus with partial coverage, we rotated the atlas to a similar orientation and then performed the registration. Au: auditory cortex; Core: auditory core region; Belt: auditory belt region.
4. Discussion
4.1 Multi-modal and multi-level 3D MRI atlas
In this study, we constructed a new digital 3D atlas set that was designed and optimized for MRI-based neuroimaging and connectome studies of the marmoset. Compared with the traditional histology-based atlases of the marmoset brain, our atlas has three main advantages: 1) Brain regions are directly delineated or mapped onto 3D MRI images to avoid the inaccuracy from histology-to-MRI registration; 2) high-resolution multi-modal MRI templates are provided for accurate registration to different MRI modalities; 3) the multi-level parcellation schemes allow locating brain regions with a hierarchical labelling and provides choices for ROI-based analyses and connectome studies.
The three versions were constructed with a hierarchical relationship. When using the atlas set to locate regions from an activation or correlation map, the anatomical labels of all three versions are reported at once, for example using the fully-featured atlas functions (“AFNI whereami”) powered by the AFNI (Supplementary Figure S2). When conducting ROI-based analyses or connectome studies, however, a researcher may need choose one of the three versions. The choice may depend on the data resolution and the experimental purpose. The MRI-based atlas is the core version, having enough number of regions for most applications, including whole-brain connectome analyses. Additionally, the MRI-based atlas has a high accuracy of registration, as most tools also use the MRI contrasts for image registration. The location-based atlas (the coarse version) may be suitable for comparative studies across species because one can easily find the homologous regions in other mammal species. The location-based atlas is also recommended for connectome analyses on low-resolution data, because a low resolution (> 0.5 mm isotropic) data generates small regions with relatively few voxels (< 27 voxels) in the MRI-based atlas and the connectivity-based atlas (Supplementary Figure S3). The connectivity-based atlas can be used to construct high-resolution whole-brain structural connectomes that require many brain regions (network nodes), as it provides the most fine-grained parcellation among the three versions and has sub-regions defined by their differences in structural connectivity.
4.2 Reproducible contrasts are the cornerstone of atlases and the importance of atlas diversity
Brain atlases have been evolving for more than a century. Almost all brain atlases were delineated or calculated on different contrasts, ranging from traditional cytoarchitecture (local contrasts) to recent connectivity patterns (global contrasts). The key prerequisite for any usable contrast is that it is reproducible across different individuals. Since the pioneering work of the Brodmann atlas (Brodmann, 1909), area delineations were mainly based on histological contrasts, such as cytoarchitecture. Gradually, histology-based atlases have almost been treated as the “gold standard” for brain parcellation. However, besides cytoarchitecture, a brain region can also be defined by other properties, including its connectivity patterns, topographic organization and functional properties (Paxinos, 2016). In addition, existing histological atlases only captured a few aspects of the brain architecture, as not all cell types and structures were utilized to delineate regional boundaries. Thus, there is no definitive “gold standard” for a brain parcellation.
Without a “gold standard”, the only way is to view the brain from different aspects and identify brain regions by multiple criteria. Nowadays, anatomists have begun to build atlases using other contrasts beyond the traditional cytoarchitecture, such as gene expression patterns (Ng et al., 2009). The emergence of functional and diffusion MRI allows mapping of brain functional and structural connectivity directly, which were used to create two new connectivity-based atlases of the human brain (Fan et al., 2016; Glasser et al., 2016a). The diversity of human brain atlases substantially innovates the perception and analysis of brain structure and function.
In this study, we constructed an MRI-based atlas delineated directly on local MRI contrasts. The atlas had high consistency with the histological atlas, indicating the similarity and relationship between the cytoarchitecture and MRI contrasts. For example, the MTR and T2w are affected by the macromolecules in the tissue (Grossman et al., 1994); the FA and RD contrasts are highly related to the myelination or the directionality of fiber bundles (Mädler et al., 2008); and the ODI reflects neurite orientation dispersion and density (Zhang et al., 2012a). Although there is no strict one-to-one relationship with any specific tissue, MRI contrasts reflect the sum effect of all tissues. Furthermore, the reproducible nature of the MRI contrasts also makes them useful and reliable in delineating regional boundaries. Due to its 3D feature and multi-modal contrasts, the MRI-based atlas can be directly used in neuroimaging studies without the inaccuracy from the inter-modal histology-to-MRI registration.
As discussed above, a brain region is defined not only by the local architecture, but also by its global connectivity. One of the most important techniques for examining real anatomical connections is neuronal tracing (Calabrese et al., 2015). However, the neuronal tracing requires a “predefined” brain region and due to its labor-intensive nature, it is almost impracticable for a high-throughput brain parcellation. Thus, historically, few atlases have used connectivity information to parcellate the brain. This situation has changed with the development of MRI and machine learning techniques. A growing number of human studies revolutionarily have used functional or diffusion MRI to conduct the connectivity-based parcellation (Eickhoff et al., 2015). Inspired by the breakthrough in human brain atlases, we constructed a connectivity-based atlas for the marmoset brain. The general method we used was similar to a recent study (Fan et al., 2016), which had proved its reliability and reproducibility in the parcellation of the human brain. We optimized the method for our high-resolution marmoset data and also obtained a connectivity-based atlas with high reproducibility across different animals. As a great contribution to the atlas diversity of the marmoset brain, the connectivity-based atlas is an important complement to the existing schemes based on architectures.
The main drawback of the connectivity-based parcellation is that the “connectivity” patterns mapped by diffusion tractography may not accurately depict real anatomical connections (Thomas et al., 2014). Diffusion tractography is powerful in reconstructing white matter tracts, but may fail at a crossing-fiber area and may generate many false-positive tracts (Johansen-Berg and Behrens, 2009; Thomas et al., 2014). With an almost smooth brain (few gyri and sulci), the marmoset brain has a simpler white matter structure and fewer branching and crossing fibers than the human brain. Our high-resolution multi-shell data and probabilistic tractography also helped the tracking in crossing fibers (Behrens et al., 2007; Behrens et al., 2003). Nevertheless, it is imperative to examine the “real” connections of each region to directly verify the fiber pathways reconstructed by the diffusion tractography (Liu et al., 2016). With a complete neuronal-tracing database of the mouse brain (Kuan et al., 2015; Oh et al., 2014), a previous study revealed a medium correlation (r = 0.42) at finest level of anatomic detail between the diffusion-tractography-based connectivity and neuronal-tracing-based connectivity (Calabrese et al., 2015). Significant correlation (r = 0.59) in connection weights was also observed in macaques between two tract-tracing approaches (Donahue et al., 2016). A neural-tracing database, the Marmoset Brain Architecture Project, has been launched recently (http://marmoset.braincircuits.org/). Although still in its early stage, the project will play an irreplaceable role in examining the anatomical connections of the marmoset brain.
4.3 Limitations and future directions
The multi-modal MRI templates of the atlas were collected from a single marmoset, and thus cannot represent the entire marmoset population. While ideally the templates should have been generated from several individuals of both genders and varying ages, averaged into a “population” template, it is very difficult to obtain enough number of adult brain samples for ex-vivo imaging, due to the need to sacrifice valuable animals to make the “population”. Population-based in-vivo templates are useful for tissue segmentation and voxel-wise statistics (Hikishima et al., 2011), but they do not have enough spatial resolution and contrast to depict the detailed neuroanatomy of the marmoset as our ex-vivo data does. We picked one marmoset (male, 4.5-year-old) as the template subject because this age and gender are most commonly used in MRI studies. A 4.5-year-old marmoset is fully matured but not too old. And we picked a male subject mainly because males are more commonly used in experiments, as females are favored by most labs to be used as breeders. Nevertheless, we took various steps to validate our template obtained from a single subject. Mainly, we created a validation dataset by selecting 4 other marmosets of both genders and different ages. The registration of the single-subject template to each and every single one of the other subjects in the validation dataset was accurate (Figure 7) and the structural connectomes comparing a single individual to the population were consistent (r > 0.9, Figure 6), despite the differences in age, gender and even pulse-sequences (the atlas data: multi-shell DWI v.s the validation data: single-shell DWI). These results also suggest that the anatomical variability across individuals can be resolved by nonlinear registration algorithms. This is not surprising, as nonlinear registration algorithms have proved its performance in human data that have even more anatomical variability than marmosets.
Generally, conducting neuroimaging studies on animals, including marmosets, is not as convenient as human studies. Besides the unusual challenges in the image acquisition of small animals, many basic tools for animal studies are lacking. In terms of brain atlases, human neuroimaging studies have benefited greatly from the richness of their atlases’ diversity, from traditional histology-based atlases (Brodmann, 1909) to recent connectivity-based atlases (Fan et al., 2016; Glasser et al., 2016a). In addition, these atlases often come with sophisticated tools and analysis pipelines that provide many useful features to facilitate human neuroimaging studies. On the contrary, few atlases and tools have been designed for the neuroimaging studies of the marmoset, impeding its comparative and translational utility. Motivated by these demands, we created the atlas that has a general utility in applications involving structural, functional, or connectome imaging of the marmoset. However, compared with the versatile tools in human studies, this atlas cannot provide all the features we would like to see available for the marmoset researcher. The atlas itself also has much room for improvement with better data and better methods. Using the current ex-vivo atlas set as a cornerstone, we aim to build atlases and utilities designed for the neuroimaging studies of the marmoset in the future.
Supplementary Material
Acknowledgments
We thank Xianfeng (Lisa) Zhang, and Dr. Sang-Ho Choi for their support in animal and brain sample preparation. Also, many thanks go to the Scientific and Statistical Computing Core of the NIMH Intramural Research Program for their support in the AFNI and SUMA, the High-Performance Computing staffs for their support in NIH-HPC computing clusters, and the NIH Fellows Editorial Board for the scientific document-editing service. This research was supported by the Intramural Research Program of the NIH, NINDS (Alan P. Koretsky, Scientific Director).
Footnotes
Publisher's Disclaimer: This is a PDF file of an unedited manuscript that has been accepted for publication. As a service to our customers we are providing this early version of the manuscript. The manuscript will undergo copyediting, typesetting, and review of the resulting proof before it is published in its final citable form. Please note that during the production process errors may be discovered which could affect the content, and all legal disclaimers that apply to the journal pertain.
References
- Avants BB, Tustison NJ, Song G, Cook PA, Klein A, Gee JC. A reproducible evaluation of ANTs similarity metric performance in brain image registration. Neuroimage. 2011;54:2033–2044. doi: 10.1016/j.neuroimage.2010.09.025. [DOI] [PMC free article] [PubMed] [Google Scholar]
- Behrens TE, Berg HJ, Jbabdi S, Rushworth MF, Woolrich MW. Probabilistic diffusion tractography with multiple fibre orientations: What can we gain? Neuroimage. 2007;34:144–155. doi: 10.1016/j.neuroimage.2006.09.018. [DOI] [PMC free article] [PubMed] [Google Scholar]
- Behrens TE, Woolrich MW, Jenkinson M, Johansen-Berg H, Nunes RG, Clare S, Matthews PM, Brady JM, Smith SM. Characterization and propagation of uncertainty in diffusion-weighted MR imaging. Magn Reson Med. 2003;50:1077–1088. doi: 10.1002/mrm.10609. [DOI] [PubMed] [Google Scholar]
- Belcher AM, Yen CC, Stepp H, Gu H, Lu H, Yang Y, Silva AC, Stein EA. Large-scale brain networks in the awake, truly resting marmoset monkey. J Neurosci. 2013;33:16796–16804. doi: 10.1523/JNEUROSCI.3146-13.2013. [DOI] [PMC free article] [PubMed] [Google Scholar]
- Brodmann K. Vergleichende Lokalisationslehre der Grosshirnrinde in ihren Prinzipien dargestellt auf Grund des Zellenbaues. Barth 1909 [Google Scholar]
- Calabrese E, Badea A, Cofer G, Qi Y, Johnson GA. A Diffusion MRI Tractography Connectome of the Mouse Brain and Comparison with Neuronal Tracer Data. Cereb Cortex. 2015;25:4628–4637. doi: 10.1093/cercor/bhv121. [DOI] [PMC free article] [PubMed] [Google Scholar]
- Charrad M, Ghazzali N, Boiteau V, Niknafs A, Charrad MM. Package ‘NbClust’. J. Stat. Soft. 2014;61:1–36. [Google Scholar]
- Cheng J, Shen D, Yap P-T, Basser PJ. Novel single and multiple shell uniform sampling schemes for diffusion MRI using spherical codes. International Conference on Medical Image Computing and Computer-Assisted Intervention. 2015:28–36. doi: 10.1007/978-3-319-24553-9_4. [DOI] [PMC free article] [PubMed] [Google Scholar]
- Donahue CJ, Sotiropoulos SN, Jbabdi S, Hernandez-Fernandez M, Behrens TE, Dyrby TB, Coalson T, Kennedy H, Knoblauch K, Van Essen DC. Using diffusion tractography to predict cortical connection strength and distance: a quantitative comparison with tracers in the monkey. Journal of Neuroscience. 2016;36:6758–6770. doi: 10.1523/JNEUROSCI.0493-16.2016. [DOI] [PMC free article] [PubMed] [Google Scholar]
- Eickhoff SB, Stephan KE, Mohlberg H, Grefkes C, Fink GR, Amunts K, Zilles K. A new SPM toolbox for combining probabilistic cytoarchitectonic maps and functional imaging data. Neuroimage. 2005;25:1325–1335. doi: 10.1016/j.neuroimage.2004.12.034. [DOI] [PubMed] [Google Scholar]
- Eickhoff SB, Thirion B, Varoquaux G, Bzdok D. Connectivity-based parcellation: Critique and implications. Hum Brain Mapp. 2015;36:4771–4792. doi: 10.1002/hbm.22933. [DOI] [PMC free article] [PubMed] [Google Scholar]
- Fan L, Li H, Zhuo J, Zhang Y, Wang J, Chen L, Yang Z, Chu C, Xie S, Laird AR, Fox PT, Eickhoff SB, Yu C, Jiang T. The Human Brainnetome Atlas: A New Brain Atlas Based on Connectional Architecture. Cereb Cortex. 2016;26:3508–3526. doi: 10.1093/cercor/bhw157. [DOI] [PMC free article] [PubMed] [Google Scholar]
- Glasser MF, Coalson TS, Robinson EC, Hacker CD, Harwell J, Yacoub E, Ugurbil K, Andersson J, Beckmann CF, Jenkinson M. A multi-modal parcellation of human cerebral cortex. Nature. 2016a;536:171–178. doi: 10.1038/nature18933. [DOI] [PMC free article] [PubMed] [Google Scholar]
- Glasser MF, Smith SM, Marcus DS, Andersson JL, Auerbach EJ, Behrens TE, Coalson TS, Harms MP, Jenkinson M, Moeller S, Robinson EC, Sotiropoulos SN, Xu J, Yacoub E, Ugurbil K, Van Essen DC. The Human Connectome Project’s neuroimaging approach. Nat Neurosci. 2016b;19:1175–1187. doi: 10.1038/nn.4361. [DOI] [PMC free article] [PubMed] [Google Scholar]
- Grossman RI, Gomori JM, Ramer KN, Lexa FJ, Schnall MD. Magnetization transfer: theory and clinical applications in neuroradiology. Radiographics. 1994;14:279–290. doi: 10.1148/radiographics.14.2.8190954. [DOI] [PubMed] [Google Scholar]
- Guy JR, Sati P, Leibovitch E, Jacobson S, Silva AC, Reich DS. Custom fit 3D–printed brain holders for comparison of histology with MRI in marmosets. J Neurosci Methods. 2016;257:55–63. doi: 10.1016/j.jneumeth.2015.09.002. [DOI] [PMC free article] [PubMed] [Google Scholar]
- Hashikawa T, Nakatomi R, Iriki A. Current models of the marmoset brain. Neurosci Res. 2015;93:116–127. doi: 10.1016/j.neures.2015.01.009. [DOI] [PubMed] [Google Scholar]
- Hikishima K, Quallo MM, Komaki Y, Yamada M, Kawai K, Momoshima S, Okano HJ, Sasaki E, Tamaoki N, Lemon RN, Iriki A, Okano H. Population-averaged standard template brain atlas for the common marmoset (Callithrix jacchus) Neuroimage. 2011;54:2741–2749. doi: 10.1016/j.neuroimage.2010.10.061. [DOI] [PubMed] [Google Scholar]
- Homman-Ludiye J, Bourne JA. The marmoset: An emerging model to unravel the evolution and development of the primate neocortex. Dev Neurobiol. 2017;77:263–272. doi: 10.1002/dneu.22425. [DOI] [PubMed] [Google Scholar]
- Jiang T. Brainnetome: a new -ome to understand the brain and its disorders. Neuroimage. 2013;80:263–272. doi: 10.1016/j.neuroimage.2013.04.002. [DOI] [PubMed] [Google Scholar]
- Johansen-Berg H, Behrens TE. From quantitative measurement to in-vivo neuroanatomy. Academic Press; 2009. [Google Scholar]
- Kishi N, Sato K, Sasaki E, Okano H. Common marmoset as a new model animal for neuroscience research and genome editing technology. Development, growth & differentiation. 2014;56:53–62. doi: 10.1111/dgd.12109. [DOI] [PubMed] [Google Scholar]
- Kuan L, Li Y, Lau C, Feng D, Bernard A, Sunkin SM, Zeng H, Dang C, Hawrylycz M, Ng L. Neuroinformatics of the Allen Mouse Brain Connectivity Atlas. Methods. 2015;73:4–17. doi: 10.1016/j.ymeth.2014.12.013. [DOI] [PubMed] [Google Scholar]
- Li H, Fan L, Zhuo J, Wang J, Zhang Y, Yang Z, Jiang T. ATPP: A Pipeline for Automatic Tractography-Based Brain Parcellation. Front Neuroinform. 2017;11 doi: 10.3389/fninf.2017.00035. [DOI] [PMC free article] [PubMed] [Google Scholar]
- Liu C, Li Y, Edwards TJ, Kurniawan ND, Richards LJ, Jiang T. Altered structural connectome in adolescent socially isolated mice. Neuroimage. 2016;139:259–270. doi: 10.1016/j.neuroimage.2016.06.037. [DOI] [PubMed] [Google Scholar]
- Liu C, Tian X, Liu H, Mo Y, Bai F, Zhao X, Ma Y, Wang J. Rhesus monkey brain development during late infancy and the effect of phencyclidine: a longitudinal MRI and DTI study. Neuroimage. 2015;107:65–75. doi: 10.1016/j.neuroimage.2014.11.056. [DOI] [PubMed] [Google Scholar]
- Mädler B, Drabycz SA, Kolind SH, Whittall KP, MacKay AL. Is diffusion anisotropy an accurate monitor of myelination?: Correlation of multicomponent T2 relaxation and diffusion tensor anisotropy in human brain. Magn Reson Imaging. 2008;26:874–888. doi: 10.1016/j.mri.2008.01.047. [DOI] [PubMed] [Google Scholar]
- Majka P, Chaplin TA, Yu HH, Tolpygo A, Mitra PP, Wójcik DK, Rosa MG. Towards a comprehensive atlas of cortical connections in a primate brain: Mapping tracer injection studies of the common marmoset into a reference digital template. Journal of Comparative Neurology. 2016;524:2161–2181. doi: 10.1002/cne.24023. [DOI] [PMC free article] [PubMed] [Google Scholar]
- Mitchell JF, Leopold DA. The marmoset monkey as a model for visual neuroscience. Neurosci Res. 2015;93:20–46. doi: 10.1016/j.neures.2015.01.008. [DOI] [PMC free article] [PubMed] [Google Scholar]
- Newman JD, Kenkel WM, Aronoff EC, Bock NA, Zametkin MR, Silva AC. A combined histological and MRI brain atlas of the common marmoset monkey, Callithrix jacchus. Brain Res Rev. 2009;62:1–18. doi: 10.1016/j.brainresrev.2009.09.001. [DOI] [PMC free article] [PubMed] [Google Scholar]
- Ng AY, Jordan MI, Weiss Y. On spectral clustering: Analysis and an algorithm. Advances in neural information processing systems. 2002:849–856. [Google Scholar]
- Ng L, Bernard A, Lau C, Overly CC, Dong HW, Kuan C, Pathak S, Sunkin SM, Dang C, Bohland JW, Bokil H, Mitra PP, Puelles L, Hohmann J, Anderson DJ, Lein ES, Jones AR, Hawrylycz M. An anatomic gene expression atlas of the adult mouse brain. Nat Neurosci. 2009;12:356–362. doi: 10.1038/nn.2281. [DOI] [PubMed] [Google Scholar]
- Oguz I, McMurray MS, Styner M, Johns JM. The translational role of diffusion tensor image analysis in animal models of developmental pathologies. Dev Neurosci. 2012;34:5–19. doi: 10.1159/000336825. [DOI] [PMC free article] [PubMed] [Google Scholar]
- Oh SW, Harris JA, Ng L, Winslow B, Cain N, Mihalas S, Wang Q, Lau C, Kuan L, Henry AM. A mesoscale connectome of the mouse brain. Nature. 2014;508:207. doi: 10.1038/nature13186. [DOI] [PMC free article] [PubMed] [Google Scholar]
- Palazzi X, Bordier N. The marmoset brain in stereotaxic coordinates. Springer; 2008. [Google Scholar]
- Paxinos G. Human brainnetome atlas: a new chapter of brain cartography. Sci China Life Sci. 2016;59:965–967. doi: 10.1007/s11427-016-5110-x. [DOI] [PubMed] [Google Scholar]
- Paxinos G, Watson C, Petrides M, Rosa M, Tokuno H. The marmoset brain in stereotaxic coordinates. Elsevier; AP: 2012. [Google Scholar]
- Reveley C, Gruslys A, Ye FQ, Glen D, Samaha J, B ER, Saad Z, A KS, Leopold DA, Saleem KS. Three-Dimensional Digital Template Atlas of the Macaque Brain. Cereb Cortex. 2016 doi: 10.1093/cercor/bhw248. [DOI] [PMC free article] [PubMed] [Google Scholar]
- Silva AC. Anatomical and functional neuroimaging in awake, behaving marmosets. Dev Neurobiol. 2017;77:373–389. doi: 10.1002/dneu.22456. [DOI] [PMC free article] [PubMed] [Google Scholar]
- Silva AC, Liu JV, Hirano Y, Leoni RF, Merkle H, Mackel JB, Zhang XF, Nascimento GC, Stefanovic B. Longitudinal functional magnetic resonance imaging in animal models. Methods Mol Biol. 2011;711:281–302. doi: 10.1007/978-1-61737-992-5_14. [DOI] [PMC free article] [PubMed] [Google Scholar]
- Tabesh A, Jensen JH, Ardekani BA, Helpern JA. Estimation of tensors and tensor-derived measures in diffusional kurtosis imaging. Magn Reson Med. 2011;65:823–836. doi: 10.1002/mrm.22655. [DOI] [PMC free article] [PubMed] [Google Scholar]
- Thomas C, Frank QY, Irfanoglu MO, Modi P, Saleem KS, Leopold DA, Pierpaoli C. Anatomical accuracy of brain connections derived from diffusion MRI tractography is inherently limited. Proceedings of the National Academy of Sciences. 2014;111:16574–16579. doi: 10.1073/pnas.1405672111. [DOI] [PMC free article] [PubMed] [Google Scholar]
- Tokuno H, Tanaka I, Umitsu Y, Akazawa T, Nakamura Y. Web-accessible digital brain atlas of the common marmoset (Callithrix jacchus) Neurosci Res. 2009;64:128–131. doi: 10.1016/j.neures.2009.02.003. [DOI] [PubMed] [Google Scholar]
- Tournier J-D, Calamante F, Gadian DG, Connelly A. Direct estimation of the fiber orientation density function from diffusion-weighted MRI data using spherical deconvolution. NeuroImage. 2004;23:1176–1185. doi: 10.1016/j.neuroimage.2004.07.037. [DOI] [PubMed] [Google Scholar]
- Van Essen DC, Smith SM, Barch DM, Behrens TE, Yacoub E, Ugurbil K, Consortium WU-MH. The WU-Minn Human Connectome Project: an overview. Neuroimage. 2013;80:62–79. doi: 10.1016/j.neuroimage.2013.05.041. [DOI] [PMC free article] [PubMed] [Google Scholar]
- Yuasa S, Kohsaka S, Nakamura K. Stereotaxic atlas of the marmoset brain: with immunohistochemical architecture and MR images. National Institute of Neuroscience, National Center of Neurology and Psychiatry; Japan: 2010. [Google Scholar]
- Zhang H, Schneider T, Wheeler-Kingshott CA, Alexander DC. NODDI: practical in vivo neurite orientation dispersion and density imaging of the human brain. Neuroimage. 2012a;61:1000–1016. doi: 10.1016/j.neuroimage.2012.03.072. [DOI] [PubMed] [Google Scholar]
- Zhang J, Aggarwal M, Mori S. Structural insights into the rodent CNS via diffusion tensor imaging. Trends in neurosciences. 2012b;35:412–421. doi: 10.1016/j.tins.2012.04.010. [DOI] [PMC free article] [PubMed] [Google Scholar]
Associated Data
This section collects any data citations, data availability statements, or supplementary materials included in this article.


