

Summary
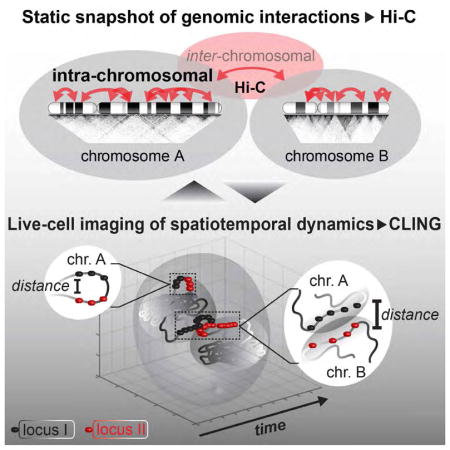
Imaging (FISH) and Hi-C are two major approaches to study higher-order genome organization in the nucleus. Intra-chromosomal and inter-chromosomal interactions (referred to as non-homologous chromosomal contacts, NHCCs) have been observed by several FISH-based studies, but locus-specific NHCCs have not been detected by Hi-C. Due to cross-linking, neither of these approaches assesses spatiotemporal properties. Towards resolving the discrepancies between imaging and HiC, we sought to understand the spatiotemporal properties of NHCCs in living cells by CRISPR/Cas9 live-cell imaging (CLING). In mammalian cells, we find that NHCCs are stable and occur as frequently as intra-chromosomal interactions, but NHCCs occur at further spatial distance that could explain their lack of detection in Hi-C. By revealing the spatiotemporal properties in living cells, our study provides fundamental insights into the biology of NHCCs.
Keywords: Inter-chromosomal interactions, NHCCs, CRISPR live-cell imaging, CLING, Hi-C, loci dynamics, CISTR-ACT, FIRRE, lncRNA
eTOC blurb
Comparing time-lapse live-cell imaging, Maass et al. characterize the spatiotemporal properties of genomic contacts between non-homologous chromosomes. They determined that these contacts occur frequently in mammalian cells, remain stably associated over time, and occur at spatial distances that are not readily captured in genome-wide chromosome conformation capturing (Hi-C).
Introduction
Chromosome organization results in distinct gene-expression programs and cell state determination (Dekker, 2014; Dixon et al., 2015; Gorkin et al., 2014). Microscopy, chromosome conformation capturing (3C), and especially its genome-wide derivative HiC, have broadened our understanding of nuclear architecture and how chromosome organization results in coordinated gene regulation (Cremer and Cremer, 2010; Dekker, 2016; Dekker et al., 2002; Lieberman-Aiden et al., 2009; Satzinger, 2008).
Despite advances in understanding the dynamics and regulation of intra-chromosomal interactions, the biology of inter-chromosomal interactions (now referred to as non-homologous chromosomal contacts, or NHCCs) remains elusive in mammals (Cremer and Cremer, 2010). A well-established example of NHCCs are chromosomal domains associating to form the nucleolus (McStay, 2016). Contacts between non-repetitive ribosomal-DNA-flanking regions can be visualized by FISH, but are not readily observed in Hi-C datasets. Microscopy studies have revealed that chromosomal territories are closely associated (Branco and Pombo, 2006; Cavalli, 2007), and chromatin strands from different chromosomes can pass through one another (Blackstone et al., 2011). Apart from large-scale NHCCs, locus-specific NHCCs have been reported to modify gene expression (Hacisuleyman et al., 2014; Joyce et al., 2016; Ling et al., 2006; Lomvardas et al., 2006; Maass et al., 2012; Spilianakis et al., 2005). For example, the long non-coding RNA (lncRNA) loci Firre and CISTR-ACT co-localize with loci on non-homologous chromosomes and influence gene regulation (Hacisuleyman et al., 2014; Maass et al., 2012).
Two major methods elucidate chromosomal interactions: imaging and 3C-based molecular approaches. Imaging techniques, in particular fluorescence in situ hybridization (FISH) (Langer-Safer et al., 1982), and CRISPR-related techniques (Chen et al., 2013; Deng et al., 2015; Fu et al., 2016; Ma et al., 2016; Qin et al., 2017; Shao et al., 2016; Wang et al., 2016b; Zhou et al., 2017), are advantageous in assessing spatial dimensions and cell-to-cell-variabilities. In contrast, 3C-based techniques (which we refer to as Hi-C for genome-wide interactions) capture proximally-ligated genomic interactions of cell populations to achieve high-resolution interaction maps (Rao et al., 2014). Although FISH and Hi-C techniques are concomitantly used to complement each other, significant discrepancies have been reported (Bickmore and van Steensel, 2013; Dekker, 2016; Fudenberg and Imakaev, 2017; Williamson et al., 2014). For example, loci with high Hi-C interaction frequencies co-localize only in few cells visualized by FISH (Giorgetti and Heard, 2016; Williamson et al., 2014). While both techniques explore crosslinked cells, FISH detects NHCCs more frequently than Hi-C (Hacisuleyman et al., 2014; Lajoie et al., 2015; Maass et al., 2012; Nagano et al., 2015). The preparation of samples, such as harsh cellular treatments, cell permeabilization, and DNA denaturation may explain some of the reported discordance. Most importantly, cross-linking yields a static snapshot of chromatin biology, both methods miss the spatiotemporal aspects of genomic interactions. Thus, reconciling results from imaging and Hi-C is pivotal to broaden our understanding about the techniques, and to decipher the mechanisms of genome organization (Dekker, 2016; Fudenberg and Imakaev, 2017).
To address this discrepancy between FISH and Hi-C, we used the advantage of our previously introduced CRISPR/Cas9 live-cell imaging method (CLING) (Maass et al., 2018). CLING overcomes the limitation of analyzing crosslinked cells to elucidate the dynamics of chromosomal interactions in living cells. In our previous study, we introduced allele-specific SNP-CLING and leveraged it to explore the properties of parental allelic positioning in living cells (Maass et al., 2018). In contrast, here, we use CLING to characterize the spatiotemporal dynamics of NHCCs in living cells. We also aim to understand how these properties would influence Hi-C data. We find that these NHCCs occur in a majority of cells, are conserved in mammalian cell lines, are stable over time, and are less mobile than control loci. Despite these frequent and stable NHCC dynamics, they are not as readily detected as intra-chromosomal interactions in the analyzed Hi-C datasets. Intra-chromosomal interactions occur at the same or even lower frequency, as NHCCs in living cells. To better understand this discrepancy, we used 4D-CLING to measure distinct biophysical features of NHCCs in living cells. We find that increased distance between NHCCs compared to intra-chromosomal interactions, rather than differences in fluctuation dynamics, might explain the discrepancies in Hi-C data. This study reveals fundamental properties of NHCCs in living cells, some of which may explain the discordance between FISH and Hi-C datasets.
Results & Discussion
Intra-chromosomal interactions are detected both by CLING and Hi-C
To label DNA loci in living cells, we targeted three single-guide RNAs (sgRNAs), each harboring three internal MS2 or PP7 motifs, to each locus of interest with non-catalytic Cas9 (dCas9). Two orthologous sgRNA pools and the co-transfection of RNA-aptamer-binding moieties fused to fluorescent proteins (MS2-mVenus and PP7-mCherry), allowed the spatiotemporal locus tracking in live cells (Chao et al., 2008; Maass et al., 2018; Shechner et al., 2015). Spatial distances were measured from voxels’ centers (see methods, Figure 1A, S1A–B, n ≥ 100 nuclei and 4 replicates).
Figure 1. NHCC frequencies in CLING and in Hi-C.

(A) Intra-chromosomal interactions of FIRRE with DXZ4, or with a control locus at 101 Mb (*** p < 0.0001, Mann-Whitney rank-sum test). CLING-determined co-localization frequencies (each quantification in 100 RPE-1 nuclei), in comparison to Hi-C signals (resolution/bin size = 40 kb), or Hi-C normalized read numbers in RPE-1 cells. (B) NHCCs of FIRRE-ATF4 (58 %), and FIRRE-PGR (25 %) in CLING (each quantification in 100 RPE-1 nuclei) in comparison to Hi-C contact probabilities (resolution/bin size = 250 kb), or normalized read counts.
To compare intra-chromosomal interactions and NHCCs in living cells and in HiC, we first started with well-established intra-chromosomal interactions on chromosome X. The FIRRE locus strongly interacts with both the macrosatellite repeat DXZ4, and the inactive-X CTCF-binding contact element (ICCE), as detected by multiple Hi-C studies (Darrow et al., 2016; Giorgetti et al., 2014; Yang et al., 2015).
Using CLING, the imaged foci were considered as co-localized, if the distance between the borders of two given foci was below < 50 nm (1 voxel = 50 nm, see methods). We detected FIRRE-DXZ4 co-localizations in 40 %, and FIRRE-ICCE in 46 % of RPE-1 nuclei (Figures 1A, S1C). As negative control, we selected a locus at 101 Mb, in the opposite direction of DXZ4, but at a distance similar to FIRRE-DXZ4 (115 Mb, Figure 1A). In CLING, FIRRE co-localized with the control in 22 % of living RPE-1 cells (Figure 1A). Analyzing the same intra-chromosomal contacts by Hi-C in RPE-1 cells (Darrow et al., 2016), we expectedly determined a robust Hi-C signal for FIRRE-DXZ4, but not for FIRRE-101 Mb control (Figure 1A, *** p < 0.0001). Collectively, CLING validates known intra-chromosomal interactions in living cells that are also detected in Hi-C.
By CLING, NHCCs occur in > 50 % of human and mouse cells, but are not detectable in Hi-C
Using CLING as described above, we identified NHCC co-localizations in > 50 % of the nuclei examined in living RPE-1 cells (53 % FIRRE-YPEL4, 58 % FIRRE-ATF4, 61 % CISTR-ACT-SOX9, Figures 1B, S1C, see methods). As controls, we monitored FIRRE-PGR (25 %), GAPDH-PGR (30 %), and CISTR-ACT-GAPDH (24 %), which have not been detected by Hi-C and which occurred far less frequently relative to FIRRE-YPEL4, FIRRE-ATF4, and CISTR-ACT-SOX9 by CLING (Figures 1B, S1C, *** p < 0.0001). Notably, mono-allelic co-localizations of the gene-pairs examined occurred two times more frequently than bi-allelic co-localizations (Figure S1D). We next compared our CLING frequencies of those previously observed by RNA-FISH. We found similar frequencies between RNA FISH and CLING. Specifically, Firre-Ypel4 co-localized in 72 % (58% CLING) mESCs and CISTR-ACT-SOX9 in 72 % (61% CLING) C28/I2 cells (Hacisuleyman et al., 2014; Maass et al., 2012).
Previously, we described an allele-biased Firre-Ypel4 NHCC in mouse embryonic fibroblasts by allele-specific CRISPR live-cell, yet static, imaging (SNP-CLING) (Maass et al., 2018). To assess these findings in mouse pluripotent cells, we explored Firre–Ypel4 and Firre-Atf4 NHCCs and their frequencies in living mouse embryonic stem cells (mESCs). In mESCs, Firre co-localized more frequently with Ypel4 (68 %), and Atf4 (57 %) of the examined cells, than with Actin (29 %, ** p = 0.002). Despite similar interaction rates in mouse cells, these mouse NHCCs were undetectable in mESC Hi-C data (Figure S2).
Taken together, these results show the feasibility of CLING to detect and to characterize FIRRE and CISTR-ACT NHCCs, that were previously identified to highly similar frequencies by FISH (Hacisuleyman et al., 2014; Maass et al., 2012). We demonstrate that the majority of NHCCs are mono-allelic and they represent a prevalent and conserved feature in living human and mouse cells. In contrast, Hi-C is not able to detect these NHCCs, despite detecting intra-chromosomal interactions occurring at similar frequencies as NHCCs. Together, these findings corroborate the discrepancy between imaging and Hi-C approaches in identifying NHCCs and they prove the advantage of live-cell imaging.
NHCC associations are stable and immobile in time
One possibility for detecting NHCCs in CLING, but not in Hi-C, could be that NHCCs fluctuate in space and across time and therefore, they are averaged out by Hi-C. Previously, we showed that single (non-interacting) alleles are stably positioned in living cells (Maass et al., 2018). However, the spatiotemporal dynamics of interacting NHCCs has yet to be characterized. Therefore, we used the advantage of the CLING technique to define the biophysical properties of NHCCs by measuring their spatial distances, their fluctuations, such as direction and speed, and their stability over time (4D). To this end, we acquired time-lapse data and converted the signals into time-stamped, three-dimensional coordinates (Figure 2A, see methods). We tracked FIRRE-YPEL4, FIRRE-ATF4, and CISTR-ACT-SOX9 over time (average time interval between z-stacks: 2:13 min, up to 1 h per cell, Figure S3A–B, Movies S1–2, Table S2). GAPDH-PGR were monitored as controls under the same conditions.
Figure 2. NHCC dynamics.

(A) Distances (D, d) between co-localized signals were measured and compared to non-co-localized signals over time (t) in 4D-CLING. (B) The ratios of distances (Dn or dn/D1, see panel A), determined that co-localized signals were closer to each other than GAPDH and PGR, and they remained associated over time (*** p < 0.0001, Mann-Whitney rank-sum test, means±SEM). (C) Speed measurements (m/s)−6 separated in minimum and maximum of time-matched 4D-data. At low speeds, all loci were less mobile than the control loci GAPDH and PGR (*** p < 0.0001, Mann-Whitney rank sum test). (D) Spatial distances between co-localized and non-co-localized signals (*** p < 0.0001, Mann-Whitney rank sum test). (E) Distances between co-localized loci of intra- or inter-chromosomal interactions in RPE-1 nuclei (*** p < 0.0001, Mann-Whitney rank sum test, without outlier). (F) Distributions of co-localization distances of intra- or inter-chromosomal interactions were mostly unimodal, whilst was FIRRE-YPEL4 distances were bimodal (Hartigan’s dip test, ** p < 0.001, black dots = medians). (G) Spearman correlations between intra- (bin size = 100 kb) or inter-chromosomal (bin size = 500 kb) CLING spatial distances, CLING co-localization frequencies (size of data points indicates co-localization frequencies in %), and Hi-C interaction probabilities (z-scores) in RPE-1 Hi-C. Smaller spatial distances correlate with higher Hi-C z-scores. (H) Discrepancies between imaging and Hi-C methodologies. (I) Schemes of spatial organization of two given loci in intra-chromosomal interactions and NHCCs (d = distance)
First, we examined if co-localized NHCCs are stable over time by measuring ratios of distances between co-localized and non-co-localized loci at each acquired time-point. We compared co-localizations of FIRRE-YPEL4, FIRRE-ATF4, and CISTR-ACT-SOX9 to non-co-localized GAPDH or PGR. Interestingly, in the majority of nuclei (93 %), co-localized loci remained tightly associated through time, and exhibited ~10-fold closer distances to one another than non-co-localized loci (*** p < 0.0001, Figure 2B). However, only 7 % of the nuclei exhibited fluctuating NHCCs, where co-localized loci dissociated and became non-co-localized, or vice versa (Figure S3C–D, Movie S3). Spatiotemporal distances of FIRRE-YPEL4, and FIRRE-ATF4 showed less variations than those of CISTR-ACT-SOX9 or of GAPDH and PGR (Figure 2B). These findings suggest that certain loci are more stable than others.
By further analyzing the 4D-experiments, we noticed that co-localized NHCCs have different migration behaviors than non-co-localized loci (Figure S4A). On average, FIRRE-YPEL4, FIRRE-ATF4, and CISTR-ACT-SOX9 moved significantly less (~2.2 μm), and slower (~1.05 μm/min slower), than the GAPDH and PGR controls during time-matched 4D-imaging (Figures 2C, S4B, *** p < 0.0001). Concomitant with the shorter distances and slower pace of FIRRE and CISTR-ACT, the paths taken by the NHCCs indicated less tortuosity (three-dimensional directional changes, see methods, Figure S4C).
Collectively, FIRRE and CISTR-ACT NHCCs are stable over time, move slower across less spatial distances, and meander less. Since we found that NHCCs are mostly stable over time, Hi-C should also consistently detect NHCCs. However, the fact that NHCCs are untraceable by Hi-C, may point to biophysical properties that are different to intra-chromosomal interactions and that may cause the lack of detection by Hi-C.
Spatiotemporal distances influence Hi-C signals
Having ruled out the dynamic fluctuations of NHCCs, we next sought to evaluate spatiotemporal distances between NHCCs to determine if they could explain their absence in Hi-C. By analyzing spatiotemporal 4D-CLING distances, we expectedly found that co-localized NHCCs were consistently closer (average 279±163 nm) to one another than non-co-localized loci (average 8300±4810 nm, Figures 2D, S4D, *** p < 0.0001).
We then measured the spatial distances between intra-chromosomal co-localizations (FIRRE-DXZ4, FIRRE-ICCE, FIRRE-101 Mb, and CISTR-ACT-GAPDH), and compared them to those of NHCCs. We observed an average distance of 189±95 nm for intra-chromosomal co-localizations vs. an average of 279±163 nm for NHCCs (FIRRE-YPEL4, FIRRE-ATF4, and CISTR-ACT-SOX9). Thus, NHCCs occur at significantly larger distances compared to intra-chromosomal interactions (Figures 2E, S4D *** p < 0.0001).
Next, we addressed uniformity and stability of chromosomal contact distances to rule out if a hypothetical non-uniform distribution of spatiotemporal distances between co-localized loci led to larger NHCC distances. Briefly, unimodally distributed distances could account for determined co-localization distances between two given loci, bimodal or multimodal distance distributions could indicate wobbling “on/off” spatiality and cause shifting of the mean spatial distance. In particular, we determined if the higher mean distances of NHCCs were driven by a sub-population of bimodally distributed distances. By analyzing all distributions of intra- and inter-chromosomal co-localization distances, we detected unimodal distributions; only the FIRRE-YPEL4 distribution was bimodal (Figure 2F, ** p < 0.001, S4E). These results indicate that different mean distances between co-localized chromosomal contacts are typically not due to bimodal biases.
Finally, we assessed how these spatial distances between intra-chromosomal or NHCC co-localizations corresponded to the RPE-1 Hi-C interaction frequencies. To this end, we directly compared whether or not mean spatial distances of intra-chromosomal and NHCC CLING co-localizations correlated with Hi-C z-scores, which is a measure of how many standard deviations a particular interaction is above the mean Hi-C interaction frequency, implying that stronger interactions have a higher z-score (see methods). Notably, we detected that the smaller the spatial distance (intra-chromosomal), the higher the Hi-C z-score (negative Pearson correlations, Figure 2G). Importantly, z-scores of NHCCs (−1 to +1) were only a fraction of z-scores describing intra-chromosomal interactions (0 to 20, Figure 2G). Taken together, these findings suggest that spatial distances are different between intra- and inter-chromosomal contacts and that Hi-C more likely captures smaller spatial distances between two given loci.
Discussion
NHCCs are thought to bring regulatory elements into discrete genomic compartments to coordinate spatial dimension of transcription between chromosomes with similar regulatory factors, such as the positional hubs of transcriptional regulation (Beagrie et al., 2017; Edelman and Fraser, 2012; Shopland et al., 2003). The presence of chromosome territories results in extensive Hi-C detection of intra-chromosomal interactions, rather than NHCCs are being detected by Hi-C. In contrast, only in situ imaging validated the established fact that various chromosomal domains come into proximity to form the nucleolus (McStay, 2016). Very few studies detect NHCCs by 3C-based methods, i.e. in cancer or at the Cajal bodies (Barutcu et al., 2015; Wang et al., 2016a). However, previous FISH studies showed that FIRRE and CISTR-ACT interact with regulatory target loci on non-homologous chromosomes (Bergmann et al., 2015; Hacisuleyman et al., 2014; Maass et al., 2012). Yet, these studies were limited to static in situ methods with contrasting results: NHCCs were observed in FISH, but not in Hi-C (Figure 2H). Therefore, these results suggest that proximity ligation and in-situ imaging capture different layers of chromosomal organization (Bickmore and van Steensel, 2013; Dekker, 2014, 2016; Gavrilov et al., 2013; Nagano et al., 2015). Possibly, crosslinking captures only very close genomic contacts (Bickmore and van Steensel, 2013). Since FISH or Hi-C do not assess spatiotemporal features of genomic interactions (Lajoie et al., 2015), as they study static, crosslinked interactions, we addressed the biophysical properties of several intra-chromosomal contacts and NHCCs by 4D-CLING and compared their detection with Hi-C datasets (Figure 2H). This approach gave new insight into spatiotemporal dynamics and biophysical properties, particularly of NHCCs, in living cells.
We observed that in living cells, NHCCs are typically as frequent as intra-chromosomal interactions. We also found that, NHCCs can be detected in a majority of cells, are stable over time, and exhibit three-dimensional conservation in human and mouse. Interactions with all these described features would be expected to be detected in Hi-C, but the studied loci of NHCCs were not. We also notice that the sub-nuclear environment of the NHCCs constricts their properties, either by active movement, or by passive diffusion, and causes an immotile-like behavior as detected by 4D-CLING. Since NHCCs show less mobility in their movement, they could predominantly happen in quiescent chromatin hubs or specific nuclear bodies (Lawrence and Clemson, 2008). Whether the genome composition itself is actively involved, or consequently results in deterministic locus positioning and NHCCs, remains to be determined.
Importantly, our findings propose that close spatial distances influence the detection of Hi-C interaction frequencies. Possibly, NHCCs occur in specialized inter-chromatin hubs that form between chromosomes. In these hubs, spatial distances between chromatin strands can be larger than those of intra-chromosomal chromatin loops. Moreover, chromatin modifiers and transcription factors responsible for the establishment and maintenance of NHCC formation, or being recruited to the inter-chromatin hubs, may result in enlarged NHCC spatiality (Figure 2I). Moreover, whether the high rate of co-localizations detected for FIRRE and CISTR-ACT, and the background co-localization frequencies of control loci, are a general phenomenon for other inter-chromosomal interactions, will be elucidated by more focused research to understand the formation and biological impact of NHCCs.
In this study, we used 4D-CLING to provide unique insights into the dynamics and the biophysical properties of genomic contacts, especially of loci that interact between non-homologous chromosomes. The biophysical measurements by 4D-CLING have revealed that NHCCs occur at larger distances than intra-chromosomal interactions, a feature that may prevent the detection of NHCCs by Hi-C. Further mechanistic studies will be critical to reconcile the spatiotemporal properties of genomic loci. Overall, we find that adding the spatiotemporal dimension of live cell imaging resolves apparent detection differences of static in situ methods.
STAR Methods
CONTACT FOR REAGENT AND RESOURCE SHARING
Further information and requests for resources and reagents should be directed to and will be fulfilled by the Lead Contact, John L. Rinn (john.rinn@colorado.edu).
EXPERIMENTAL MODEL AND SUBJECT DETAILS
sgRNA design for CLING
Non-repetitive genomic regions were used to design sgRNAs (http://www.broadinstitute.org/rnai/public/analysis-tools/sgrna-design-v1), (Doench et al., 2014). Four sgRNAs with sgRNA scores around 1 and low off-target effects represented highly specific sgRNAs. Flanking Bbs I restriction sites were used to ligate sgRNAs with a backbone expressing either three MS2 or three PP7 stem-loops (Addgene #68426, #68424), (Maass et al., 2018; Shechner et al., 2015). mCherry or mVenus fluorescent proteins were expressed as fusion proteins with either MS2 or PP7 binding proteins (Addgene #68420), independent of dCas9 (Addgene #68416). All combinations of three of the four sgRNAs were pooled as endotoxin-free MAXI preparations to test off-target binding. SgRNA pools with the most specific signals were used for imaging (Table S1).
mESC culture
Male mESCs N3 were grown on 0.2% gelatinized petri-dish in 2i media [125 ml DMEM/F12, 125 ml Neurobasal Medium (ThermoFisher #21103-049), 1.25 ml NDiff Neuro-2 Medium Supplement 200x (Millipore #SCM012), 83.5 μl 7.5 % BSA Fraction V (ThermoFisher #15260-037), 2.5 ml B-27 Supplement 50x minus vitamin A (ThermoFisher #12587-010), 1 μl B β-mercaptoethanol, 25 μl PD0325901 (Stemgent #04-0006), 75 μl CHIR99021 (Stemgent #04-0004), 25 μl LIF ESGRO (107 units LIF/ml stock) (Chemicon #ESG1106), 1 % penicillin-streptomycin, 1 % non-essential amino acids (ThermoFisher #11140-076), and 1 % L-glutamine]. Media was changed daily. Cells were grown at 37 °C at 5 % CO2 and passaged every 3–4 days.
Transient transfections
0.6×10⁵ female hTERT RPE-1 cells (ATCC) were seeded 48 h, prior to 48 h transfections into 2-well LabTek chamber slides (ThermoFisher #155380) in DMEM/F12 with 10 % FBS and 1 x penicillin-streptomycin. Per reaction, 1.5 μl Lipofectamine 3000 reagent (ThermoFisher #L3000008) were mixed with 23.5 μl Opti-MEM® I Reduced Serum Medium (ThermoFisher #31985-062). A total of 25 μl Opti-MEM with 375 ng pooled sgRNAs, 500 ng fluorescent protein, 625 ng dCas9 and 4.75 μl P3000 reagent were incubated with the Lipofectamine mix for 5 min at room temperature.
3×10⁵ mESCs were seeded per well of a 0.2 % gelatinized μ-Slide 2-well ibiTreat plate (Ibidi #80286) 24 h prior to 48 h of transfection. Lipofectamine 3000 was used as described above. The transfection mix contained 400 ng dCas9, 500 ng fluorescent protein, and 375 ng sgRNAs. Media was changed 24 h post transfection and prior to imaging, 500 μl FluoroBrite™ DMEM Media ThermoFisher #A1896701), and 1 drop NucBlue® Live ReadyProbes® Reagent (ThermoFisher #R37605) were added.
Confocal super-resolution microscopy
The LSM880 with Airyscan (Zeiss) and the incubation module at 37°C and 5 % CO2 were used to visualize all experiments. Airyscan’s spatial resolution limit is ~130 nm. ZEN black edition version 2 (Zeiss) was used for acquisition. Images were acquired in super-resolution (SR) mode with 16 bit, 0.17 μm z-slices, and fitted zoom level, or in resolution-vs.-sensitivity (R-S) mode with 8 bit and 0.25 – 0.3 μm z-slices to increase imaging speed with the oil immersion objective Plan-Apochromat 63x/1.4 oil DIC M27. The spatial distances between co-localized or separated signals (no co-localizations) were measured from each voxel’s center (Figure S1B). Therefore, the voxel sizes of overlapping or merged foci influenced the co-localization distance. If the distance between the borders of two given foci was below < 50 nm, these foci were considered as co-localized (Figure S1B). Distances between the borders of two distinctly separated signals of > 50 nm determined no co-localization. If the borders of foci were closer than < 1 voxel distance to each other which corresponded to < 50 nm3, this distance represented the smallest measurable volume (distance). The time spent for acquiring one z-stack during time lapse imaging specified the minimal duration to determine co-localization, which was dependent on the nucleus size (~30 sec to 1:30 min). In contrast to specific signals which were visible throughout the entire 4D time-lapse experiments, non-specific signals (i.e. off-target effects) were not stable over time, showed less signal intensity, and the voxels were significantly smaller than specific signals (Maass et al., 2018). In general, the known off-target effects of CRISPR/Cas9-related techniques also influence CLING foci and background signals. CLING signals are dependent on multiple variables, such as the availability of RNA stem-loops (MS2, PP7) and their local concentration in the nucleus, the place of appending the stem-loops within the sgRNA structure, the effective binding affinity of the RNA-aptamer system, the expression levels and ratios of sgRNAs and fluorescent proteins to dCas9 in transiently transfected cells, and the genome wide occurrence of sgRNA off-target sites.
4D time-lapse imaging, post-processing and analyzing imaging data
Conditions for time-lapses, acquired in R-S mode with 8 bit and 0.27-0.3 μm z-slices were set up in experiment designer (ZEN black) with delay blocks of up to 70 seconds between every z-stack (see Table S2). Airyscan data were de-convoluted and processed in ZEN black. Pixel intensity display settings were automatically and manually optimized with a ‘linear best-fit analysis’ applied to the entire field of view of each channel separately in ZEN blue edition (Zeiss). Using the voxel centers, distance measurements were done in ZEN editions, and in arivis Vision4D 2.11–2.12. Processed 4D-experiments were inspected for signal integrity over time in ZEN black. Datasets were imported in Vision4D, time lapses with insufficient and dim signals (undistinguishable from background signal) were cropped. Signals were selected according to their appearance in every first and last plane of every time frame and exchanged by centroids to simplify visualization and to calculate three-dimensional coordinates. Hoechst nuclei stainings were visualized with the “skin” default setting in Vision4D. Tracking lines of CLING-signals were retraced for better visualization in a given figure. The three-dimensional coordinates of the centroids of every time frame were connected to tracks over time. Parameters distance and speeds of the total length of each track were automatically calculated in Vision4D. The path lengths (distance between two signals of consecutive time frames) and the interval lengths (distance between every other consecutive time frame) were calculated as follows:
To determine tortuosity per time frame, 3D-vectors described changes of direction. Sums of distances of two consecutive path lengths were generated and divided by the interval length between them to describe directional changes of the signal tracks. Combined datasets derive from time-matched time-lapses with a difference of ± 5 seconds per acquired z-stack. Ratios of distances were calculated based on distance measurements between co-localized signals and the control of GAPDH and PGR over time. All signals were divided by the mean distance of co-localized signals at time-point 1 of every experiment.
Hi-C analysis
Hi-C data for RPE-1 cells (GSE71831) (Darrow et al., 2016), and mESCs (GSE35156) (Dixon et al., 2012), were downloaded from NCBI GEO. For each cell type, biological replicates were pooled and the combined data was mapped to the hg19 or mm9 reference genomes, filtered and corrected by using the HiC-Pro package (version 2.7.8) according the software instructions (Servant et al., 2015). Signals or z-scores were calculated for each bin (intra-chromosomal: 40 kb, inter-chromosomal: 250 kb, or 500 kb) by utilizing the cworld toolkit (https://github.com/dekkerlab/cworld-dekker) “matrix2loess.pl” script with default options.
METHOD DETAILS
Signals were quantified in a minimum of 100 nuclei of at least four independent experiments (transfections); detailed parameter of 4D-imaging can be found in Table S2. The necessity to randomize or use blinding to analyze data was not given. All datasets and measurements were included in the study. 4D-datasets with insufficient and dim signals due to photo bleaching effects were cropped after some time points prior to analysis.
QUANTIFICATION AND STATISTICAL ANALYSIS
Significance was determined by non-parametrical Wilcoxon-Mann-Whitney rank sum testing, by Χ2-test, or Hartigan’s dip test (*** p < 0.0001, ** p < 0.01, * p < 0.05). T-bars indicate SEM (standard error of mean), or ±min/max. Plots and statistics were either generated in GraphPad Prism version 6.00, in MATLAB R2015b (MathWorks), or R v3.1.0 (Pearson correlation coefficients). Details about sample sizes and statistical tests can be found in each figure legend.
DATA AND SOFTWARE AVAILABILITY
Unprocessed tiff images (z-stacks) and examples of 4D-timelapses (z-stacks over time), Hi-C interaction matrices (mESCs, RPE-1), spatial distances, and speeds have been deposited at Mendeley (DOI:10.17632/2cdznxyk74.1)
Supplementary Material
Highlights.
CRISPR live-cell imaging (4D-CLING) of non-homologous chromosomal contacts (NHCCs)
4D-CLING reveals the spatiotemporal dynamics and properties of NHCCs
NHCCs are as frequent and stable as intra-chromosomal contacts
NHCCs occur at larger distances, perhaps why they are not readily detected in Hi-C
Acknowledgments
We thank the Rinn lab for intellectual input, Sven Terclavers (Zeiss) and Douglas Richardson (HCBI) for optimizing Airyscan time-lapse microscopy. The study was supported by U01 DA040612-01, P01 GM09911, HHMI Faculty Scholars Program (J.L.R), and the ‘Deutsche Forschungsgemeinschaft (DFG)’ (P.G.M, MA5028/1-3 and MA5028/1-1).
Footnotes
Author contributions
P.G.M. & J.L.R & A.R.B. conceived the study. P.G.M. performed the experiments and wrote the manuscript with J.L.R. and A.R.B. A.R.B analyzed Hi-C datasets and C.L.W. imaged mESCs.
Competing financial interests
The authors declare no competing financial interests.
Publisher's Disclaimer: This is a PDF file of an unedited manuscript that has been accepted for publication. As a service to our customers we are providing this early version of the manuscript. The manuscript will undergo copyediting, typesetting, and review of the resulting proof before it is published in its final citable form. Please note that during the production process errors may be discovered which could affect the content, and all legal disclaimers that apply to the journal pertain.
References
- Barutcu AR, Lajoie BR, McCord RP, Tye CE, Hong D, Messier TL, Browne G, van Wijnen AJ, Lian JB, Stein JL, et al. Chromatin interaction analysis reveals changes in small chromosome and telomere clustering between epithelial and breast cancer cells. Genome Biol. 2015;16:214. doi: 10.1186/s13059-015-0768-0. [DOI] [PMC free article] [PubMed] [Google Scholar]
- Beagrie RA, Scialdone A, Schueler M, Kraemer DC, Chotalia M, Xie SQ, Barbieri M, de Santiago I, Lavitas LM, Branco MR, et al. Complex multi-enhancer contacts captured by genome architecture mapping. Nature. 2017;543:519–524. doi: 10.1038/nature21411. [DOI] [PMC free article] [PubMed] [Google Scholar]
- Bergmann JH, Li J, Eckersley-Maslin MA, Rigo F, Freier SM, Spector DL. Regulation of the ESC transcriptome by nuclear long noncoding RNAs. Genome Res. 2015;25:1336–1346. doi: 10.1101/gr.189027.114. [DOI] [PMC free article] [PubMed] [Google Scholar]
- Bickmore WA, van Steensel B. Genome architecture: domain organization of interphase chromosomes. Cell. 2013;152:1270–1284. doi: 10.1016/j.cell.2013.02.001. [DOI] [PubMed] [Google Scholar]
- Blackstone T, Scharein R, Borgo B, Varela R, Diao Y, Arsuaga J. Modeling of chromosome intermingling by partially overlapping uniform random polygons. J Math Biol. 2011;62:371–389. doi: 10.1007/s00285-010-0338-8. [DOI] [PubMed] [Google Scholar]
- Branco MR, Pombo A. Intermingling of chromosome territories in interphase suggests role in translocations and transcription-dependent associations. PLoS Biol. 2006;4:e138. doi: 10.1371/journal.pbio.0040138. [DOI] [PMC free article] [PubMed] [Google Scholar]
- Cavalli G. Chromosome kissing. Curr Opin Genet Dev. 2007;17:443–450. doi: 10.1016/j.gde.2007.08.013. [DOI] [PubMed] [Google Scholar]
- Chao JA, Patskovsky Y, Almo SC, Singer RH. Structural basis for the coevolution of a viral RNA-protein complex. Nature structural & molecular biology. 2008;15:103–105. doi: 10.1038/nsmb1327. [DOI] [PMC free article] [PubMed] [Google Scholar]
- Chen B, Gilbert LA, Cimini BA, Schnitzbauer J, Zhang W, Li GW, Park J, Blackburn EH, Weissman JS, Qi LS, et al. Dynamic imaging of genomic loci in living human cells by an optimized CRISPR/Cas system. Cell. 2013;155:1479–1491. doi: 10.1016/j.cell.2013.12.001. [DOI] [PMC free article] [PubMed] [Google Scholar]
- Cremer T, Cremer M. Chromosome territories. Cold Spring Harb Perspect Biol. 2010;2:a003889. doi: 10.1101/cshperspect.a003889. [DOI] [PMC free article] [PubMed] [Google Scholar]
- Darrow EM, Huntley MH, Dudchenko O, Stamenova EK, Durand NC, Sun Z, Huang SC, Sanborn AL, Machol I, Shamim M, et al. Deletion of DXZ4 on the human inactive X chromosome alters higher-order genome architecture. Proc Natl Acad Sci U S A. 2016;113:E4504–4512. doi: 10.1073/pnas.1609643113. [DOI] [PMC free article] [PubMed] [Google Scholar]
- Dekker J. Two ways to fold the genome during the cell cycle: insights obtained with chromosome conformation capture. Epigenetics Chromatin. 2014;7:25. doi: 10.1186/1756-8935-7-25. [DOI] [PMC free article] [PubMed] [Google Scholar]
- Dekker J. Mapping the 3D genome: Aiming for consilience. Nature reviews Molecular cell biology. 2016;17:741–742. doi: 10.1038/nrm.2016.151. [DOI] [PubMed] [Google Scholar]
- Dekker J, Rippe K, Dekker M, Kleckner N. Capturing chromosome conformation. Science. 2002;295:1306–1311. doi: 10.1126/science.1067799. [DOI] [PubMed] [Google Scholar]
- Deng W, Shi X, Tjian R, Lionnet T, Singer RH. CASFISH: CRISPR/Cas9-mediated in situ labeling of genomic loci in fixed cells. Proc Natl Acad Sci U S A. 2015;112:11870–11875. doi: 10.1073/pnas.1515692112. [DOI] [PMC free article] [PubMed] [Google Scholar]
- Dixon JR, Jung I, Selvaraj S, Shen Y, Antosiewicz-Bourget JE, Lee AY, Ye Z, Kim A, Rajagopal N, Xie W, et al. Chromatin architecture reorganization during stem cell differentiation. Nature. 2015;518:331–336. doi: 10.1038/nature14222. [DOI] [PMC free article] [PubMed] [Google Scholar]
- Dixon JR, Selvaraj S, Yue F, Kim A, Li Y, Shen Y, Hu M, Liu JS, Ren B. Topological domains in mammalian genomes identified by analysis of chromatin interactions. Nature. 2012;485:376–380. doi: 10.1038/nature11082. [DOI] [PMC free article] [PubMed] [Google Scholar]
- Doench JG, Hartenian E, Graham DB, Tothova Z, Hegde M, Smith I, Sullender M, Ebert BL, Xavier RJ, Root DE. Rational design of highly active sgRNAs for CRISPR-Cas9-mediated gene inactivation. Nat Biotechnol. 2014;32:1262–1267. doi: 10.1038/nbt.3026. [DOI] [PMC free article] [PubMed] [Google Scholar]
- Edelman LB, Fraser P. Transcription factories: genetic programming in three dimensions. Curr Opin Genet Dev. 2012;22:110–114. doi: 10.1016/j.gde.2012.01.010. [DOI] [PubMed] [Google Scholar]
- Fu Y, Rocha PP, Luo VM, Raviram R, Deng Y, Mazzoni EO, Skok JA. CRISPR-dCas9 and sgRNA scaffolds enable dual-colour live imaging of satellite sequences and repeat-enriched individual loci. Nature communications. 2016;7:11707. doi: 10.1038/ncomms11707. [DOI] [PMC free article] [PubMed] [Google Scholar]
- Fudenberg G, Imakaev M. FISH-ing for captured contacts: towards reconciling FISH and 3C. Nat Methods. 2017 doi: 10.1038/nmeth.4329. [DOI] [PMC free article] [PubMed] [Google Scholar]
- Gavrilov AA, Gushchanskaya ES, Strelkova O, Zhironkina O, Kireev II, Iarovaia OV, Razin SV. Disclosure of a structural milieu for the proximity ligation reveals the elusive nature of an active chromatin hub. Nucleic Acids Res. 2013;41:3563–3575. doi: 10.1093/nar/gkt067. [DOI] [PMC free article] [PubMed] [Google Scholar]
- Giorgetti L, Galupa R, Nora EP, Piolot T, Lam F, Dekker J, Tiana G, Heard E. Predictive polymer modeling reveals coupled fluctuations in chromosome conformation and transcription. Cell. 2014;157:950–963. doi: 10.1016/j.cell.2014.03.025. [DOI] [PMC free article] [PubMed] [Google Scholar]
- Giorgetti L, Heard E. Closing the loop: 3C versus DNA FISH. Genome Biol. 2016;17:215. doi: 10.1186/s13059-016-1081-2. [DOI] [PMC free article] [PubMed] [Google Scholar]
- Gorkin DU, Leung D, Ren B. The 3D genome in transcriptional regulation and pluripotency. Cell Stem Cell. 2014;14:762–775. doi: 10.1016/j.stem.2014.05.017. [DOI] [PMC free article] [PubMed] [Google Scholar]
- Hacisuleyman E, Goff LA, Trapnell C, Williams A, Henao-Mejia J, Sun L, McClanahan P, Hendrickson DG, Sauvageau M, Kelley DR, et al. Topological organization of multichromosomal regions by the long intergenic noncoding RNA Firre. Nature structural & molecular biology. 2014;21:198–206. doi: 10.1038/nsmb.2764. [DOI] [PMC free article] [PubMed] [Google Scholar]
- Joyce EF, Erceg J, Wu CT. Pairing and anti-pairing: a balancing act in the diploid genome. Curr Opin Genet Dev. 2016;37:119–128. doi: 10.1016/j.gde.2016.03.002. [DOI] [PMC free article] [PubMed] [Google Scholar]
- Lajoie BR, Dekker J, Kaplan N. The Hitchhiker’s guide to Hi-C analysis: practical guidelines. Methods. 2015;72:65–75. doi: 10.1016/j.ymeth.2014.10.031. [DOI] [PMC free article] [PubMed] [Google Scholar]
- Langer-Safer PR, Levine M, Ward DC. Immunological method for mapping genes on Drosophila polytene chromosomes. Proc Natl Acad Sci U S A. 1982;79:4381–4385. doi: 10.1073/pnas.79.14.4381. [DOI] [PMC free article] [PubMed] [Google Scholar]
- Lawrence JB, Clemson CM. Gene associations: true romance or chance meeting in a nuclear neighborhood? J Cell Biol. 2008;182:1035–1038. doi: 10.1083/jcb.200808121. [DOI] [PMC free article] [PubMed] [Google Scholar]
- Lieberman-Aiden E, van Berkum NL, Williams L, Imakaev M, Ragoczy T, Telling A, Amit I, Lajoie BR, Sabo PJ, Dorschner MO, et al. Comprehensive mapping of long-range interactions reveals folding principles of the human genome. Science. 2009;326:289–293. doi: 10.1126/science.1181369. [DOI] [PMC free article] [PubMed] [Google Scholar]
- Ling JQ, Li T, Hu JF, Vu TH, Chen HL, Qiu XW, Cherry AM, Hoffman AR. CTCF mediates interchromosomal colocalization between Igf2/H19 and Wsb1/Nf1. Science. 2006;312:269–272. doi: 10.1126/science.1123191. [DOI] [PubMed] [Google Scholar]
- Lomvardas S, Barnea G, Pisapia DJ, Mendelsohn M, Kirkland J, Axel R. Interchromosomal interactions and olfactory receptor choice. Cell. 2006;126:403–413. doi: 10.1016/j.cell.2006.06.035. [DOI] [PubMed] [Google Scholar]
- Ma H, Tu LC, Naseri A, Huisman M, Zhang S, Grunwald D, Pederson T. Multiplexed labeling of genomic loci with dCas9 and engineered sgRNAs using CRISPRainbow. Nat Biotechnol. 2016;34:528–530. doi: 10.1038/nbt.3526. [DOI] [PMC free article] [PubMed] [Google Scholar]
- Maass PG, Barutcu AR, Shechner DM, Weiner CL, Melé M, Rinn JL. Spatiotemporal allele organization by allele-specific CRISPR live-cell imaging (SNP-CLING) Nat Struct Mol Biol. 2018 doi: 10.1038/s41594-017-0015-3. [DOI] [PMC free article] [PubMed] [Google Scholar]
- Maass PG, Rump A, Schulz H, Stricker S, Schulze L, Platzer K, Aydin A, Tinschert S, Goldring MB, Luft FC, et al. A misplaced lncRNA causes brachydactyly in humans. J Clin Invest. 2012;122:3990–4002. doi: 10.1172/JCI65508. [DOI] [PMC free article] [PubMed] [Google Scholar]
- McStay B. Nucleolar organizer regions: genomic ‘dark matter’ requiring illumination. Genes Dev. 2016;30:1598–1610. doi: 10.1101/gad.283838.116. [DOI] [PMC free article] [PubMed] [Google Scholar]
- Nagano T, Varnai C, Schoenfelder S, Javierre BM, Wingett SW, Fraser P. Comparison of Hi-C results using in-solution versus in-nucleus ligation. Genome Biol. 2015;16:175. doi: 10.1186/s13059-015-0753-7. [DOI] [PMC free article] [PubMed] [Google Scholar]
- Qin P, Parlak M, Kuscu C, Bandaria J, Mir M, Szlachta K, Singh R, Darzacq X, Yildiz A, Adli M. Live cell imaging of low- and non-repetitive chromosome loci using CRISPR-Cas9. Nature communications. 2017;8:14725. doi: 10.1038/ncomms14725. [DOI] [PMC free article] [PubMed] [Google Scholar]
- Rao SS, Huntley MH, Durand NC, Stamenova EK, Bochkov ID, Robinson JT, Sanborn AL, Machol I, Omer AD, Lander ES, et al. A 3D map of the human genome at kilobase resolution reveals principles of chromatin looping. Cell. 2014;159:1665–1680. doi: 10.1016/j.cell.2014.11.021. [DOI] [PMC free article] [PubMed] [Google Scholar]
- Satzinger H. Theodor and Marcella Boveri: chromosomes and cytoplasm in heredity and development. Nature reviews Genetics. 2008;9:231–238. doi: 10.1038/nrg2311. [DOI] [PubMed] [Google Scholar]
- Servant N, Varoquaux N, Lajoie BR, Viara E, Chen CJ, Vert JP, Heard E, Dekker J, Barillot E. HiC-Pro: an optimized and flexible pipeline for Hi-C data processing. Genome Biol. 2015;16:259. doi: 10.1186/s13059-015-0831-x. [DOI] [PMC free article] [PubMed] [Google Scholar]
- Shao S, Zhang W, Hu H, Xue B, Qin J, Sun C, Sun Y, Wei W, Sun Y. Long-term dual-color tracking of genomic loci by modified sgRNAs of the CRISPR/Cas9 system. Nucleic Acids Res. 2016;44:e86. doi: 10.1093/nar/gkw066. [DOI] [PMC free article] [PubMed] [Google Scholar]
- Shechner DM, Hacisuleyman E, Younger ST, Rinn JL. Multiplexable, locus-specific targeting of long RNAs with CRISPR-Display. Nat Methods. 2015;12:664–670. doi: 10.1038/nmeth.3433. [DOI] [PMC free article] [PubMed] [Google Scholar]
- Shopland LS, Johnson CV, Byron M, McNeil J, Lawrence JB. Clustering of multiple specific genes and gene-rich R-bands around SC-35 domains: evidence for local euchromatic neighborhoods. J Cell Biol. 2003;162:981–990. doi: 10.1083/jcb.200303131. [DOI] [PMC free article] [PubMed] [Google Scholar]
- Spilianakis CG, Lalioti MD, Town T, Lee GR, Flavell RA. Interchromosomal associations between alternatively expressed loci. Nature. 2005;435:637–645. doi: 10.1038/nature03574. [DOI] [PubMed] [Google Scholar]
- Wang Q, Sawyer IA, Sung MH, Sturgill D, Shevtsov SP, Pegoraro G, Hakim O, Baek S, Hager GL, Dundr M. Cajal bodies are linked to genome conformation. Nature communications. 2016a;7:10966. doi: 10.1038/ncomms10966. [DOI] [PMC free article] [PubMed] [Google Scholar]
- Wang S, Su JH, Zhang F, Zhuang X. An RNA-aptamer-based two-color CRISPR labeling system. Sci Rep. 2016b;6:26857. doi: 10.1038/srep26857. [DOI] [PMC free article] [PubMed] [Google Scholar]
- Williamson I, Berlivet S, Eskeland R, Boyle S, Illingworth RS, Paquette D, Dostie J, Bickmore WA. Spatial genome organization: contrasting views from chromosome conformation capture and fluorescence in situ hybridization. Genes Dev. 2014;28:2778–2791. doi: 10.1101/gad.251694.114. [DOI] [PMC free article] [PubMed] [Google Scholar]
- Yang F, Deng X, Ma W, Berletch JB, Rabaia N, Wei G, Moore JM, Filippova GN, Xu J, Liu Y, et al. The lncRNA Firre anchors the inactive X chromosome to the nucleolus by binding CTCF and maintains H3K27me3 methylation. Genome Biol. 2015;16:52. doi: 10.1186/s13059-015-0618-0. [DOI] [PMC free article] [PubMed] [Google Scholar]
- Zhou Y, Wang P, Tian F, Gao G, Huang L, Wei W, Xie XS. Painting a specific chromosome with CRISPR/Cas9 for live-cell imaging. Cell Res. 2017 doi: 10.1038/cr.2017.9. [DOI] [PMC free article] [PubMed] [Google Scholar]
Associated Data
This section collects any data citations, data availability statements, or supplementary materials included in this article.