

Abstract
Purpose
Merkel cell carcinoma (MCC) is an aggressive cancer with frequent metastasis and death with few effective therapies. Because programmed death ligand-1 (PD-L1) is frequently expressed in MCC, immune checkpoint blockade has been leveraged as treatment for metastatic disease. There is therefore a critical need to understand the relationships between MCPyV status, immune profiles, and patient outcomes.
Experimental Design
IHC for CD3, CD8, PD-1, PD-L1, and MCPyV T-antigen (to determine MCPyV status) was performed on 62 primary MCCs with annotated clinical outcomes. Automated image analysis quantified immune cell density (positive cells/mm2) at discrete geographic locations (tumor periphery, center, and hotspot). T-cell receptor sequencing (TCRseq) was performed in a subset of MCCs.
Results
No histopathologic variable associated with overall survival (OS) or disease-specific survival (DSS), whereas higher CD3+ (P = 0.004) and CD8+ (P = 0.037) T-cell density at the tumor periphery associated with improved OS. Higher CD8+ T-cell density at the tumor periphery associated with improved DSS (P = 0.049). Stratifying MCCs according to MCPyV status, higher CD3+ (P = 0.026) and CD8+ (P = 0.015) T-cell density at the tumor periphery associated with improved OS for MCPyV+ but not MCPyV− MCC. TCRseq revealed clonal overlap among MCPyV+ samples, suggesting an antigen-specific response against a unifying antigen.
Conclusions
These findings establish the tumor-associated immune infiltrate at the tumor periphery as a robust prognostic indicator in MCC and provide a mechanistic rationale to further examine whether the immune infiltrate at the tumor periphery is relevant as a biomarker for response in ongoing and future checkpoint inhibitor trials in MCC.
Introduction
Merkel cell carcinoma (MCC) is an aggressive cutaneous neuroendocrine carcinoma with frequent metastasis and death. In the United States, MCC incidence has increased almost fourfold over the past two decades, and MCC is currently the second leading cause of skin cancer–related death (1, 2). Risk factors for MCC include fair skin, chronic sun exposure, chronic immune suppression, and advanced age (2–8). The identification of the Merkel cell polyomavirus (MCPyV) was a critical advance in our understanding of MCC biology. MCPyV DNA integrates into the host genome of approximately 70%–80% of MCCs and is thought to be an important pathogenic driver in a subset of MCCs (9).
Currently, prognostication in MCC is based largely on the TNM staging guidelines set forth in the American Joint Committee on Cancer (AJCC) staging system (8). However, the significance of individual prognostic indicators, including clinical (sex, age, anatomic site of disease; refs. 3, 4, 7) and histopathologic features [tumor depth, tumor size, proliferative rate, perineural invasion (PNI), and lymphovascular invasion (LVI)] remain controversial (3, 4, 7, 10, 11). While most studies confirm that prognosis of MCC largely follows stage (in particular stages III and IV), TNM staging appears insufficient to predict outcome of MCC among patients presenting with stage I or II disease (7). There is therefore a critical need to delineate additional biomarkers that meaningfully inform prognosis in MCC so that management strategies might be modified accordingly (12).
There is emerging evidence that MCC is controlled by the immune system and thus different immune cell markers might represent prognostically and biologically informative surrogates of patient outcome. MCC develops more frequently in patients with immune dysfunction/suppression than immunocompetent patients (5), and immunosuppressed patients with MCC exhibit reduced survival compared with stage-matched immunocompetent counterparts (6, 7, 13). Immune checkpoint blockade (anti-PD-1) has shown an approximately 80% response rate in phase I trials of MCC (14). Survival in MCC correlates with changes in immune response gene expression signatures as well as the relative density of the associated immune infiltrate (15–17). High intratumoral CD8+ lymphocyte infiltration in MCC independently correlated with outcome in MCC (16) and increased tumor-associated CD3+ T cells significantly associated with longer survival (17). Finally, treatment with ex vivo–expanded MCPyV-specific T cells resulted in the eradication of metastases in isolated patients (18). What remains controversial includes reproducible approaches to lymphocyte quantification, the significance of the anatomic distribution of the immune infiltrate (center versus periphery), and the relationship between the immune infiltrate and MCPyV status.
Together with the efficacy of immune checkpoint blockade therapies that mobilize antitumoral immunity in the treatment of solid malignancies, including MCC, there is a strong rationale to systematically define the density, distribution, and composition of the immune infiltrates in MCC to determine whether any of these parameters impact clinical outcome. Our findings confirm the tumor-associated T-cell immune infiltrate at the tumor periphery as a robust prognostic indicator in MCC and provide a mechanistic rationale to further interrogate this biomarker in correlative studies related to ongoing and future checkpoint inhibitor trials that seek to leverage this biologic effect in MCC treatment.
Materials and Methods
Selection of cases
With approval from the Institutional Review Board at The University of Texas MD Anderson Cancer Center, we reviewed the pathology files and identified primary MCCs diagnosed and treated between 2002–2015. Clinical variables included age, sex, primary tumor site, metastases (as a group and individual sites separately: sentinel lymph node, skin, central nervous system, and viscera), associated malignancy, overall survival (OS), and disease-specific survival (DSS). Pathologic variables measured included tumor size, depth of invasion, growth pattern, number of mitotic figures/mm2, lymphovascular invasion (LVI), perineural invasion (PNI), and invasion beyond the skin. Cases with a “mixed histology” (i.e., combined squamous carcinoma and MCC) were excluded given their distinctive genetic and immunohistochemical profiles (19).
IHC
Immunohistochemical studies were performed on a Leica Bond autostainer, using the following antibodies and 3,3′-diaminoben-zidinechromogen: CD3 (DakoA0452; 1:100), CD8 (Life Sciences Technology MS457s; 1:25), programmed death-1 (PD-1; Abcam ab137132; 1:250), and programmed death ligand-1 (PD-L1; Cell Signaling Technology 13684S; 1:100; as described in ref. 20). MCPyV status was determined for each case by IHC for the MCPyV T-antigen (Santa Cruz Biotechnology sc-136172; 1:100; as described in ref. 21).
Statistical analyses
Univariate logistic regression models estimated the association between outcomes and clinical–pathologic characteristics. Where appropriate, Firth method was used to estimate models with complete or quasi-complete separation. Survival analyses were performed using the Kaplan–Meier method (outcomes: OS and DSS; compared with the log-rank test) and Cox proportional hazards models. OS was defined from time of diagnosis to death due to any cause, and DSS was defined from time of diagnosis to death due to disease. Patients who died of an unrelated or unknown cause were censored for DSS analyses. Time to metastasis was calculated from date of primary diagnosis. Associations between clinicopathologic parameters were assessed using Fisher exact tests, Wilcoxon tests, or Spearman correlations. No adjustments were made for multiplicity of testing.
Image analysis
Slides were scanned at 20 × magnification (Aperio Scanscope AT Turbo; Leica Biosystems). Image analysis software (Aperio ImageScope) measured the number of positive cells within designated areas. Given the relatively small size of immune cells, a modified version of the Nuclear v9 algorithm was applied as a basis for detecting immune marker positivity, with the intensity thresholds adjusted manually to remove background artifacts and to account for variable differences in cell size (especially for PD-L1). CD3, CD8, and PD-1 expression were assessed in lymphocytes, while PD-L1 expression was counted in tumor-associated stromal cells and when present, in tumor cells. For each marker, the tumor area containing the highest density of associated immunohistochemically positive (IHC+) cells was delineated with a fixed square with area of 1 mm2 and was designated the “hotspot” (Fig. 1, red boxes), the positive cells in this square were counted and the number of positive cells reported as the number of IHC+ cells/mm2. The tumor “periphery” (Fig. 1, green boxes) was defined to include approximately an equal length of the leading edge of tumor cells and the adjacent stromal interface. The “center” (Fig. 1, yellow boxes) was defined as an area of tumor where a 1-mm2 square could be drawn that contained tumor cells entirely but did not overlap with a peripheral square. For each of these regions (periphery/ leading edge or center), a total area up to 5 mm2 containing the highest density of IHC+ cells was delineated, and up to five fixed squares, each with a 1-mm2 area, were drawn to encompass these areas. When the periphery or center of the tumor was smaller than 5 mm2, fewer 1-mm2 squares (but as many as possible) were designated. For 11 cases, the tumor surface area was insufficient for distinction of a periphery/leading edge from the center. For these cases, only the periphery/leading edge and hotspot were considered. For each region (periphery/leading edge and center), the numbers of positive cells were summed, and the total number of positive cells was divided by the total area (mm2) in which cells were counted. The result was reported as number of IHC+ cells/mm2.
Figure 1.
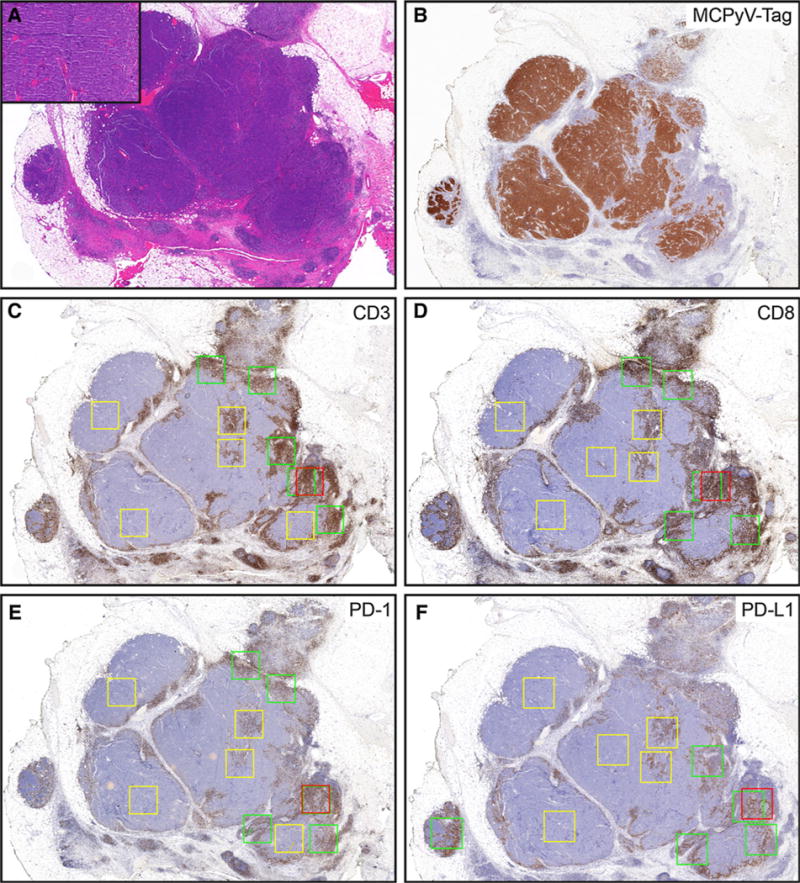
The relative composition, density, and distribution of immune infiltrates in primary Merkel cell carcinoma. A, scanning magnification shows tumor extending into subcutaneous tissue. Inset shows morphology of tumor cells (H&E, 20×; inset: 200×). B, Merkel cell polyoma virus T-antigen (20×). C–F, schematic of how immune cell density was assessed. Red box designates “hotspot” (single 1-mm2 box); green boxes designate tumor periphery (5 × 1-mm2 boxes); and yellow boxes designate central areas (5 × 1-mm2 boxes). C, CD3 (20×). D, CD8 (20×). E, PD1 (20×). F, PD-L1 (20×). In some instances, the red hot spot box overlaps with a green peripheral box as seen for PD-1.
CDR3 sequencing and clonality
Total DNA was extracted from formalin-fixed paraffin-embedded (FFPE)-embedded whole tissue sections using QIAamp DNA FFPE Tissue Kit (Qiagen). MCC samples selected for TCR sequencing included a broad, but comparable range of T-cell densities [for MCPyV+ MCCs, the mean density of CD8+ T cells at the tumor periphery was 1,512/mm2 (range: 510–2,308/mm2); for MCPyV− MCCs, the mean density of CD8+ T cells at the periphery of the tumor was 1,616/mm2 (range: 379–3,034/mm2). CDR3 regions were sequenced with an Illumina MiSeq by ImmunoSEQ sequencing (Adaptive Biotechnologies). This assay uses a multiplex PCR with forward primers in each V segment and reverse primers in each J segment to selectively amplify the rearranged VDJ from each cell in a format compatible with sequencing (22). Clonal overlap and clonality values were given by the ImmunoSeq Analyzer software. Clonality values were calculated for patient samples where clonality = 1 − (entropy)/log2 (# of productive unique sequences), where the entropy term takes into account the varying clone frequency. A maximally diverse population has a clonality value of zero and a monoclonal population would approach 1 (23). Sufficient DNA was isolated from all samples for TCR sequencing to be performed appropriately.
Results
Clinical and pathologic features of cases
Table 1 summarizes the clinical and pathologic characteristics of the cohort. Sixty-two cases of primary MCC were selected for study from 45 men and 17 women with a median age of 71 years (range: 32–91 years). The median follow-up period was 713 days (range: 28–4,324). Immunohistochemical studies for the MCPyV T-antigen demonstrated MCPyV positivity in 39 cases (63%) from 24 men and 15 women. A greater proportion of women (88%) than men (53%) had MCPyV+ MCC (P = 0.017). MCPyV+ MCCs were more common on the upper (38%) and lower (28%) extremities (compared with 17% and 9% MCPyV−, respectively; P = 0.020) than on the head and neck (n = 8 MCPyV+ vs. 12 MCPyV−) or trunk (n = 5 MCPyV+ vs. 5 MCPyV−)—a similar distribution to that described previously (24). In addition, MCPyV− MCCs had deeper dermal invasion (P = 0.001) and larger tumor size (P = 0.010) than MCPyV+ MCCs, but other clinical-pathologic variables were not significantly associated with MCPyV status (Supplementary Table S1).
Table 1.
Clinical and pathologic characteristics of the patient cohort
| Characteristics | Value |
|---|---|
| Age, median (range), y | 71 (32-91) |
| Tumor size, median (range), mm | 16 (4-93) |
| Tumor depth, median (range), mm | 9 (1.2-60) |
| No. of mitotic figures per mm2, median (range) | 27 (1-162) |
| Sex, n (%) | |
| Male | 45 (73) |
| Female | 17 (27) |
| Merkel cell polyomavirus, n (%) | |
| Negative | 22 (36) |
| Positive | 39 (63) |
| Not available | 1 (1) |
| Primary tumor site, n (%) | |
| Head and neck | 20 (32) |
| Trunk | 10 (16) |
| Upper extremity | 19 (31) |
| Lower extremity | 13 (21) |
| Lymphovascular invasion, n (%) | |
| No | 24 (39) |
| Yes | 38 (61) |
| Perineural invasion, n (%) | |
| No | 51 (82) |
| Yes | 11 (18) |
| Invasion beyond skin, n (%) | |
| No | 44 (71) |
| Yes | 18 (29) |
| Invasion structures, n (%) | |
| No | 53 (86) |
| Yes | 9 (14) |
| Growth pattern, n (%) | |
| Infiltrative | 28 (45) |
| Nodular | 21 (34) |
| Mixed | 13 (21) |
| Lymph infiltrate, n (%) | |
| Absent | 1 (2) |
| Non-brisk | 59 (95) |
| Brisk | 2 (3) |
| Metastasis to any site, n (%) | |
| No | 27 (44) |
| Yes | 35 (56) |
| Metastasis to SLN, n (%) | |
| No | 43 (69) |
| Yes | 19 (31) |
| Metastasis to lymph node beyond SLN, n (%) | |
| No | 43 (69) |
| Yes | 19 (31) |
| Metastasis to visceral organ, n (%) | |
| No | 49 (79) |
| Yes | 12 (19) |
| Unknown | 1 (1) |
| Metastasis to central nervous system, n (%) | |
| No | 60 (97) |
| Yes | 2 (3) |
| Associated malignancy, n (%) | |
| No | 37 (60) |
| Yes | 25 (40) |
| Associated non-skin malignancy, n (%) | |
| No | 52 (84) |
| Yes | 10 (16) |
| Vital status, n (%) | |
| Died of disease | 8 (13) |
| Died of other or unknown cause | 10 (16) |
| Alive with disease | 6 (10) |
| Alive and disease free | 38 (61) |
Abbreviations: SLN, sentinel lymph node; y, years.
Correlation between clinical and pathologic variables and metastasis
Univariate logistic regression models determined that the clinical–pathologic variables associated with increased odds of metastasis were PNI (metastasis to any site; OR = 25.8, P = 0.034; Supplementary Table S2) and age (metastasis to viscera; OR = 0.94; P = 0.016; Table 2). PNI was additionally associated with an increased odds of metastasis to lymph nodes beyond the sentinel lymph node (OR = 9.7; P = 0.003; Supplementary Table S3). None of the remaining clinical or pathologic variables of interest (including PNI) were associated with metastasis to a sentinel lymph node (Supplementary Table S4), visceral organs (Table 2), or the central nervous system (Supplementary Table S5). No significant associations were detected between MCPyV+ MCCs or MCPyV− MCCs and their relative propensity to develop metastases to any site (data not shown).
Table 2.
Univariate logistic regression models for metastasis to viscera
| Variable | OR (95% CI) | P |
|---|---|---|
| Primary tumor sitea | ||
| Head and neck | 1.25 (0.24-6.54) | 0.66 |
| Trunk | 1.25 (0.17-9.09) | |
| Lower extremity | 1.5 (0.25-8.98) | |
| Age, y | 0.94 (0.89-0.99) | 0.016 |
| Femaleb | 1.39 (0.36-5.38) | 0.64 |
| Tumor size, mm | 1.01 (0.98-1.05) | 0.43 |
| Depth of invasion, mm | 1.01 (0.95-1.08) | 0.74 |
| LVI present | 2.07 (0.50-8.61) | 0.32 |
| PNI present | 0.89 (0.17-4.78) | 0.89 |
| No. of mitotic figures per mm2 | 0.99 (0.97-1.02) | 0.53 |
| Number of IHC+ cells/mm2,c | ||
| Periphery | ||
| CD8+ | 0.37 (0.22-1.00) | 0.037 |
| PD-L1+ | 1.00 (1.00-1.00) | 0.29 |
| PD-1+ | 0.61 (0.22-1.00) | 0.031 |
| CD3+ | 0.61 (0.61-1.00) | 0.019 |
| Center | ||
| CD8+ | 1.00 (1.00-1.00) | 0.45 |
| PD-L1+ | 1.00 (1.00-1.01) | 0.60 |
| PD-1+ | 1.00 (0.99-1.00) | 0.36 |
| CD3+ | 0.37 (0.22-1.00) | 0.048 |
| Hotspot | ||
| CD8+ | 0.61 (0.37-1.00) | 0.048 |
| PD-L1+ | 1.00 (1.00-1.00) | 0.46 |
| PD-1+ | 1.00 (1.00-1.00) | 0.08 |
| CD3+ | 0.61 (0.61-1.00) | 0.031 |
NOTE: Values in bold indicate statistical significance.
Abbreviations: IHC+, immunohistochemically positive; LVI, lymphovascular invasion; PNI, perineural invasion.
Reference value is upper extremity.
Reference value is male.
ORs for this section of table calculated per 500 cells/mm2.
Correlation between clinical and pathologic variables and survival
Increased age associated with somewhat shorter OS (HR = 1.05; P = 0.04). There was a trend towards longer OS in women than in men, but this did not achieve statistical significance. No other clinical or pathologic covariates of interest significantly associated with OS or DSS (Table 3).
Table 3.
Univariate cox proportional hazards models for OS and for DSS
| Covariate | OS
|
DSS
|
||
|---|---|---|---|---|
| HR (CL) | P | HR (CL) | P | |
| Age, y | 1.05 (1.00-1.09) | 0.04 | 0.98 (0.93-1.04) | 0.54 |
| Tumor size, mm | 1.0039 (0.98-1.03) | 0.73 | 1.01 (0.98-1.04) | 0.61 |
| Depth of invasion, mm | 0.9535 (0.88-1.04) | 0.26 | 0.98 (0.88-1.08) | 0.65 |
| No. of mitotic figures/mm2 | 1.0012 (0.99-1.01) | 0.87 | 1.00 (0.99-1.02) | 0.69 |
| Primary tumor sitea | ||||
| Head and neck | 2.00 (0.55-7.25) | 0.29 | 1.57 (0.26-9.43) | 0.88 |
| Trunk | 1.44 (0.38-5.44) | 0.59 | 1.37 (0.19-10.04) | 0.76 |
| Lower extremity | 1.21 (0.26-5.51) | 0.81 | 0.67 (0.06-7.44) | 0.88 |
| LVI present | 1.01 (0.40-2.56) | 0.99 | 0.79 (0.20-3.15) | 0.73 |
| PNI present | 1.16 (0.37-3.61) | 0.80 | 1.68 (0.33-8.41) | 0.53 |
| Femaleb | 0.28 (0.06-1.24) | 0.09 | 0.13c (0.01-2.66)c | 0.18c |
| Number of IHC+ cells/mm2,d | ||||
| Periphery | ||||
| CD8+ | 0.52 (0.29-0.95) | 0.037 | 0.39 (0.15-1.00) | 0.049 |
| PD-L1+ | 0.61 (0.33-1.16) | 0.13 | 0.52 (0.20-1.42) | 0.20 |
| PD-1+ | 0.58 (0.33-1.00) | 0.06 | 0.43 (0.16-1.16) | 0.10 |
| CD3+ | 0.64 (0.45-0.86) | 0.004 | 0.78 (0.55-1.16) | 0.22 |
| Center | ||||
| CD8+ | 1.16 (0.39-3.66) | 0.79 | 1.35 (0.23-7.74) | 0.74 |
| PD-L1+ | 0.55 (0.02-18.94) | 0.73 | 0.39 (0.00-97.41) | 0.73 |
| PD-1+ | 1.57 (0.90-2.72) | 0.09 | 1.91 (0.95-3.85) | 0.07 |
| CD3+ | 1.00 (1.00-1.00) | 0.86 | 1.28 (0.55-3.00) | 0.58 |
| Hotspot | ||||
| CD8+ | 0.64 (0.41-1.00) | 0.042 | 0.52 (0.25-1.05) | 0.07 |
| PD-L1+ | 0.70 (0.47-1.05) | 0.10 | 0.67 (0.35-1.28) | 0.22 |
| PD-1+ | 0.74 (0.52-1.11) | 0.14 | 0.70 (0.41-1.22) | 0.24 |
| CD3+ | 0.67 (0.52-0.86) | 0.001 | 0.82 (0.61-1.11) | 0.19 |
NOTE: Values in bold indicate statistical significance.
Abbreviations: CL, confidence level; LVI, lymphovascular invasion; PNI, perineural invasion.
Reference value is upper extremity.
Reference value is male.
Firth penalized method was used to adjust for complete separation of groups.
HR for this section of table calculated per 500 cells/mm2.
Density, distribution, and composition of tumor-associated immune infiltrates correlate with metastasis in MCC
Immunohistochemical studies for CD3, CD8, PD-1, and PD-L1 were performed, and the relative density of IHC+ cells at the hotspot, tumor periphery, and tumor center were determined (see Materials and Methods; Fig. 1). We first assessed for relationships between the density, distribution, and composition of immune infiltrates and various clinicopathologic variables. We observed a weak correlation between increased depth of invasion and the density of PD-L1+ cells at the hotspot and the periphery (ρ = 0.41, P = 0.001; Supplementary Table S6) and between the female sex and density of PD-L1+ cells at the hotspot (P = 0.022) and the periphery (P = 0.024; Supplementary Table S7).
Univariate logistic regression models determined the relationship between the relative density, distribution, and composition of the associated lymphocytic infiltrates and different endpoints of clinical outcome. First, increased CD8+ T cells at the periphery (OR = 0.37, P = 0.037) and hotspot (OR = 0.61, P = 0.048) and increased CD3+ T cells at the periphery (OR = 0.61, P = 0.019), hotspot (OR = 0.61, P = 0.031), and the center (OR = 0.37, P = 0.048) of the tumor each associated with reduced odds for visceral metastases (Table 2). Furthermore, an increased density of PD1+ cells at the tumor periphery correlated with reduced risk of metastasis to (i) any site (Supplementary Table S2), (ii) lymph nodes beyond the sentinel lymph node (Supplementary Table S3), and (iii) visceral organs (OR = 0.61, P = 0.031; Table 2). No additional covariates related to the density, distribution, and composition of the immune infiltrate associated with increased odds of metastases to other sites.
Density, distribution, and composition of tumor-associated immune infiltrates correlate with survival in MCC
Next, we fit univariate Cox proportional hazard models (per 500 cells/mm2) to assess the association between the density, distribution, and composition of the associated immune infiltrate and either OS or DSS. OS (Table 3) improved with increased density of CD8+ T cells at the periphery (HR = 0.52, P = 0.037) and hotspot (HR = 0.64, P = 0.042) and increased density of CD3+ T cells at the periphery (HR = 0.64, P = 0.004) and hotspot (HR = 0.67, P = 0.001). Thus, every increase of 500 CD3+ or CD8+ T cells/mm2 at the periphery of a MCC associates with a 36% (P = 0.004) or 48% P = 0.037) reduction in the risk of death, respectively (Table 3). Furthermore, there was a significant association between the density of CD8+ T cells at the tumor periphery and DSS (HR = 0.39, P = 0.049): an increase in 500 CD8+ T cells/mm2 at the periphery of MCC associates with a 61% reduction in the risk of MCC-specific death (Table 3).
Kaplan–Meier analyses (Fig. 2) supported these observations: OS was significantly improved for patients with CD3+ T-cell density above the median at the tumor periphery (P = 0.013) and hotspot (P = 0.048), and there was a similar trend (albeit not achieving significance) for patients with CD8+ T-cell density above the median at the tumor periphery (P = 0.056). Further validation is necessary to determine the most clinically relevant cut-off values for tumor-associated immune infiltrate and survival. The densities of PD1+ and PD-L1+ cells in the tumor center, periphery, or hotspot did not significantly associate with OS or DSS.
Figure 2.
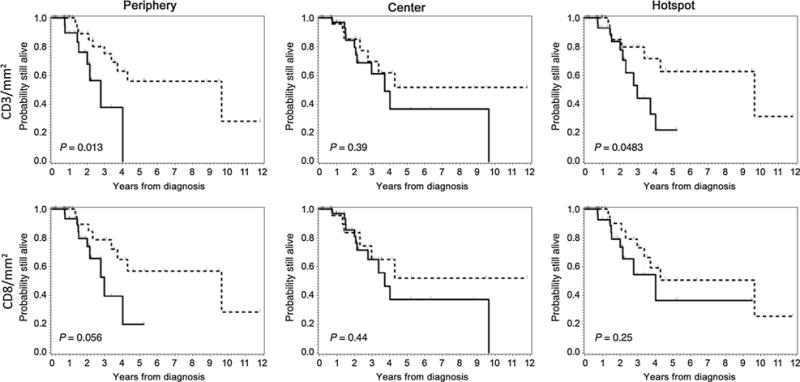
Kaplan-Meier analysis of overall survival among all MCC patients according to the density, composition, and distribution of the inflammatory infiltrate. OS according to immune cell density/mm2 at the periphery (left), center (middle), and hotspot (right) of MCCs. Top row, OS according to CD3+ T cells/mm2. Bottom row, OS according to CD8+ T cells/mm2. Legend: Patients with cell densities above the median indicated by dashed line (-----) and patients with cell density below the median indicated by solid line (———).
Impact of immune infiltrate on survival in MCC is greatest in patients with MCPyV+ disease
Next, we assessed for an association between the density, distribution, and composition of the associated immune infiltrate on metastasis and survival in MCC when lesions were stratified according to MCPyV status. With respect to the immune infiltrate, only the density of PD-L1+ cells at the periphery (median: 674.9/mm2 in MCPyV+ MCCs vs. 213.3/mm2 in MCPyV− MCCs; P = 0.0002) and the hotspot (median: 1,129.4/mm2 in MCPyV+ MCCs vs. 308.7/mm2 in MCPyV− MCCs; P = 0.0002) differed between MCPyV+ and MCPyV− MCCs (Supplementary Table S8), but a statistically significant difference in frequency of PD-L1 positivity in tumor cells between these MCCs was not observed. Thirty-eight percent of MCPyV− MCCs compared with 56% and MCPyV+ MCCs exhibited moderate-strong PD-L1 positivity in a variable number of MCC tumor cells (>5%) as well as inflammatory cells (P = 0.07). MCPyV+ and MCPyV− MCCs did not differ with respect to the density of any other immune infiltrates in the tumor periphery, hotspot, or center (Supplementary Table S8).
In MCPyV− MCCs, univariate Cox proportional hazard regression models did not determine any association between the immune infiltrate densities at any location and OS or DSS (Table 4). In MCPyV+ MCCs, however, the density of CD3+ T cells at the periphery (HR = 0.61, P = 0.026) and hotspot (HR = 0.67, P = 0.018) and CD8+ T cells at the periphery (HR = 0.33, P = 0.015) and hotspot (HR = 0.37, P = 0.011) each associated with improved OS (Table 4). In short, for every increase of 500 CD3+ or CD8+ T cells/mm2 at the periphery of a MCPyV+ MCC, there was a 39% and 67% reduction in the risk of death, respectively. Kaplan–Meier survival plots (Supplementary Fig. S2) supported this: there was a trend towards improved survival in patients with MCPyV+ MCCs whose CD3+ T-cell density exceeded the median at the hotspot, although this did not achieve significance (P = 0.085).
Table 4.
Univariate cox proportional hazard models for overall survival of MCC according to MCPyV status
| Covariate | HRa (CL) | P |
|---|---|---|
| MCPyV Negative | ||
| Periphery | ||
| CD8+ | 0.61 (0.33-1.16) | 0.14 |
| PD-L1+ | 0.32 (0.03-3.85) | 0.37 |
| PD-1+ | 0.58 (0.20-1.57) | 0.28 |
| CD3+ | 0.70 (0.43-1.16) | 0.17 |
| Center | ||
| CD8+ | 0.95 (0.32-2.85) | 0.93 |
| PD-L1+ | 6.66 (0.09-498.33) | 0.39 |
| PD-1+ | 1.28 (0.70-2.46) | 0.40 |
| CD3+ | 1.28 (0.64-2.58) | 0.46 |
| Hotspot | ||
| CD8+ | 0.67 (0.41-1.11) | 0.11 |
| PD-L1+ | 0.32 (0.03-2.85) | 0.31 |
| PD-1+ | 0.78 (0.43-1.49) | 0.48 |
| CD3+ | 0.67 (0.43-1.00) | 0.06 |
| MCPyV Positive | ||
| Periphery | ||
| CD8+ | 0.33 (0.13-0.82) | 0.015 |
| PD-L1+ | 0.82 (0.45-1.55) | 0.56 |
| PD-1+ | 0.64 (0.35-1.22) | 0.17 |
| CD3+ | 0.61 (0.39-0.95) | 0.026 |
| Center | ||
| CD8+ | 0.05 (0.00-5.79) | 0.21 |
| PD-L1+ | 0.00 (0.00-7.96) | 0.15 |
| PD-1+ | 0.02 (0.00-30.73) | 0.31 |
| CD3+ | 1.00 (1.00-1.00) | 0.38 |
| Hotspot | ||
| CD8+ | 0.37 (0.16-0.79) | 0.011 |
| PD-L1+ | 0.85 (0.57-1.27) | 0.41 |
| PD-1+ | 0.73 (0.47-1.13) | 0.17 |
| CD3+ | 0.67 (0.47-0.95) | 0.018 |
NOTE: Values in bold indicate statistical significance.
Abbreviations: CL, confidence limit; MCPyV, Merkel cell polyomavirus.
HR calculated per 500 cells/mm2.
T-cell receptor sequencing in MCCs
To understand the impact of the T-cell infiltrate on MCCs, we sequenced the CDR3 region of the T-cell receptor (TCR) and analyzed TCR clonality and its relationship with MCPyV status in a series of 19 MCCs from our cohort (including 10 MCPyV+ and 9 MCPyV− lesions with a comparable density of T cells associated with the tumor). Clonality in the tumor associated T cells did not differ between MCPyV+ MCC compared with MCPyV− MCC (Fig. 3A), nor was there a relationship between clonality and the relative density of the T-cell infiltrate (Fig. 3B). However, when we compared the clonal T-cell relationships across the different lesions, we observed a higher clonal overlap among the MCPyV+ MCC samples compared with the MCPyV− MCC patient samples (Fig. 3C), suggesting an antigen-specific response in these tumors. Although we do not have data regarding the discrete antigenic specificity of these clones, these findings implicate a specific T-cell response against a unifying antigen in the MCPyV+ MCCs.
Figure 3.
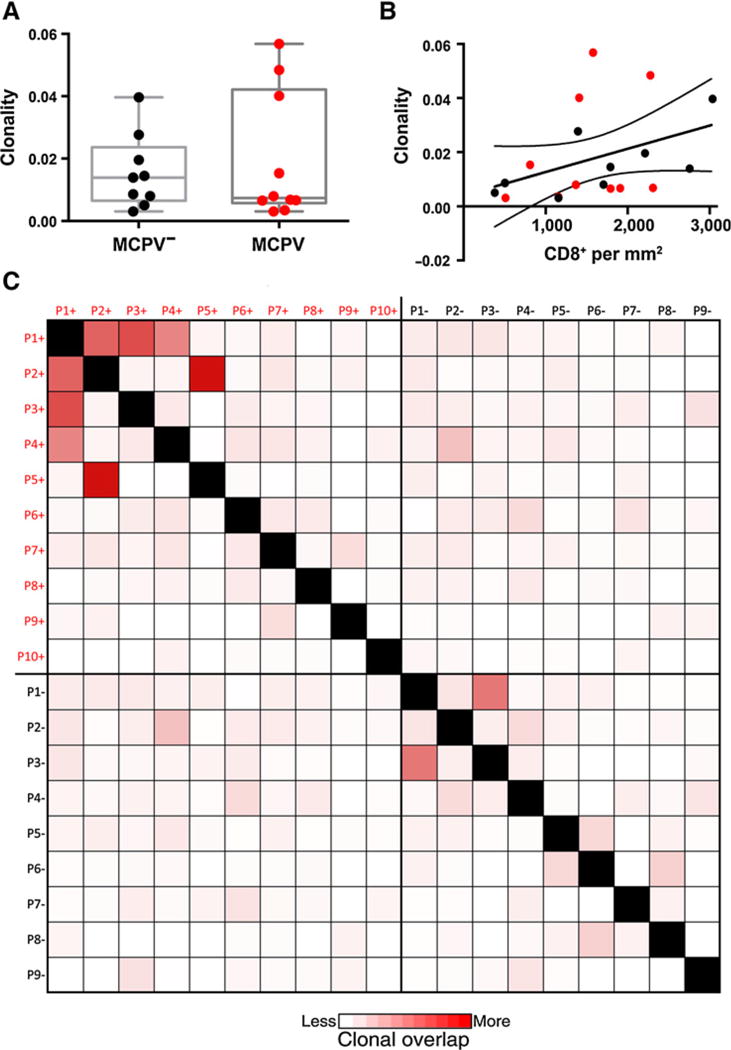
Clonality and clonal overlap of MCPyV + or − primary Merkel cell carcinomas. A, clonality of the tumor-infiltrating T cells in MCPyV+ (n = 10) or MCPyV− (n = 9) primary MCC. The bottom and top of the box represent the 25th and 75th percentile respectively for all patients, with the bar indicating the median value. B, positive correlation of (CD8+/mm2) IHC and clonality was assessed in MCC in which both analyses had been performed (n = 19). Red = MCPyV+ MCCs, Black = MCPyV− MCCs. C, heatmap demonstrates clonal overlap in primary MCC grouped according to MCPyV status. The lowest clonal overlap is represented by white with red being the highest clonal overlap between patients. Black boxes are used to block out all self-comparisons. Legend: P1+, Patient 1 MCPyV+; P2+, Patient 2 MCPyV+, etc; P1−, Patient 1 MCPyV− MCC; P2−, Patient2 MCPyV− MCC, etc.
Discussion
Here, we show the density of T cells at the tumor periphery correlates with metastasis and survival in MCC. In particular, the density of peripherally situated CD8+ T cells associates with DSS. Furthermore, the peripheral T-cell infiltrate is particularly impactful in MCPyV+ MCCs, where OS is exquisitely sensitive to increasing T-cell densities—a finding not seen in MCPyV− MCCs.
Prognosis in MCC is historically directed by the American Joint Committee on Cancer staging system, but this remains controversial because conclusive evidence that stage is the most rigorous surrogate of outcome for all patients is lacking (4, 6, 7, 25, 26). Additional biologically meaningful biomarkers predictive of clinical outcome in MCC have thus been investigated, but with similarly controversial and inconsistent conclusions (25, 27, 28). More recent efforts have implicated the tumor-associated immune cell infiltrate as a potentially robust indicator of clinical behavior in MCC (4, 26).
Paulson and colleagues were the first to demonstrate that increased expression of CD8+ cytotoxic T-cell genes (in particular, CD8A and granzyme genes) correlated with improved prognosis in a series of 35 MCCs (16). They further characterized CD8 expression in a series of 146 MCCs (including primary lesions, nodal, and distant metastases) and using a sliding scale to score CD8 positivity, showed that high “intratumoral CD8+ lymphocyte infiltration” (~60 CD8+ T cells or more per highpower field) independently correlated with outcome in univariate and multivariate analyses (16). Sihto and colleagues next performed immunohistochemical studies on 116 MCCs and showed that (i) immune infiltrate densities were higher in MCPyV+ than MCPyV− MCCs; (ii) increased tumor-associated CD3+ T cells significantly associated with longer survival irrespective of MCPyV status; (iii) increased tumor-associated CD3+ T cells significantly associated with survival in MCPyV− MCCs with a trend toward improved survival in MCPyV+ MCCs; (iv) MCPyV+ MCCs with low CD8+ T-cell counts associated with poor survival; and (v) in a multivariate analysis (including age, sex, MCPyV status, and the presence of lymph node metastasis), old age (HR = 1.07, P < 0.001), low tumor CD3+ T-cell count (HR = 1.87, P = 0.006), presence of nodal metastases (HR = 3.99, P < 0.001), and male sex (HR = 2.28, P = 0.001) associated with an increased risk of death (17).
Important limitations of these studies included the utilization of heterogeneous clinical lesions (primary and metastatic MCCs) and their reliance on a manual assessment of CD8+ T-cell density irrespective of the geographical relationship with the tumor (center vs. leading edge of the tumor). Our findings thus not only underscore, but also significantly extend the above observations. First, we applied automated image analysis to systematically tabulate the immune cell density (cells/mm2) and produce a precise and less subjective approximation of the immune infiltrate density. Second, we assessed primary MCCs exclusively. Previous studies assessing the immune infiltrate in MCC included a subset of metastatic MCCs in their cohort, but did not distinguish the properties of the immune infiltrate and its relationship to survival in metastatic MCC separately from primary MCC, nor did they compare the relationship of the immune infiltrate between matched primary and metastatic MCC (16). There is therefore a critical need to perform these studies in metastatic MCCs to determine what features of the immune infiltrate associate with clinical outcome in this clinical context. Finally, the geographic distribution of immune cell density, in the tumor periphery, center, and “hotspot,” was considered separately. Increased CD3+ and CD8+ T cells specifically at the tumor periphery significantly associated with OS: each increase of 500 CD3+ T cells/mm2 or CD8+ T cells/mm2 at the tumor periphery associates with a 36% or 48% reduction in the risk of death, respectively (Table 3). More importantly, each increase of 500 CD8+ T cells/mm2 at the tumor periphery associated with a 61% reduction in the likelihood of MCC-specific death (DSS; Table 3). In contrast, no correlation was determined between OS and the density or composition of the immune cells infiltrating the central portions of the tumor, suggesting that the leading edge of the tumor (where it interfaces with the stroma) represents the pivotal position for immune surveillance. An important limitation of this conclusion is that the small tumor size of some of the MCCs in our cohort reduced the number of lesions sufficiently large to delineate a nonoverlapping central area of the tumor, possibly compromising our statistical power to distinguish a difference for this parameter. Furthermore, while the immune infiltrate at the hotspot was often significant, the hotspot most commonly colocalized with the tumor periphery—a feature that likely underlies the statistical similarity between these two variables and covariates of survival and clinical outcome.
Nevertheless, the impact of the immune infiltrate at the tumor periphery on OS was amplified in MCPyV+ MCCs, where an increase of 500 CD3+ T cells/mm2 or CD8+ T cells/mm2 at the tumor periphery associated with a 39% or 77% reduction in the risk of death, respectively (Table 4). A similar effect was not detected in MCPyV− MCCs, and a significant difference in the relative densities of CD3+ or CD8+ T cells between MCPyV+ and MCPyV− MCCs was not detected in our cohort (Supplementary Table S8).
In contrast to these findings, Sihto and colleagues determined that the density of CD3+ T cells impacted the survival of MCPyV− MCCs but not MCPyV+ MCCs. Furthermore, Sihto and colleagues did observe a significant difference in the relative densities of CD3+ or CD8+ T cells between MCPyV+ and MCPyV— MCCs (17). In agreement with our findings, however, Sihto and colleagues correlated reduced CD8+ T-cell counts with poor survival in MCPyV+ MCCs, and in univariate analyses showed that MCPyV+ tumors with high CD3+ T-cell density were associated with the best overall prognosis. Many of the differences between our conclusions and those of Sihto and colleagues are likely explained by the different methods of determining MCPyV status (immunohistochemical detection of the MCPyVT-antigen in the current study compared with the more sensitive molecular approach to determine MCPyV status used by Sihto and colleagues); the different approaches to CD3 and CD8 quantification (automated vs. manual); and the impact of delineating the geographic distributions of these infiltrates in the MCC (peripheral vs. central) compared with an agnostic consideration of the distribution of immune cells in the tumor. Nevertheless, taken together, both studies confirm that a robust immune infiltrate at the MCC periphery positively impacts clinical course and survival, and the CD8+ component of the T-cell repertoire appears to be the central mediator of host defense, especially among MCPyV+ tumors. As our cohort consisted of fewer MCPyV− MCCs than MCpyV+ MCCs, it is also possible that our study was insufficiently powered to detect differences in this subgroup.
From an immunologic standpoint, MCPyV+ MCCs contain an indisputable population of true neoantigens (viral oncoproteins) that intuitively comprise a very robust target of the host immune defense system. However, prior studies have shown a significantly higher mutational burden in MCPyV− MCCs compared with MCPyV+ MCCs, which likely accounts in part for the relatively equal density of T cells in MCPyV+ compared with MCPyV− MCCs. However, to the extent that these T cells are responding to a bona fide neoantigen in MCPyV+ MCCs, it is biologically intuitive that the T-cell infiltrate might impact these lesions more robustly; the impact of the immune infiltrate on the neoantigens generated by the higher mutational burden observed in MCPyV− MCCs remains unclear (29). Our TCR sequencing results underscore this to a degree as the MCPyV+ MCCs showed higher clonal overlap with one another than MCPyV− MCCs, despite no differences in the relative frequency or density of T-cell clones between them. Further studies are necessary to validate this and to interrogate the antigen specificity conferred by these overlapping clones, although prior studies have demonstrated that MCPyV+ MCC-associated tumor-infiltrating T cells recognized the same tumor-associated peptides in primary and metastatic tumors (30). In addition, analysis of longitudinal MCC samples may help identify expansion of pre-existing clones in responding lesions as demonstrated in both targeted therapy and immune checkpoint in other solid tumors (31, 32).
An emerging paradigm in cancer therapy leverages the PD-1→PD-L1 axis in the immune system. PD-L1 is endogenously expressed by immune and stromal cells as an innate immune-inhibitory signal regulating the duration and intensity of inflammatory responses. T cells express PD-1, the primary receptor of PD-L1. When bound to PD-L1, PD-1 delivers T-cell–inhibitory signals to protect against excessive immune stimulation and collateral tissue injury (33, 34). Inhibitors of the PD-1→PD-L1 axis, including pembrolizumab and nivolumab (anti-PD-1), have produced durable responses in patients with treatment-refractory melanoma (35), non-small cell lung carcinoma (36), renal cell carcinoma (37), and Hodgkin lymphoma (38). These responses correlate in part with PD-L1 expression in the tumor cells themselves (39). More recently, a phase I trial of pembrolizumab demonstrated an approximate 80% response rate in patients with MCC, although as of yet, no correlative studies have been reported describing biomarkers that might be predictive of response (14). Only a few studies have explored PD-1 and PD-L1 expression in MCC (40, 41). Lipson and colleagues characterized MCPyV status and PD-L1 and CD3 expression in 67 MCCs from 49 patients and showed (i) variable expression of PD-L1 in MCC tumor cells (49% of cases) and tumor-infiltrating immune cells (55% of cases); (ii) PD-L1 expression in tumor cells correlated with a tumor-associated immune infiltrate with geographic colocalization of the PD-L1+ tumor cells and the immune infiltrate; (iii) MCPyV+ tumors tended to have PD-L1 positivity and at least a moderate to brisk infiltrate (50% of cases), whereas none of the MCPyV− MCCs was associated with a moderate to brisk infiltrate; and (iv) expression of PD-L1 in tumor cells correlated with improved overall survival (41). Afanasiev and colleagues characterized the T-cell repertoire from tumors and blood of MCC patients and demonstrated MCPyV-specific T cells in blood from MCC patients not evident in control populations. Furthermore, MCPyV-specific T cells fluctuated in direct correlation with MCC disease burden and expressed high levels of PD-1 in comparison with that seen in controls (40). We found weak correlations between the density of PD-L1+ cells at the tumor periphery and depth of MCC invasion and female sex. We also found an association between PD-1 expression and clinical outcome: an increased density of PD-1+ cells at the tumor periphery associated with a reduced risk of metastasis, in particular to visceral sites (corresponds to stage IV disease; Table 2). Furthermore, there was a trend towards improved OS with increased density of PD-1+ cells at the tumor periphery, although this did not achieve significance (P = 0.06; Table 3). We did not observe an association between the density of PD-L1+ cells and OS. In agreement with the prior studies, however, we determined that PD-L1 expression at the tumor periphery in MCPyV+ (median = 1129.4 cells/mm2) exceeded that seen in MCPyV− MCC (median = 308.7 cells/mm2; P = 0.0002). Together, while the significance of PD-L1 and PD-1 expression in MCC remains controversial increased expression of these apparently exerts a protective effect on various measures of clinical outcome (metastasis and/or survival) in MCC.
Taken together, our findings not only confirm the tumor-associated T-cell immune infiltrate at the tumor periphery as a robust prognostic indicator in MCC, but also provide mechanistic rationale to further examine whether the immune infiltrate at the tumor periphery is relevant as a biomarker of response in ongoing and future checkpoint inhibitor trials that seek to leverage the biologic effect of the host immune system in MCC treatment. Furthermore, the combined findings of this and prior studies provide support for the application of a modified “immunoscore” in MCC (42, 43). Whereas in colorectal cancer, for example, increased T cells at both the periphery and center of the tumor correlate with the most favorable outcomes, in MCC increased T cells at the leading edge confer a favorable prognosis. In addition, larger-scale studies are required to validate our findings and define the best cutoffs for reporting this prognostic indicator in MCC.
Supplementary Material
Translational Relevance.
Merkel cell carcinoma (MCC) is an aggressive cutaneous neuroendocrine carcinoma with frequent metastasis and death. Robust biomarkers predictive of clinical outcome are lacking, and few effective agents exist for MCC therapy. The emergence of immune checkpoint blockade therapies that mobilize antitumoral immunity provides a strong rationale to define the density, distribution, and composition of immune infiltrates in MCC to determine whether any of these impact clinical outcome and thus, could be reasonably leveraged in treatment strategies. Here, we performed systematic immune profiling for CD3, CD8, PD-1, and PD-L1 in a series of MCC with carefully annotated clinical outcomes and used automated image analysis to precisely quantify immune cell density at distinct tumor locations. We confirm a significant association between patient survival and the density of CD3+ and CD8+ T cells specifically at the tumor periphery. Together, our findings provide a robust biomarker to facilitate risk stratification and prognosis in MCC and additional rationale to deploy immune checkpoint inhibitors in MCC treatment.
Acknowledgments
Grant Support
This work was supported by a Swiss Cancer Research Foundation grant (BILKFS-3344-02-2014; to L. Feldmeyer).
Footnotes
Note: Supplementary data for this article are available at Clinical Cancer Research Online (http://clincancerres.aacrjournals.org/).
IRB Status: MD Anderson Cancer Center protocol ID #: LAB02-719.
Authors’ Contributions
Conception and design: L. Feldmeyer, V.G. Prieto, M.T. Tetzlaff
Development of methodology: C.W. Hudgens, J. Rodriguez-Canales, J.S. Ko, S.D. Billings, I.I. Wistuba, J.A. Wargo, M.T. Tetzlaff
Acquisition of data (provided animals, acquired and managed patients, provided facilities, etc.): L. Feldmeyer, C.W. Hudgens, J.L. Curry, B. Mino, P.-L. Chen, Z.A. Cooper, V.G. Prieto, J.A. Wargo, M.T. Tetzlaff
Analysis and interpretation of data (e.g., statistical analysis, biostatistics, computational analysis): L. Feldmeyer, C.W. Hudgens, G.R. Lyons, C.A. Torres Cabala, A. Reuben, P.-L. Chen, R.L. Bassett, Z.A. Cooper, J.A. Wargo, M.T. Tetzlaff
Writing, review, and/or revision of the manuscript: L. Feldmeyer, G.R. Lyons, P. Nagarajan, P.P. Aung, J.L. Curry, C.A. Torres Cabala, A. Reuben, J.S. Ko, S.D. Billings, R.L. Bassett, I.I. Wistuba, Z.A. Cooper, V.G. Prieto, J.A. Wargo, M.T. Tetzlaff
Administrative, technical, or material support (i.e., reporting or organizing data, constructing databases): J. Rodriguez-Canales, M.T. Tetzlaff
Study supervision: M.T. Tetzlaff
Disclosure of Potential Conflicts of Interest
No potential conflicts of interest were disclosed.
References
- 1.Hodgson NC. Merkel cell carcinoma: changing incidence trends. J Surg Oncol. 2005;89:1–4. doi: 10.1002/jso.20167. [DOI] [PubMed] [Google Scholar]
- 2.Fitzgerald TL, Dennis S, Kachare SD, Vohra NA, Wong JH, Zervos EE. Dramatic increase in the incidence and mortality from merkel cell carcinoma in the United States. Am Surg. 2015;81:802–6. doi: 10.1177/000313481508100819. [DOI] [PubMed] [Google Scholar]
- 3.Albores-Saavedra J, Batich K, Chable-Montero F, Sagy N, Schwartz AM, Henson DE. Merkel cell carcinoma demographics, morphology, and survival based on 3870 cases: a population based study. J Cutan Pathol. 2010;37:20–7. doi: 10.1111/j.1600-0560.2009.01370.x. [DOI] [PubMed] [Google Scholar]
- 4.Andea AA, Coit DG, Amin B, Busam KJ. Merkel cell carcinoma: histologic features and prognosis. Cancer. 2008;113:2549–58. doi: 10.1002/cncr.23874. [DOI] [PubMed] [Google Scholar]
- 5.Engels EA, Frisch M, Goedert JJ, Biggar RJ, Miller RW. Merkel cell carcinoma and HIV infection. Lancet. 2002;359:497–8. doi: 10.1016/S0140-6736(02)07668-7. [DOI] [PubMed] [Google Scholar]
- 6.Guler-Nizam E, Leiter U, Metzler G, Breuninger H, Garbe C, Eigentler TK. Clinical course and prognostic factors of Merkel cell carcinoma of the skin. Br J Dermatol. 2009;161:90–4. doi: 10.1111/j.1365-2133.2009.09155.x. [DOI] [PubMed] [Google Scholar]
- 7.Tarantola TI, Vallow LA, Halyard MY, Weenig RH, Warschaw KE, Grotz TE, et al. Prognostic factors in Merkel cell carcinoma: analysis of 240 cases. J Am Acad Dermatol. 2013;68:425–32. doi: 10.1016/j.jaad.2012.09.036. [DOI] [PubMed] [Google Scholar]
- 8.Warner CL, Cockerell CJ. The new seventh edition American Joint Committee on Cancerstaging of cutaneous non-melanoma skin cancer: a critical review. Am J Clin Dermatol. 2011;12:147–54. doi: 10.2165/11539420-000000000-00000. [DOI] [PubMed] [Google Scholar]
- 9.Feng H, Shuda M, Chang Y, Moore PS. Clonal integration of a polyomavirus in human Merkel cell carcinoma. Science. 2008;319:1096–100. doi: 10.1126/science.1152586. [DOI] [PMC free article] [PubMed] [Google Scholar]
- 10.Fleming KE, Ly TY, Pasternak S, Godlewski M, Doucette S, Walsh NM. Support for p63 expression as an adverse prognostic marker in Merkel cell carcinoma: report on a Canadian cohort. Hum Pathol. 2014;45:952–60. doi: 10.1016/j.humpath.2013.12.008. [DOI] [PubMed] [Google Scholar]
- 11.Skelton HG, Smith KJ, Hitchcock CL, McCarthy WF, Lupton GP, Graham JH. Merkel cell carcinoma: analysis of clinical, histologic, and immunohistologic features of 132 cases with relation to survival. J Am Acad Dermatol. 1997;37:734–9. doi: 10.1016/s0190-9622(97)70110-5. [DOI] [PubMed] [Google Scholar]
- 12.McAfee WJ, Morris CG, Mendenhall CM, Werning JW, Mendenhall NP, Mendenhall WM. Merkel cell carcinoma: treatment and outcomes. Cancer. 2005;104:1761–4. doi: 10.1002/cncr.21355. [DOI] [PubMed] [Google Scholar]
- 13.Paulson KG, Iyer JG, Blom A, Warton EM, Sokil M, Yelistratova L, et al. Systemic immune suppression predicts diminished Merkel cell carcinoma-specific survival independent of stage. J Invest Dermatol. 2013;133:642–6. doi: 10.1038/jid.2012.388. [DOI] [PMC free article] [PubMed] [Google Scholar]
- 14.Nghiem P, Bhatia S, Daud A, Friedlander P, Kluger H, Kohort H, et al. Activity of PD-1 blockade with pembrolizumab as first systemic therapy in patients with advanced Merkel cell carcinoma [abstract]. Proceedings of the European Cancer Congress; 2015 Sep 25–29; Vienna, Austria. Brussels, Belgium: ESMO; 2015. Abstract nr 22LBA. [Google Scholar]
- 15.Paulson KG, Iyer JG, Simonson WT, Blom A, Thibodeau RM, Schmidt M, et al. CD8+ lymphocyte intratumoral infiltration as a stage-independent predictor of Merkel cell carcinoma survival: a population-based study. Am J Clin Pathol. 2014;142:452–8. doi: 10.1309/AJCPIKDZM39CRPNC. [DOI] [PMC free article] [PubMed] [Google Scholar]
- 16.Paulson KG, Iyer JG, Tegeder AR, Thibodeau R, Schelter J, Koba S, et al. Transcriptome-wide studies of merkel cell carcinoma and validation of intratumoral CD8+ lymphocyte invasion as an independent predictor of survival. J Clin Oncol. 2011;29:1539–46. doi: 10.1200/JCO.2010.30.6308. [DOI] [PMC free article] [PubMed] [Google Scholar]
- 17.Sihto H, Bohling T, Kavola H, Koljonen V, Salmi M, Jalkanen S, et al. Tumor infiltrating immune cells and outcome of Merkel cell carcinoma: a population-based study. Clin Cancer Res. 2012;18:2872–81. doi: 10.1158/1078-0432.CCR-11-3020. [DOI] [PubMed] [Google Scholar]
- 18.Chapuis AG, Afanasiev OK, Iyer JG, Paulson KG, Parvathaneni U, Hwang JH, et al. Regression of metastatic Merkel cell carcinoma following transfer of polyomavirus-specificT cells and therapies capable of re-inducing HLA class-I. Cancer Immunol Res. 2014;2:27–36. doi: 10.1158/2326-6066.CIR-13-0087. [DOI] [PMC free article] [PubMed] [Google Scholar]
- 19.Pulitzer MP, Brannon AR, Berger MF, Louis P, Scott SN, Jungbluth AA, et al. Cutaneous squamous and neuroendocrine carcinoma: genetically and immunohistochemically different from Merkel cell carcinoma. Mod Pathol. 2015;28:1023–32. doi: 10.1038/modpathol.2015.60. [DOI] [PMC free article] [PubMed] [Google Scholar]
- 20.Lou Y, Diao L, Parra Cuentas ER, Denning WL, Chen L, Fan YH, et al. Epithelial-mesenchymal transition is associated with a distinct tumor microenvironment including elevation of inflammatory signals and multiple immune checkpoints in lung adenocarcinoma. Clin Cancer Res. 2016 Feb 5; doi: 10.1158/1078-0432.CCR-15-1434. [Epub ahead of print] [DOI] [PMC free article] [PubMed] [Google Scholar]
- 21.Sihto H, Kukko H, Koljonen V, Sankila R, Bohling T, Joensuu H. Merkel cell polyomavirus infection, large T antigen, retinoblastoma protein and outcome in Merkel cell carcinoma. Clin Cancer Res. 2011;17:4806–13. doi: 10.1158/1078-0432.CCR-10-3363. [DOI] [PubMed] [Google Scholar]
- 22.Carlson CS, Emerson RO, Sherwood AM, Desmarais C, Chung MW, Parsons JM, et al. Using synthetic templates to design an unbiased multiplex PCR assay. Nat Commun. 2013;4:2680. doi: 10.1038/ncomms3680. [DOI] [PubMed] [Google Scholar]
- 23.Robins HS, Srivastava SK, Campregher PV, Turtle CJ, Andriesen J, Riddell SR, et al. Overlap and effective size of the human CD8+ T cell receptor repertoire. Sci Transl Med. 2010;2:47ra64. doi: 10.1126/scitranslmed.3001442. [DOI] [PMC free article] [PubMed] [Google Scholar]
- 24.Sihto H, Kukko H, Koljonen V, Sankila R, Bohling T, Joensuu H. Clinical factors associated with Merkel cell polyomavirus infection in Merkel cell carcinoma. J Natl Cancer Inst. 2009;101:938–45. doi: 10.1093/jnci/djp139. [DOI] [PubMed] [Google Scholar]
- 25.Lim CS, Whalley D, Haydu LE, Murali R, Tippett J, Thompson JF, et al. Increasing tumor thickness is associated with recurrence and poorer survival in patients with Merkel cell carcinoma. Ann Surg Oncol. 2012;19:3325–34. doi: 10.1245/s10434-012-2509-x. [DOI] [PubMed] [Google Scholar]
- 26.Mott RT, Smoller BR, Morgan MB. Merkel cell carcinoma: a clinicopathologic study with prognostic implications. J Cutan Pathol. 2004;31:217–23. doi: 10.1111/j.0303-6987.2004.00149.x. [DOI] [PubMed] [Google Scholar]
- 27.Asioli S, Righi A, de Biase D, Morandi L, Caliendo V, Picciotto F, et al. Expression of p63 is the sole independent marker of aggressiveness in localised (stage I–II) Merkel cell carcinomas. Mod Pathol. 2011;24:1451–61. doi: 10.1038/modpathol.2011.100. [DOI] [PubMed] [Google Scholar]
- 28.Asioli S, Righi A, Volante M, Eusebi V, Bussolati G. p63 expression as a new prognostic marker in Merkel cell carcinoma. Cancer. 2007;110:640–7. doi: 10.1002/cncr.22828. [DOI] [PubMed] [Google Scholar]
- 29.Goh G, Walradt T, Markarov V, Blom A, Riaz N, Doumani R, et al. Mutational landscape of MCPyV-positive and MCPyV-negative Merkel cell carcinomas with implications for immunotherapy. Oncotarget. 2016;7:3403–15. doi: 10.18632/oncotarget.6494. [DOI] [PMC free article] [PubMed] [Google Scholar]
- 30.Iyer JG, Afanasiev OK, McClurkan C, Paulson K, Nagase K, Jing L, et al. Merkel cell polyomavirus-specific CD8(+) and CD4(+) T-cell responses identified in Merkel cell carcinomas and blood. Clin Cancer Res. 2011;17:6671–80. doi: 10.1158/1078-0432.CCR-11-1513. [DOI] [PMC free article] [PubMed] [Google Scholar]
- 31.Cooper ZA, Frederick DT, Juneja VR, Sullivan RJ, Lawrence DP, Piris A, et al. BRAF inhibition is associated with increased clonality in tumor-infiltrating lymphocytes. Oncoimmunology. 2013;2:e26615. doi: 10.4161/onci.26615. [DOI] [PMC free article] [PubMed] [Google Scholar]
- 32.Tumeh PC, Harview CL, Yearley JH, Shintaku IP, Taylor EJ, Robert L, et al. PD-1 blockade induces responses by inhibiting adaptive immune resistance. Nature. 2014;515:568–71. doi: 10.1038/nature13954. [DOI] [PMC free article] [PubMed] [Google Scholar]
- 33.Butte MJ, Keir ME, Phamduy TB, Sharpe AH, Freeman GJ. Programmed death-1 ligand 1 interacts specifically with the B7-1 costimulatory molecule to inhibit T cell responses. Immunity. 2007;27:111–22. doi: 10.1016/j.immuni.2007.05.016. [DOI] [PMC free article] [PubMed] [Google Scholar]
- 34.Chen L. Co-inhibitory molecules of the B7-CD28 family in the control of T-cell immunity. Nat Rev Immunol. 2004;4:336–47. doi: 10.1038/nri1349. [DOI] [PubMed] [Google Scholar]
- 35.Metcalfe W, Anderson J, Trinh VA, Hwu WJ. Anti-programmed cell death-1 (PD-1) monoclonal antibodies in treating advanced melanoma. Discov Med. 2015;19:393–401. [PubMed] [Google Scholar]
- 36.Romero D. Lung cancer: nivolumab-an effective second-line treatment for NSCLC. Nat Rev Clin Oncol. 2015;12:685. doi: 10.1038/nrclinonc.2015.184. [DOI] [PubMed] [Google Scholar]
- 37.Motzer RJ, Escudier B, McDermott DF, George S, Hammers HJ, Srinivas S, et al. Nivolumab versus everolimus in advanced renal-cell carcinoma. N Engl J Med. 2015;373:1803–13. doi: 10.1056/NEJMoa1510665. [DOI] [PMC free article] [PubMed] [Google Scholar]
- 38.Ansell SM, Lesokhin AM, Borrello I, Halwani A, Scott EC, Gutierrez M, et al. PD-1 blockade with nivolumab in relapsed or refractory Hodgkin’s lymphoma. N Engl J Med. 2015;372:311–9. doi: 10.1056/NEJMoa1411087. [DOI] [PMC free article] [PubMed] [Google Scholar]
- 39.Topalian SL, Hodi FS, Brahmer JR, Gettinger SN, Smith DC, McDermott DF, et al. Safety, activity, and immune correlates of anti-PD-1 antibody in cancer. N Engl J Med. 2012;366:2443–54. doi: 10.1056/NEJMoa1200690. [DOI] [PMC free article] [PubMed] [Google Scholar]
- 40.Afanasiev OK, Yelistratova L, Miller N, Nagase K, Paulson K, Iyer JG, et al. Merkel polyomavirus-specific T cells fluctuate with merkel cell carcinoma burden and express therapeutically targetable PD-1 and Tim-3 exhaustion markers. Clin Cancer Res. 2013;19:5351–60. doi: 10.1158/1078-0432.CCR-13-0035. [DOI] [PMC free article] [PubMed] [Google Scholar]
- 41.Lipson EJ, Vincent JG, Loyo M, Kagohara LT, Luber BS, Wang H, et al. PD-L1 expression in the Merkel cell carcinoma microenvironment: association with inflammation, Merkel cell polyomavirus and overall survival. Cancer Immunol Res. 2013;1:54–63. doi: 10.1158/2326-6066.CIR-13-0034. [DOI] [PMC free article] [PubMed] [Google Scholar]
- 42.Galon J, Costes A, Sanchez-Cabo F, Kirilovsky A, Mlecnik B, Lagorce-Pages C, et al. Type, density, and location of immune cells within human colorectal tumors predict clinical outcome. Science. 2006;313:1960–4. doi: 10.1126/science.1129139. [DOI] [PubMed] [Google Scholar]
- 43.Galon J, Mlecnik B, Bindea G, Angell HK, Berger A, Lagorce C, et al. Towards the introduction of the ‘Immunoscore’ in the classification of malignant tumours. J Pathol. 2014;232:199–209. doi: 10.1002/path.4287. [DOI] [PMC free article] [PubMed] [Google Scholar]
Associated Data
This section collects any data citations, data availability statements, or supplementary materials included in this article.