Abstract
Background
The plantar cerebriform connective tissue nevus (CCTN) is the most common and problematic cutaneous manifestation of Proteus syndrome.
Objective
To gain insights into CCTN pathogenesis and natural history.
Methods
The size and location of plantar CCTN was measured on 152 images from 22 individuals with Proteus syndrome by two independent, blinded reviewers. Average measures of plantar CCTN were transformed into a linear mixed model to estimate proportionate change in size with age.
Results
Median patient age was 6.9 years at study onset. The intraclass correlation coefficient between two blinded reviewers was 0.946 for CCTN single measures. The CCTN relative area increased with age in children (n=18, p<.0001) by 5.6% per year. Confluent papules and nodules extending beyond the boundaries of CCTNs were gradually replaced by typical CCTN over time. The location of CCTN in different individuals overlapped near the ball of the foot. A positive relationship between CCTN growth rate and AKT1 mutant allele frequency was observed (.62, p=0.10, n=8).
Limitations
This was a retrospective review using photographs.
Conclusion
CCTN growth is affected by age, and extent of the CCTN precursor lesion. Monitoring of CCTN size may prove useful for evaluating drug response in the treatment of Proteus syndrome.
Keywords: cerebriform connective tissue nevus, overgrowth, Proteus syndrome, children, AKT1, natural history
Proteus syndrome is characterized by progressive, segmental overgrowth of the skin, subcutis, and other organs secondary to a mosaic activating mutation in AKT1.1, 2 The plantar cerebriform connective tissue nevus (CCTN) is the most specific cutaneous manifestation of Proteus syndrome.3-5 While not present at birth, plantar CCTNs generally manifest and grow during childhood.3, 4
An activating mutation in the AKT1 oncogene is considered to be lethal in the germline; individuals with Proteus syndrome survive with a somatic c.49G>A, p.(Glu17Lys) activating mutation in AKT1 that results in a mixture of mutant and normal cells.2, 6 The relative numbers and locations of cells bearing the AKT1 mutation, as well as the specific cellular lineages involved, are hypothesized to result in the heterogeneous abnormalities and apparently random and variable regions of body overgrowth.2, 7-9 For example, mutant keratinocytes are found in epidermal nevi but not in CCTNs or unaffected skin in Proteus syndrome, suggesting that mutant keratinocytes generate epidermal nevi.10 Mutant fibroblasts are observed in CCTNs as might be expected, but are also observed in variable numbers in unaffected skin and epidermal nevi, suggesting that the presence of mutant fibroblasts is necessary, but not sufficient, to drive CCTN formation.10
In a previous study assessing the growth of several Proteus-related skin lesions, we found that CCTNs increased in size during childhood.3 The method used for assessing CCTN growth was semi-quantitative and did not allow accurate prediction of CCTN growth, nor was it sufficient to reproducibly detect small changes as would be advantageous for monitoring CCTN size as an endpoint for therapeutic trials. In this study, we sought to create an image analysis process that would permit simple and reliable assessment of the size and location of plantar CCTNs to describe their growth patterns and natural history, and to correlate these observations with relative numbers of mutant cells.
Materials and Methods
Patients
Patients were recruited for studies of Proteus syndrome at the National Institutes of Health Clinical Center in Bethesda, Maryland between 1997 and 2014, under an IRB-approved protocol 94-HG-0132 NCT00001403. A retrospective review of patient medical charts, including skin photography, was performed. Patients who met clinical criteria for a diagnosis of Proteus syndrome11 and had two or more serial images of at least one sole were included in this study. A blinded database of images from each patient was created by concealing the chronological order of the images while keeping those from the same patient together. The same two blinded reviewers used this database to measure all variables described below.
Image analysis system
To map Proteus-related skin abnormalities on the plantar surface, the entire visible area of the sole, the total lesional area, and CCTN were measured for each foot using ImageJ software (version 1.48 for Mac OS X; available as a free download from (http://rsb.info.nih.gov/ij/download.html). The entire sole was defined as the area of the sole, excluding the toes, and included the outline of any plantar CCTNs. The total lesional area was defined as the space encompassing CCTN and non-cerebriform, confluent papules and nodules. The CCTN was defined as a nevus with at least two gyri and three sulci. The relative size of the CCTN and total lesional area were calculated by dividing each by the entire area of the sole of the foot. These areas were measured on the left and right soles of each patient by both reviewers and intraclass correlation coefficients (ICC) were calculated to determine the degree of reviewer agreement. The ICC model is based on absolute agreement and assumes that both reviewers and patients are random.
Growth Patterns
Using data generated from the photographic analyses, a linear mixed model was created using SPSS software (IBM Corp. Released 2013. IBM SPSS Statistics for Windows, Version 22.0. Armonk, NY: IBM Corp.) to estimate proportionate change of total lesional area and CCTN with age. Adults (at least 18 years of age at study onset) and children (less than 18 years) were separated in this study as we previously observed an age-dependent difference in growth.3 Each proportion was transformed into the logit, or the natural log of the proportion over one minus the proportion, then changed back to a proportion to facilitate graphic depiction. The maximum proportion value was limited to .99 and any proportions of “0” were removed from the model. The mixed model accounts for repeated measures within subjects by including a random intercept and slope over time for each foot.
To estimate annual CCTN growth rate, percent change in relative size of each CCTN between interval visits was calculated then divided by the corresponding change in age. The average yearly change was then derived using a mixed model with a random effect for each sole to account for multiple measures.
To assess for a relationship between allelic frequency and CCTN growth rate, a retrospective review of patients that underwent mutational analysis of their plantar CCTNs for diagnostic or research purposes was performed. Briefly, plantar CCTNs were biopsied and fibroblasts were cultured from samples followed by DNA extraction or DNA was extracted directly as described.2 To determine the CCTN growth rate, a slope was estimated for each CCTN using the logit and total time followed. Spearman's rank correlation coefficient was calculated to measure statistical dependence of CCTN rate of growth on mutant allele frequency. To determine the center of CCTN overlap, CCTNs that occupied 20% or less of the sole on initial imaging (arbitrarily selected as a cut-off to reflect origination site) were identified and plotted with respect to size and location onto outlines of their respective sole.
Results
Twenty-two patients (13 male, 9 female) with two or more sequential photographs of at least one sole were identified. Eighteen patients were children (<18; median age 6.3; range 1.5-12) and four were adults (≥18; median age 31; range 18-41) at study onset. All patients had non-cerebriform confluent papules and nodules on both soles on baseline examination. Nineteen patients (15 children, 4 adults) had CCTNs on baseline examination; of these, seven (6 children, 1 adult) had CCTNs on both soles and twelve had CCTNs on one sole only. Three children lacked CCTNs on baseline examination.
The CCTN and total lesional area (Fig 1) were measured on a total of 152 images from 22 patients (median age 6.9 at study onset, range 1.5- 41). The ICC between reviewers was 0.946 for CCTN single measures and 0.709 for total lesional area single measures.
Figure 1.
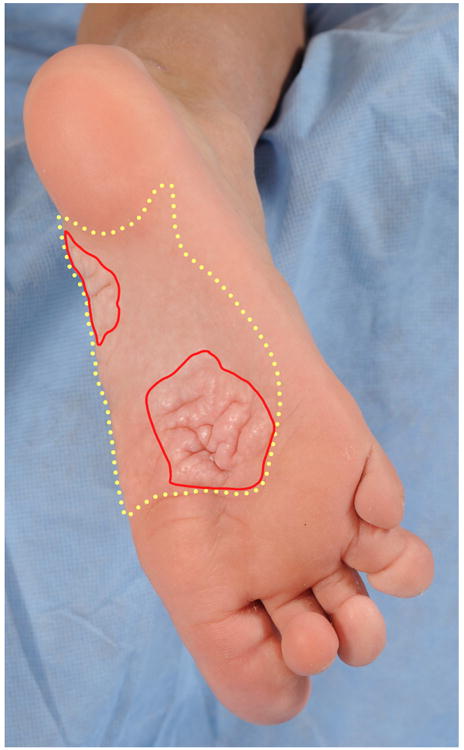
Proteus syndrome. Acral manifestations. Total lesional area (yellow dashed line) including cerebriform connective tissue nevus (CCTN) (red solid line) and non-cerebriform, confluent papules and nodules.
Using a mixed linear regression model, the proportion of CCTN to sole of foot increased with age in children (p<.0001) (Fig 2). The proportion of non-cerebriform confluent papules and nodules, calculated by subtracting CCTN from total lesional area, appeared to decrease with age in children (p=0.09) (Fig 3a,b), while total lesional area increased with age in children (p<.0001) (Fig 3c). These analyses were not significant in adults (p=0.76; p=0.72, p=0.95).
Figure 2.
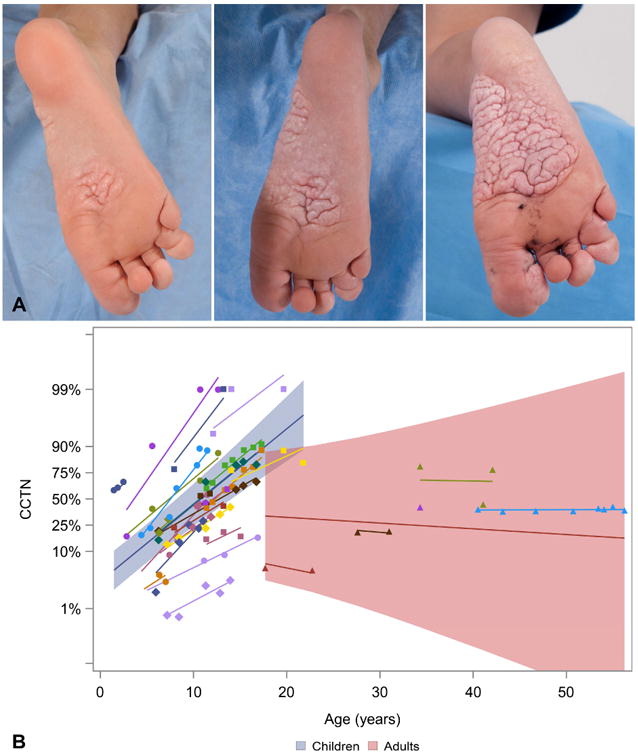
Proteus syndrome. The cerebriform connective tissue nevus (CCTN) size increased with age. A, Increase in CCTN from age 8 to age 10 years. B, The proportion of CCTN to sole increased with age in children (blue shading) (p<.0001) but not in adults (red shading).
Figure 3.
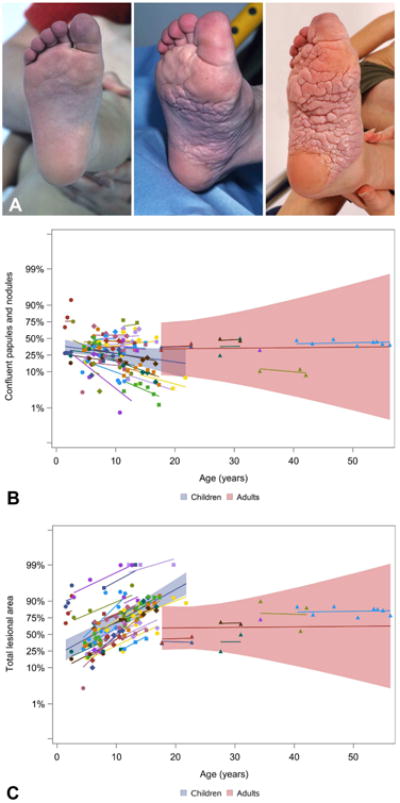
Proteus syndrome. Confluent papules and nodules are a cerebriform connective tissue nevus (CCTN) precursor lesion. A, Confluent papules and nodules cover the majority of the sole at baseline, then eventually become replaced by CCTN over time. B, The confluent papules and nodules decreased with age, most prominently in younger individuals. C, The concurrent increase in total lesional area (p<.0001 in children) suggests conversion into CCTN.
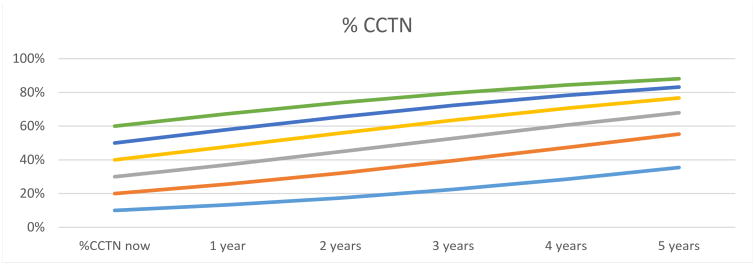
Using data from 18 children, an approximation of future CCTN size was modeled based on current CCTN size and time in one-year intervals up to five years (Fig 4). CCTNs increased by 5.6% per year (95% CI [3.7, 7.6]). The model of CCTN growth rate predicts that a CCTN involving about 20% of the sole will increase to nearly 50% over a five-year period.
Figure 4.
Proteus syndrome. Prediction of future cerebriform connective tissue nevus (CCTN) size. Composite longitudinal data from children was used to estimate the expected annual increase in size of a CCTN based on present proportion of CCTN to the sole.
To determine the relationship between growth rate and relative number of mutant cells, we analyzed mutant allele frequency from cells grown from a single biopsy generally obtained at the non-weight bearing margin of a CCTN. Eight patients were identified that underwent plantar CCTN biopsy and subsequent mutational analysis. A positive relationship between CCTN growth rate and mutant allele frequency was observed (0.62, p=0.10) (Fig 5).
Figure 5.
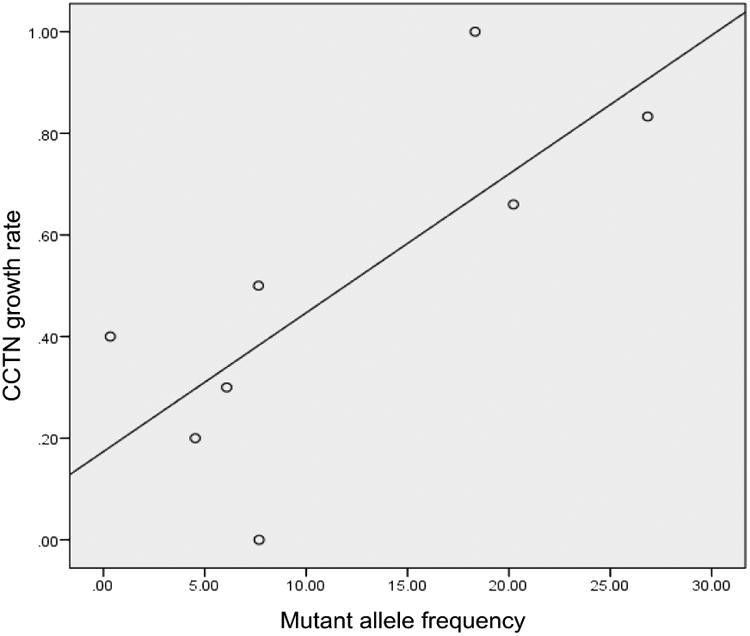
Proteus syndrome. Relationship between mutant allele frequency and cerebriform connective tissue nevus growth rate in children. Each data point represents one patient and a nominally positive correlation is shown (r=.62, p=0.10).
The CCTNs from 14 patients that occupied 20% of less on the sole on initial imaging were plotted with respect to size and location onto silhouettes of the right and left soles. Nearly all CCTNs overlapped just proximal to the ball of the foot bilaterally (Fig 6).
Figure 6.
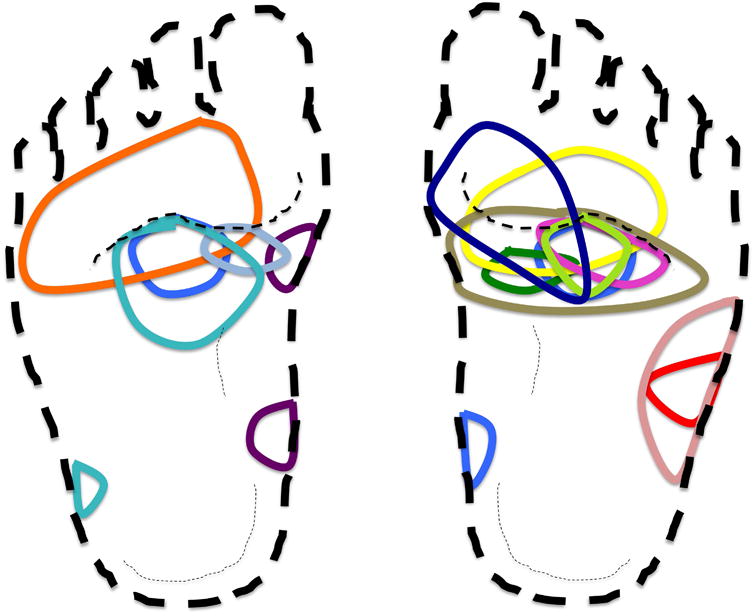
Proteus syndrome. The center of cerebriform connective tissue nevus (CCTN) overlapped in pediatric patients. Each child with a CCTN that occupied 20% or less of the sole on initial image was assigned a unique color. The area proximal to the ball of the foot appears to be the point of convergence of the center of most CCTNs. We hypothesize that mechanical stress from pressure or stretch is a contributing factor in lesion formation.
Discussion
The image analysis system created to describe growth patterns in this study was a reliable tool to measure relative size of plantar CCTNs and total lesional area over time. Useful features of this system include retrospective analysis of accrued images, remote evaluation by multiple observers, and the ability to mask the temporal order of images. We found that the relative size of the plantar CCTN to the sole of foot significantly increased in children by 5.6% per year. The non-cerebriform, confluent papules and nodules progressed into fully developed CCTN over time, as supported by clinical observation and a relative decrease in size of this skin finding. Thus, the extent of non-cerebriform, abnormal-appearing skin, in conjunction with current CCTN size, may help predict rate of growth and eventual extent of CCTN in a child with Proteus syndrome.
In mosaic skin disorders, the distribution of lesions is expected to be random, albeit following known patterns of development, such as the lines of Blaschko for an epidermal nevus.7 Instead, mapping supported non-random distribution of CCTNs on the soles, since CCTNs from fourteen children appeared to overlap near the ball of the foot. One possible explanation for frequent CCTN formation in this region is that mechanical stresses from walking and running stimulates overgrowth. Children with Proteus syndrome may have genu valgum,12 which places stress on the medial plantar fascia just proximal to the ball of the foot,13 where most of the CCTNs appear to originate. A potential role for stress is supported by in vitro studies that have shown that mechanical strain may activate Akt.14 Additional studies are necessary to confirm this speculation.
There was a non-significant trend towards faster rates of CCTN growth in patients with a greater fraction of AKT1 mutant cells in the dermis. A prior study did not find a correlation of either gross or microscopic pathology with tissue mutant allele frequency in a single patient.15 In this study, we correlated samples from a single tissue type in the same anatomic location across multiple patients, which may account for our positive result, although larger sample sizes are needed to confirm our findings.
Limitations of this study include inability to quantify the thickness of the CCTN using our image analysis method, and measurement of relative versus absolute CCTN size that did not account for growth of the foot, which grows most during childhood. Nonetheless, this methodology shows that CCTNs outgrow foot growth in childhood and often eventually involve most of the sole. It is possible that the apparent lack of growth of CCTNs in adults may have missed subtle changes in thickness or new lesions on the toes, as reported by one individual. Further, predictions of interval percent change of CCTN were extrapolated from models that directly measured patient age, rather than CCTN size, against lesion growth. The range of age was broad, but separate analyses between adults and children helped to discern distinct growth patterns in each subset.
The progression of the plantar CCTN and its associated morbidities make this lesion a potential focus of drug trials targeting the causative somatic mutation in AKT1. Our results indicate that analyses of serial images would be useful and reliable for measuring changes in plantar CCTNs and for assessing treatment response. The growth patterns described in this study may also help to direct selection of patients best suited for assessing effects of treatment on CCTN growth. A therapeutic trial using the AKT1 inhibitor ARQ 092 is underway (NCT02594215).
Acknowledgments
The authors thank the NIH medical photographers and the individuals who generously gave their time to be in the study. This study was supported by the Intramural Research Program of the National Human Genome Research Institute, grant number HG200388-03.
This study was approved by IRB protocol 94-HG-0132 (Continuing Review approved 8/2016).
Financial support: This research was supported by the Intramural Research Program of the National Human Genome Research Institute, project 1 ZIA HG200388 03. N.N. was supported by a Doris Duke Charitable Foundation Clinical Research Mentorship Award 2014088.
Abbreviations
- CCTN
cerebriform connective tissue nevus
- ICC
intraclass correlation coefficients
- CI
confidence interval
Footnotes
Conflicts of interest or financial disclosures: None declared.
Statement on prior presentation: Parts of this work were presented at the Society for Pediatric Dermatology Conference in Boston, MA, July 9-12, 2015.
Publisher's Disclaimer: This is a PDF file of an unedited manuscript that has been accepted for publication. As a service to our customers we are providing this early version of the manuscript. The manuscript will undergo copyediting, typesetting, and review of the resulting proof before it is published in its final citable form. Please note that during the production process errors may be discovered which could affect the content, and all legal disclaimers that apply to the journal pertain.
References
- 1.Biesecker LG, Happle R, Mulliken JB, Weksberg R, Graham JM, Jr, Viljoen DL, et al. Proteus syndrome: diagnostic criteria, differential diagnosis, and patient evaluation. Am J Med Genet. 1999;84:389–95. doi: 10.1002/(sici)1096-8628(19990611)84:5<389::aid-ajmg1>3.0.co;2-o. [DOI] [PubMed] [Google Scholar]
- 2.Lindhurst MJ, Sapp JC, Teer JK, Johnston JJ, Finn EM, Peters K, et al. A mosaic activating mutation in AKT1 associated with the Proteus syndrome. N Engl J Med. 2011;365:611–9. doi: 10.1056/NEJMoa1104017. [DOI] [PMC free article] [PubMed] [Google Scholar]
- 3.Beachkofsky TM, Sapp JC, Biesecker LG, Darling TN. Progressive overgrowth of the cerebriform connective tissue nevus in patients with Proteus syndrome. J Am Acad Dermatol. 2010;63:799–804. doi: 10.1016/j.jaad.2009.12.012. [DOI] [PMC free article] [PubMed] [Google Scholar]
- 4.Twede JV, Turner JT, Biesecker LG, Darling TN. Evolution of skin lesions in Proteus syndrome. J Am Acad Dermatol. 2005;52:834–8. doi: 10.1016/j.jaad.2004.12.047. [DOI] [PubMed] [Google Scholar]
- 5.Nguyen D, Turner JT, Olsen C, Biesecker LG, Darling TN. Cutaneous manifestations of proteus syndrome: correlations with general clinical severity. Arch Dermatol. 2004;140:947–53. doi: 10.1001/archderm.140.8.947. [DOI] [PubMed] [Google Scholar]
- 6.Biesecker LG, Spinner NB. A genomic view of mosaicism and human disease. Nat Rev Genet. 2013;14:307–20. doi: 10.1038/nrg3424. [DOI] [PubMed] [Google Scholar]
- 7.Happle R. The categories of cutaneous mosaicism: A proposed classification. Am J Med Genet A. 2016;170:452–9. doi: 10.1002/ajmg.a.37439. [DOI] [PubMed] [Google Scholar]
- 8.Happle R. Mosaicism in human skin. Understanding the patterns and mechanisms. Arch Dermatol. 1993;129:1460–70. [PubMed] [Google Scholar]
- 9.Nathan N, Keppler-Noreuil KM, Biesecker LG, Moss J, Darling TN. Mosaic Disorders of the PI3K/PTEN/AKT/TSC/mTORC1 Signaling Pathway. Dermatol Clin. 2017;35:51–60. doi: 10.1016/j.det.2016.07.001. [DOI] [PMC free article] [PubMed] [Google Scholar]
- 10.Lindhurst MJ, Wang JA, Bloomhardt HM, Witkowski AM, Singh LN, Bick DP, et al. AKT1 gene mutation levels are correlated with the type of dermatologic lesions in patients with Proteus syndrome. J Invest Dermatol. 2014;134:543–6. doi: 10.1038/jid.2013.312. [DOI] [PMC free article] [PubMed] [Google Scholar]
- 11.Biesecker LG, Sapp JC. Proteus Syndrome. In: Pagon RA, Adam MP, Ardinger HH, Wallace SE, Amemiya A, Bean LJH, et al., editors. GeneReviews(R) Seattle (WA): 1993. [Google Scholar]
- 12.Stricker S. Musculoskeletal manifestations of Proteus syndrome: report of two cases with literature review. J Pediatr Orthop. 1992;12:667–74. [PubMed] [Google Scholar]
- 13.Van Gheluwe B, Kirby KA, Hagman F. Effects of simulated genu valgum and genu varum on ground reaction forces and subtalar joint function during gait. J Am Podiatr Med Assoc. 2005;95:531–41. doi: 10.7547/0950531. [DOI] [PubMed] [Google Scholar]
- 14.Krepinsky JC, Li Y, Chang Y, Liu L, Peng F, Wu D, et al. Akt mediates mechanical strain-induced collagen production by mesangial cells. J Am Soc Nephrol. 2005;16:1661–72. doi: 10.1681/ASN.2004100897. [DOI] [PubMed] [Google Scholar]
- 15.Doucet ME, Bloomhardt HM, Moroz K, Lindhurst MJ, Biesecker LG. Lack of mutation-histopathology correlation in a patient with Proteus syndrome. Am J Med Genet A. 2016;170:1422–32. doi: 10.1002/ajmg.a.37612. [DOI] [PMC free article] [PubMed] [Google Scholar]


