Abstract
Quantitative phase imaging (QPI) modality has been widely adopted in a variety of applications ranging from identifying photomask defects in lithography to characterizing cell structure and tissue morphology in cancer. Traditional QPI utilizes the electromagnetic phase of transmitted light to measure, with nanometer scale sensitivity, alterations in the optical thickness of a sample of interest. In our work, the QPI paradigm is generalized to study depth-resolved properties of phase objects with slowly varying refractive index without a strong interface by utilizing the Fourier phase associated with Fourier-domain optical coherence tomography (FD-OCT). Specifically, based on computing the Fourier phase of light back-scattered by cell nuclei, we have developed nanoscale nuclear architecture mapping (nanoNAM) method that quantifies, with nanoscale sensitivity, (a) the depth-resolved alterations in mean nuclear optical density, and (b) depth-resolved localized heterogeneity in optical density of the cell nuclei. We have used nanoNAM to detect malignant transformation in colon carcinogenesis, even in tissue that appears histologically normal according to pathologists, thereby showing its potential as a pathology aid in cases where pathology examination remains inconclusive, and for screening patient populations at risk of developing cancer. In this paper, we integrate all aspects of nanoNAM, from principle through instrumentation and analysis, to show that nanoNAM is a promising, low-cost, and label-free method for identifying pathologically indeterminate pre-cancerous and cancerous cells. Importantly, it can seamlessly integrate into the clinical pipeline by utilizing clinically prepared formalin-fixed, paraffin-embedded tissue sections.
1. Introduction
The past decade has seen the emergence of quantitative phase imaging (QPI) as a powerful imaging modality [1] with applications in a wide variety of areas ranging from lithography [2] to biology [3]. In the latter case, QPI computes the complex amplitude of light transmitted through weakly scattering biological specimens to obtain their optical thickness. Such measurements have been used to study live cell dynamics [4], cell volume and dry mass [5], and tissue architecture [6,7] among other things [8]. A distinct advantage of QPI is its ability to measure alterations in optical thickness with nanoscale sensitivity, thereby providing a mechanism to visualize and contrast small structural changes in phase objects.
The underlying physics of QPI states that quantitative phase of QPI results from the coherent accumulation of electromagnetic phase of normally incident light wave as it propagates through the entire sample depth. A different physics emerges, if the focus is shifted from transmitted light to back-scattered light. Since the back-scattered waves are generated from different depths along the axial length of the sample, the notion of a single electromagnetic phase is no longer applicable. In this scenario Fourier-domain optical coherence tomography (FD-OCT) has successfully generalized the QPI paradigm to the reflection mode by computing the phase associated with the Fourier transform of the spectral interference signal that results from interference between the back-scattered waves and reference waves for a broadband light source [9–11]. The resulting Fourier phase is depth-resolved due to the coherence gate imposed by the light source. When a strong interface of interest is present within the sample, it is capable of measuring sub-resolution shifts in the interface location within the coherence gate with high sensitivity [9]. As a result, it forms the basis for various FD-OCT-derived imaging modalities such as optical coherence phase microscopy [12]–[14], doppler-OCT [16], and phase-sensitive OCT [17,18].
We have recently shown that for weakly scattering samples with slowly varying refractive index and without any strong interfaces, Fourier phase provides access to structural properties of the sample beyond measuring sub-resolution shifts. Specifically, it provides access to the joint-estimate of sub-resolution offset and the depth-resolved mean spatial frequency of the coherence-gated sample refractive index [11]. The former is a generalization of sub-resolution shift in the depth location of a strong interface to the setting where no strong interfaces are present. It measures the offset of the weighted-center of the sample refractive index within the coherence gate – conceptually akin to the center-of-mass of a body – from the depth location where the coherence gate is centered. The mean spatial frequency estimates two depth-resolved structural properties of the sample within the coherence gate: (a) alterations in mean refractive index, and (b) localized heterogeneity of the refractive index.
Based on this generalized understanding of Fourier phase, we have developed the method of nanoscale nuclear architecture mapping (nanoNAM) [18], which computes with nanoscale sensitivity the depth-resolved mean spatial frequency of the refractive index of a cell nuclei. nanoNAM does so through the marginalization of Fourier phase along the sub-resolution offset dimension. As a result, nanoNAM measures (a) depth-resolved alterations in mean nuclear optical density of the cell nucleus, and (b) depth-resolved localized heterogeneity in optical density of the cell nucleus. We use the term optical density to emphasize the internal architecture of the cell nucleus in terms of the optical property of its nuclear refractive index.
It should be noted that a phase object can be structurally described through the spatial distribution of its refractive index. The physics behind this interpretation of the cell nucleus is the basis for the ability of nanoNAM to measure depth-resolved properties of the nuclear refractive index distribution with nanoscale sensitivity [11,20]. This ability, in turn, is significant in its potential for describing subtle structural changes of cell nuclei during biological processes involved in disease pathology. One important example is the pathogenesis of cancer. It has been well-established that genetic and epigenetic disruptions play an important role in all stages of cancer development including in histologically normal-appearing precursor cells [21,22] in early stage carcinogenesis. One key consequence of this dysregulation is the change in chromatin structure and spatial organization [23]. These changes eventually manifest as alterations in nuclear architecture of cancer cells, with enlarged nuclei size, irregular shape, and hyperchromasia being the most noticeable and universal features [24,25]. However, in early stage carcinogenesis, these neoplastic transformations in nuclear architecture are often too subtle to be visible. Current state-of-the-art in cancer diagnosis is based on pathologists visualizing morphological abnormalities through conventional microscopic imaging of hematoxylin and eosin (H&E)-stained tissue sections; it is not sensitive enough to detect the subtle nuclear architectural changes in cells undergoing early-stage neoplastic transformation that appear histologically normal. Conventional QPI modalities, and other more advanced super-resolution imaging modalities have drawbacks that limit their use, especially in routine clinical settings. (See Section 2.2.4 for details.) As a result, the limitation of conventional pathology leads to indeterminate diagnosis in some cases, missed early-stage cancers in others, and limited ability to assess cancer risk. In such cases nanoNAM provides a unique ability to measure and track structural alterations in the cell nuclei, as the cells undergo malignant transformations during early stage carcinogenesis.
In the next section, we discuss Fourier phase in the context of weakly scattering samples without strong interfaces, and employ a mathematical model to show how nanoNAM method derived from Fourier phase measures nuclear architectural properties of depth-resolved alterations in mean nuclear optical density and localized heterogeneity in nuclear optical density. Simulations are also presented to demonstrate the underlying concepts. In Section 3 we introduce the nanoNAM optical system and extensively discuss its instrumentation and sample preparation protocols. Section 4 details the nanoNAM processing steps that compute the above-mentioned nuclear architectural properties from the spectral interference signal measurements. All practical implementation details are discussed. In Section 5, we give an example of the significance of nanoNAM in assessing colorectal cancer risk in patients with ulcerative colitis (UC), an inflammatory bowel disease associated with chronic colonic inflammation. Concluding remarks discussing current limitations of nanoNAM, and its future direction are presented in Section 6.
2. Principle
The basic principle behind FD-OCT can be derived from the restriction of the three-dimensional Ewald sphere of reflection under the first-order Born approximation [20] to a single axial dimension along the sample depth [26]. In the reflection mode, this restriction relates the sample refractive index axial depth profile, ns(z), to the far-field measurement of the normally incident light back-scattered from different sample depths, by establishing an injective correspondence between the scattering potential of the sample and its far-field scattering amplitude [20]. Usually, the scattering potential is defined as a function of the relative refractive index of the sample with respect to the embedding medium [27]. However, in the context of Fourier phase – the phase of Fourier transformed complex interference FD-OCT signal – it is more suitable to define the scattering potential through the gradient of the sample refractive index profile because the complex interference FD-OCT signal results from changes in sample refractive index, and not its refractive index relative to the surrounding medium [28,29]. Under this model the far-field spectral interference signal is [11],
| (1) |
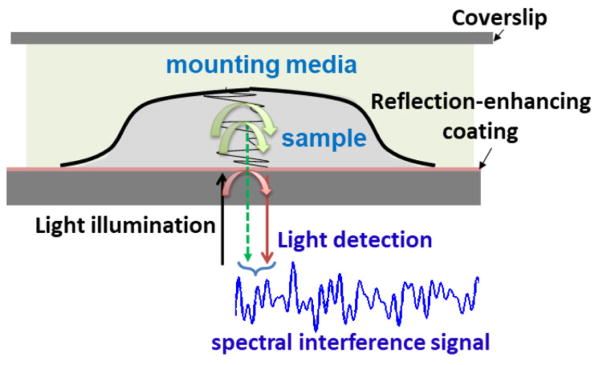
The above equation is based on the reflection-mode common-path nanoNAM optical setup to incorporate robustness against phase noise [30]. The cosine term captures the interference between back-scattered waves from optical depth zopl(z) – corresponding to the physical sample depth z – and the reference wave reflected by the sample-substrate interface, whose amplitude, without any loss of generality, has been assumed to be unity. (See Fig. 1). The coherent integration over all optical depths, gives us the spectral interference signal P(K), for axial spatial frequency K given by K = 2k [11,20]. Here k is the spectroscopic wavenumber, defined as inverse of the wavelength λ. The axial spatial frequency bandwidth of P(K), is therefore, proportional to , where Δλ is the spectral bandwidth of the light source, and λc is its central wavelength. The optical depth zopl(z), corresponding to the physical depth z, is itself given by, . It mediates the mapping of the sample reflection profile rs(z) to the optical space as [11]. It is the reflection profile that determines the amplitude of the back-scattering. For samples with slowly varying refractive index the amplitude is small. However, interference of small amplitude back-scattered waves with a reference signal allows them to ride the reference wave resulting in high signal fidelity and sensitivity of FD-OCT [26].
Figure 1.
The schema of the FFPE tissue section on the glass slide in nanoNAM.
The Fourier transform of P(K) – denoted by p(zopl(z)) – accesses the coherence-gated structural properties of sample refractive index. Specifically, the amplitude of p(zopl(z)) is typically used to capture the strength of an interface of interest – corresponding to a relatively large gradient ropl(zopl(z))– within the coherence gate around zopl(z). It has had a significant impact on medical imaging [31]. Relatedly, the phase associated with p(zopl(z)) has been used to capture sub-resolution (within the coherence gate) location of and shifts at the strong interface of interest in FD-OCT-derived methods such as optical coherence phase microscopy [9,12–15]. It also forms the basis of other successful FD-OCT-based phase imaging modalities such as doppler-OCT [16] and phase-sensitive OCT [17,18].
The principle behind the nanoNAM method takes the phase associated with p(zopl(z)) – Fourier phase ϕ(zopl(z)) – a step further, by generalizing it to weakly scattering samples with a slowly varying refractive index, and without a strong interface. In this generalized setting, we showed that ϕ(zopl(z)) is a joint estimate of sub-resolution offset, δzopl(z), and mean spatial frequency, s(zopl(z)) of the coherence-gated refractive index at optical depth zopl(z) [11],
| (2) |
where the depth-resolved mean spatial frequency, s(zopl(z)) is the ratio between the coherence-gated gradient of the reflection profile and the coherence-gated reflection profile,
| (3) |
Here, Γ is the Fourier transform of the source spectrum S(K) – the source correlation function – that imposes the coherence gate around the optical depth zopl(z), and * represents the convolution operator. For ease of presentation, we have eschewed details on baseband representation of p(zopl(z)), which is needed to compute s(zopl(z)). Interested readers are referred to [11] for further details. (cf. Eq. (23) in [11].) The mean spatial frequency is further expanded in terms of the refractive index profile to (cf. Eq. (25) in [11]),
| (4) |
The derivation is outlined in Appendix A. This representation of s(zopl(z)) highlights its dependence on the gradient and curvature of the refractive index profile, and hints at its ability to capture depth-resolved alterations in coherence-gated mean refractive index and localized heterogeneity in the coherence-gated refractive index. This connection is made explicit in the following section by employing a mathematical model of the refractive index profile.
As mentioned in the introduction, the sub-resolution offset δzopl(z), is an estimate of the shift in the weighted-center of the coherence-gated refractive index profile from the optical depth zopl(z) being probed. Implicit in the FD-OCT principle is that this optical depth is also the location where coherence gate is centered. Therefore, when the refractive index profile is probed at other optical depths very close to zopl(z) – much smaller than the coherence gate – the resulting set of sub-resolution offsets are approximately symmetric around zopl(z), and their effect is marginalized when computing nanoNAM-associated Fourier phase ϕnanoNAM(zopl(z)) (see Section 2.2). As this is valid for all optical depths, nanoNAM-based estimates of Fourier phase primarily capture s(zopl(z)).
2.1 Mathematical model
Following the setup in our previous work [11,19], we define a simplified refractive index profile through a modified sigmoid function
| (5) |
which models an isolated change of Δn in the baseline refractive index n0 at physical depth z0, at a rate s. It is shown in Appendix B that depth-resolved mean spatial frequency s(zopl(z)) of the refractive index modelled by Eq. (5) is given by,
| (6) |
where the function gs(·) captures the structural form and shape of the coherence-gated sigmoid function used to model the refractive index profile. The other key point to note is that the magnitude of s(zopl(z)) depends on product of two refractive index model parameters: change in baseline refractive index Δn and shape s, associated respectively with alterations in mean refractive index within the coherence gate, and the rate at which these alterations occur.
Now, any continuous function with compact support – sample thickness - can be uniformly approximated by a finite sum of sigmoid functions. We can, therefore, express a slowly varying refractive index profile as [32],
| (7) |
where nm is the mean refractive index of the profile, and the sets {Δn1, Δn2, …, ΔnM}, {z1, z2, …, zM}, and {s1, s2, …, sM} model the alterations Δni in nm at depths zi with rate si, i = 1, …, M. Consequently, the magnitude s(zopl(z)) is a complicated function of {Δn1, Δn2, …, ΔnM} and {s1, s2, …, sM} (not shown here). However, the observations toward the end of Appendix B, regarding alteration in the mean refractive index and the rate at which the alteration occurs, remain valid.
Some physical depths in {z1, z2, …, zM} indexed by the set Iz correspond to optical depths within the coherence gate around zopl(z). Subsets of {Δn1, Δn2, …, ΔnM} and {s1, s2, …, sM} also indexed by Iz then model alterations in the mean optical density nm occurring at different rates around zopl(z). The different rates of change indexed by Iz, when taken together, describe the localized heterogeneity of the sample refractive index at zopl(z), while Iz indexed subset of {Δn1, Δn2, …, ΔnM} estimate the coherence-gated mean refractive index. For example, if the magnitude of si, i ∈ Iz is small, heterogeneity within the coherence gate on average is less. The opposite is true for larger si values. Similarly, for small values of Δni, i ∈ Iz on average, the mean alteration in refractive index within the coherence gate is small, and the opposite is true for larger Δni values. In Section 2.2.3 we simulate an example of this scenario.
2.2 Simulation
To illustrate the above concepts, we consider three different refractive index models, simulate the respective spectral interference signals measured by the nanoNAM system, and compute the nanoNAM-associated Fourier phase. The simulations assume a common-mode geometry with the reference wave reflected from the sample-substrate interface. The sample refractive index profile is itself modeled as a multilayer system [30], with each layer being 1 nm thick. Waves from a broadband light source with spectral bandwidth 480–700nm – corresponding to the spectral bandwidth of the light source used in the nanoNAM optical setup – are propagated through a multilayer model using a transfer matrix [33], and the reflections from every layer are interfered and coherently integrated to generate the spectral interference signal. (See Fig. 1) Fourier transform of the spectral interference signal gives the depth-resolved Fourier signal p(zopl(z) corresponding to the refractive index profile, whose phase ϕ(zopl(z)) is given by . The phase is first unwrapped along the optical depth, and then demodulated by removing (subtracting) the phase modulation −2πKc(zopl(z)) associated with the source carrier frequency. (See Appendix C in [11].) Unwrapping, however, results in a cumulative accumulation of Fourier phase along the depth, and removes the effect of coherence gate as the unwrapped Fourier phase at any depth depends on the Fourier phase at all prior depths. But unwrapping is an important step before demodulation to avoid introducing discontinuities in the phase values. Therefore, to retrieve the depth-resolved Fourier phase associated with nanoNAM, we compute the gradient of the unwrapped and demodulated Fourier phase, and then integrate it over the coherent gate around the optical depth of interest to obtain the nanoNAM-associated Fourier phase,
| (8) |
The integration over the coherence gate also marginalizes the symmetric effects of the sub-resolution offset δzopl(z) around zopl(z), giving us ϕnanoNAM(zopl(z)) – the nanoNAM estimate of s(zopl(z)). ϕnanoNAM(zopl(z)) is expressed in units of length by multiplying it by . We refer to this length-based representation of ϕnanoNAM(zopl(z)) as depth-resolved optical path difference (drOPD).
2.2.1 Model 1: Alterations in mean refractive index for a fixed s
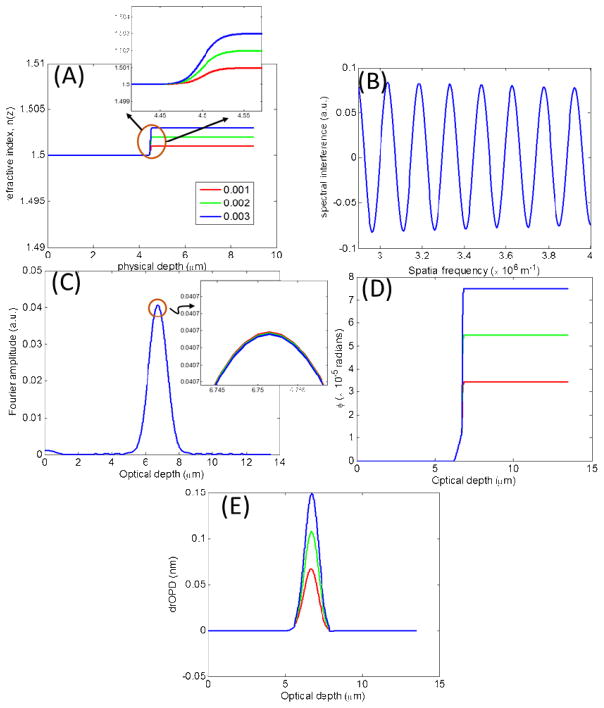
Figure 2A shows the simple refractive index model in Eq. (5) with increments of 0.001 in Δn, illustrating a series of isolated incremental alterations in baseline refractive index n0 = 1.5 at physical depth z0 = 4.5μm, and at the constant rate s = 5 × 10⁷ m−1. The resulting spectral interference is shown in Fig. 2B, with the amplitude of its Fourier transform in Fig. 2C. As is evident the amplitude is not sensitive to the small changes in the optical density. Unlike the amplitude, however, Fourier phase shown in Fig. 2D, is sensitive to these alterations. In fact, it closely follows the shape of the structural profile of the sample refractive index. Corresponding to the Fourier phase ϕ(zopl(z)), Fig. 2E plots the nanoNAM-based drOPD values. Comparing Figs. 2C and 2E we see that the nanoNAM method is sensitive to alterations in mean optical density, whereas the Fourier amplitude is not. It should be noted that the nature of the refractive index profile with only one isolated change makes this change seem like an interface. However, as shown in the inset of Fig. 2A, the alterations in refractive index are indeed very small and occur relatively gradually. It is for these reasons that although amplitude of the Fourier transform captures the depth location, it is unable to clearly identify the gradual increments in it.
Figure 2.
Model 1: Incremental alterations in mean refractive index for a fixed s = 50 × 106m−1. (A) Simple refractive index profiles with increments of 0.001 in Δn (B) Simulated spectral interference signals. (C) Amplitude of the Fourier transform of the spectral interference signals. (D) Phase of the Fourier transform of the spectral interference signals. (E) drOPD profiles corresponding to the nanoNAM-associated Fourier phase.
2.2.2 Model 2: Alterations in rate-of-change in refractive index for a fixed Δn
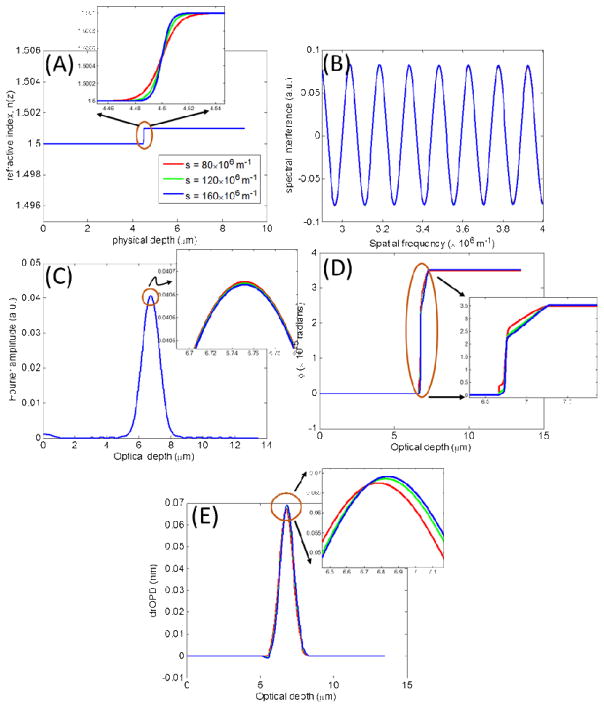
Following the same sequence of figures as above, Figs. 3A–3E, show the ability of ϕnanoNAM(zopl(z)) to capture increments in the rate-of-change in the refractive index profile modeled with increasing values of shape parameter s in increments of 40 × 106 m−1, for Δn fixed at 0.001, n0 = 1.5, and the physical depth, where the isolated change occurs, the same as before. As can be seen by comparing Figs. 3C and 3E, nanoNAM-based drOPD values are better able to track the rate-of-change in the refractive index profile. Additionally, Fourier phase ϕ(zopl(z)) in Fig. 3D again captures a rough estimate of the structural form of the refractive index profile as its shape parameter value increases. We again note that the alteration modeled here through the Δn parameter is small, and therefore, the effect of increases in the refractive s index rate parameter is manifested weakly. Nevertheless, nanoNAM is still sensitive to these small changes.
Figure 3.
Model 2: Incremental alterations in rate-of-change of refractive index for a fixed Δn = 0.001. (A) Simple refractive index profiles with increments of 40 × 106m−1 in s (B) Simulated spectral interference signals. (C) Amplitude of the Fourier transform of the spectral interference signals. (D) Phase of the Fourier transform of the spectral interference signals. (E) drOPD profiles corresponding to the nanoNAM-associated Fourier phase.
2.2.3 Model 3: Simulating heterogeneity in refractive index via Eq. (7)
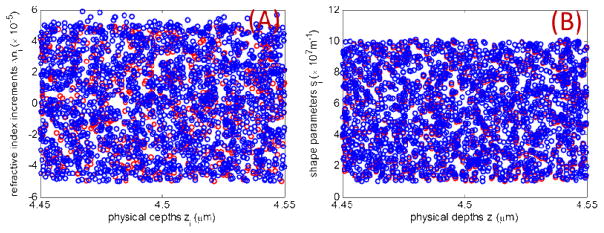
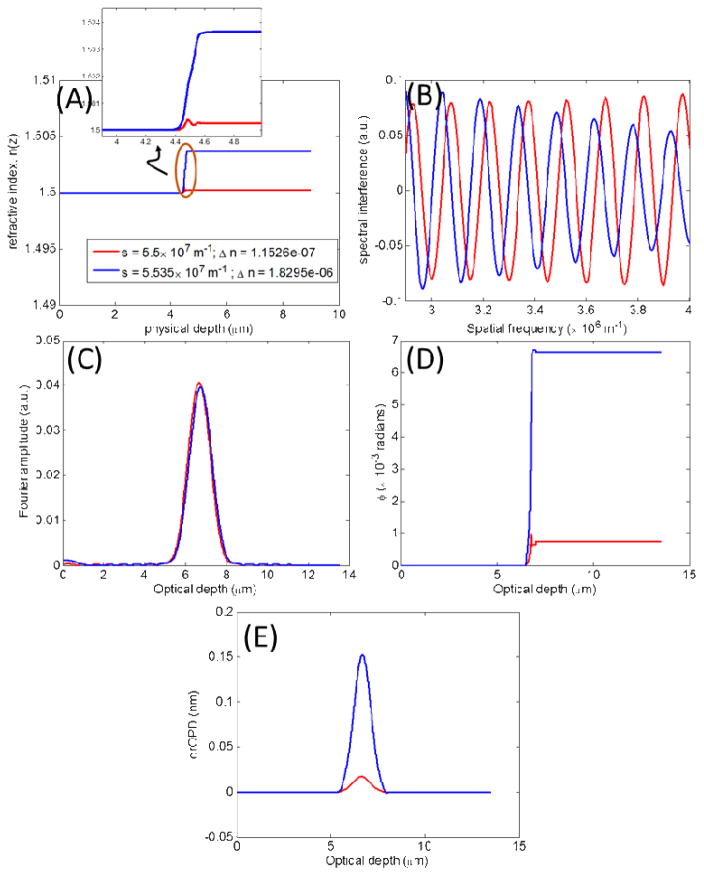
In more realistic scenarios refractive index changes are captured jointly by Δn and s. Furthermore, as described in Eq. (7), more than a single pair of Δn and s is required to mimic the heterogeneity of a refractive index profile. To illustrate the ability of nanoNAM to capture the joint effect of Δn and s on alterations in the refractive index, we define two sets each of increments Δni and shape parameters si at physical depths zi located around the depth of 4.5 μm. These two sets are shown plotted in blue and red as a function zi in Figs. 4A and 4B for Δni and si respectively. All sets of parameters and the physical depths are randomly generated from uniform distributions. The mean refractive index, nm, is set at 1.5. The resulting refractive index profiles are shown in Fig. 5A. As can be seen in the figure legend, the average values of the parameters Δni and si increase from red to blue. This increase is captured by the nanoNAM-based drOPD values shown in Fig 5E, while the amplitude of the Fourier transform (Fig. 5C) of the spectral interference signal is not sensitive enough. It, in fact, introduces ambiguity about the nature of coherence-gated alterations in the refractive index profile by showing the red refractive index profile with a slightly higher Fourier amplitude than the blue refractive index profile. It should be noted that Fourier phase ϕ(zopl(z)) shown in Fig. 5D, again quite reliably captures the structural form of the two profiles.
Figure 4.
Two sets (red and blue) of refractive index model parameters (A) Δni, and (B) si for modeling their joint effect on refractive index heterogeneity are shown. The two sets for both parameters are plotted as a function of the depth at which they alter the refractive index profile generated using Eq. (7). The heterogeneity is modeled around the physical depth of 4.5 μm.
Figure 5.
Model 3: Simulating heterogeneity in refractive index via Eq. (7). The model parameters are shown in Fig. 4. (A) Heterogeneity refractive index models for the two sets of parameters whose average values are shown in the figure legend. (B) Simulated spectral interference signals for the two models (C) Amplitude of the Fourier transform of the spectral interference signals. (D) Phase of the Fourier transform of the spectral interference signals. (E) drOPD profiles corresponding to the nanoNAM-associated Fourier phase.
2.2.4 From theory to practice
The simulations emphasize the capabilities of nanoNAM that were derived from the underlying physics. One critical condition for such capabilities to transfer to practical applications, and not considered in the simulation present here, is the ability of the method to be robust in the presence of noise. As nanoNAM is based on a common-path geometry, it has in-built robustness to phase noise. A more detailed characterization of the stability and robustness of nanoNAM measurement is presented in Section 4.5.2. It is shown there that nanoNAM-based drOPD values are indeed stable, and they characterize alterations in depth-resolved mean optical density and localized heterogeneity with nanoscale sensitivity. Further discussion of noise analysis can also be found in Section 4 of [30].
The ability of nanoNAM to measure with nanoscale sensitivity properties of depth-resolved alterations in samples with slowly varying sample refractive index highlights its potential for describing nuclear architecture of epithelial cells undergoing neoplastic transformations during early stage carcinogenesis. In the early stage of cancer development, the pathological alteration in chromatin structure and spatial organization is subtle that may not be visualized through conventional microscopy, resulting in normal-appearing tissue architecture and nuclear morphology. Imaging modalities such as super-resolution microscopy, and electron microscopy among others can capture these subtle changes, but require special staining with a limited throughput at a higher cost. Conventional QPI modalities do not suffer from these drawbacks and have nanoscale sensitivity, but they provide integrated optical thickness measurements that can potentially be confounded by variations in sample thickness. This is especially true for formalin-fixed, paraffin embedded (FFPE) tissue sections obtained in clinical settings, where microtome-based tissue sections can have thickness variation of about ±0.5μm [30]. nanoNAM balances these concerns by providing depth-resolved nanoscale-sensitive structural characterization of cell nuclei with simple and low-cost sample preparation, while being robust to variations in thickness. (See Section 4.2 for details.)
3. Sample preparation and the optical system for nanoNAM
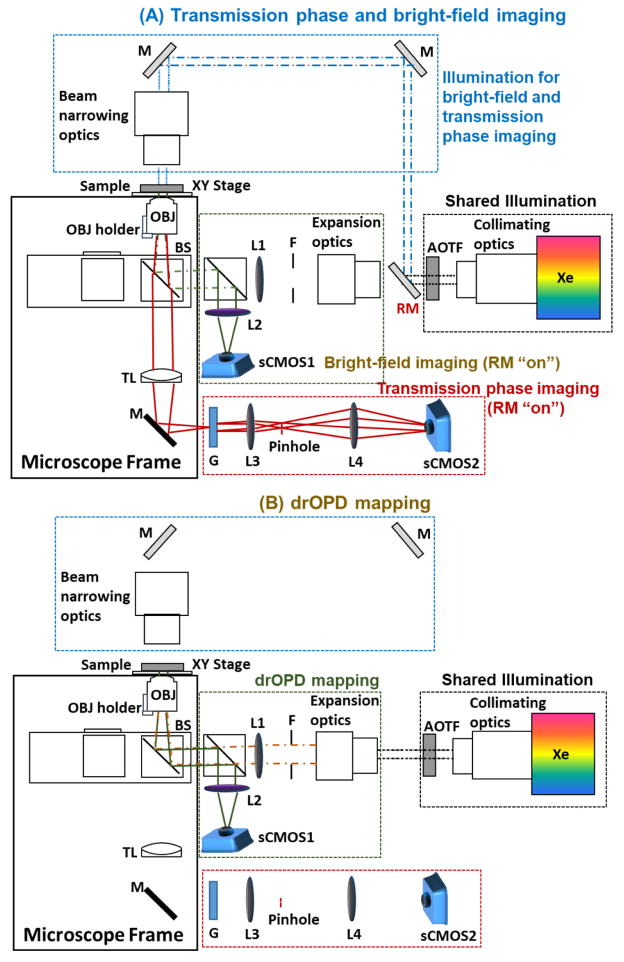
The optical microscopy system for nanoNAM consists of three imaging modules performing three complementary tasks (see Fig. 6): (1) in the reflection mode, depth-resolved nanoNAM mapping of unstained tissue; (2) in the transmission mode, quantitative phase imaging of the tissue before (unstained) and after H&E-staining to obtain a pair of high-contrast phase maps for image co-registration of images obtained from modules 1 and 3; and (3) bright-field imaging of H&E-stained tissue for nuclei identification and correlation with pathology.
Figure 6.
The schematic of the nanoNAM system. (A) The light path diagram for transmission phase and bright-field imaging. (B) The light path diagram for drOPD mapping. Xe: Xenon lamp; RM: removable mirror; F: field diaphragm; L: lens; BS: beam splitter; OBJ: objective; TL: tube lens; M: mirror; G: transmission grating.
Among the three imaging modules, the first module is fundamental to the nanoNAM method as it measures the spectral interference signal that is eventually used to compute the coherence-gated mean spatial frequency of the sample refractive index. The other two modules are primarily used to unambiguously segment cell nuclei on the depth-resolved optical pathlength difference (drOPD) map calculated using Eq. (8) for all en-face (x, y) locations. (See Section 4.1.)
3.1 Sample preparation for depth-resolved nanoNAM
To enable nanoNAM imaging of FFPE tissue section, we first prepare the sample glass slide such that the sample and substrate can together serve as a reflection-mode common-path interferometer. As shown in Fig. 1A, our glass slide is a standard glass slide (25 × 75 × 1 mm, Superfrost™ Microscope Slides, Fisher Scientific) coated with a single-layer dielectric coating (~20% reflection and 80% transmission, Abrisa Technologies). Using a microtome, a 5μm-thick tissue section is cut from the FFPE tissue block, and is placed on the coated glass slide described above. The tissue is deparaffinized by heating the slide at 60°C for 30 minutes in an incubator, and washing it in xylene for 10 minutes. This cycle is repeated 4 times. To minimize structural distortion during sample preparation, the deparaffinized tissue is rehydrated in a graded ethanol series (100%, 95%, 70% and 50%) and water, and dehydrated back to xylene in the reverse order. The unstained sample slide is then cover-slipped with a mounting medium (micromount®, n = 1.50 for dried mounting medium, Surgipath, Leica). This mounting medium is commonly used in histology sample preparation and has a refractive-index closely matched to the tissue section that minimizes the effect of strong interface. When the incoming white-light illuminates the sample, the reflection from the coated layer of the glass slide at the sample-substrate interface provides a stable reference wave. The backscattered waves from within the tissue, together with the reference waves are collected as a function of wavelengths – the spectral interference signal – using the instrument described below.
3.2 Instrument for depth-resolved nanoNAM
The detailed schematic of nanoNAM is shown in Fig. 6. The entire system is built upon a standard microscope frame (AxioObserver, Carl Zeiss). The above-described sample slide with the unstained FFPE tissue section is mounted on a motorized high-precision translational stage (MLS203-2, Thorlabs). A set of imaging fields are pre-selected and their corresponding spatial coordinates recorded. Illumination from a low-coherence white light Xenon lamp (EQ-99, Energetiq) is collimated and passed through a high-speed acousto-optical tunable filter (AOTF, TEAF7-0.45-0.70-S, Brimrose) tuned to the wavelength range 480 through 700 nm at a spectral resolution of 1–3 nm. A flipping mirror (RM) mounted on a motorized mirror mount (MFF101, Thorlabs) is used to direct the AOTF output into different modules.
As the first step, for each imaging field, the quantitative phase imaging of unstained FFPE tissue section is performed by turning up the RM (“on” position) to direct the beam at a wavelength of ~560 nm for trans-illumination of the sample (blue dashed lines in Fig. 6A). This QPI module is based on the diffraction phase microscope [34]. At the image plane located at the side port of the microscope frame, a transmission grating G (110 Grooves/mm, 25mm Square, Transmission Grating Beamsplitter, Edmund Optics) generates multiple orders of the incident field. At the back focal plane of the lens L3 (Canon EF-S 60mm f/2.8 Macro USM Lens), the DC component filtered from the 0th-diffraction order via a pinhole (50μm) and the entire 1st-diffraction order are collected and interfered onto the camera sCMOS2 (pco.edge, PCO-TECH).
Next, by turning down the RM to “off” position, the system is switched to the depth-resolved nanoNAM imaging module for measuring the spectral interference signals from the above unstained tissue section (see Fig. 6B). We note that the unstained tissue section is not moved between the QPI and nanoNAM imaging steps, and therefore images obtained by the two modalities are co-registered. The illumination beam is reflected by the beam splitter (BS), and focused onto the back focal plane of the objective (OBJ, LD Plan Neofluar 20x/0.4, Carl Zeiss) by achromatic lens L1 (AC254-400-A, Thorlabs) to achieve a uniformly illuminated field of view (~250μm diameter). For each wavelength, the interference between the common-mode reference wave and backscattered light from the different sample depths is collected by the same objective, reflected by the second beam splitter, and coherently integrated onto the camera sCMOS1 (pco.edge, PCO-TECH) by the achromatic lens (L2) (AC254-400-A, Thorlabs). To avoid double transmission due to the strong reflected light at coverslip/air interface passing back through the sample, we used a right-angle prism (15mm Commercial Grade Right Angle Prism, Uncoated, Edmund Optics) on top of the coverslip with immersion oil (n = 1.515) in between to deflect the transmitted light outside the microscope system. Images at ~230 wavelengths tuned by AOTF are recorded in a total of 20 seconds. This recording is repeated 4 times and averaged to obtain the spectral interference data cube Isample(x, y, k) of the sample, with further reduced phase noise. (In addition to the spectral interference data cube, two other spectral data cubes Iref(x, y, k) and Ibg(x, y, k) are also obtained. Iref(x, y, k) is obtained by imaging a field without any sample present, and corresponds to the self-interfering reference term. Ibg(x, y, k) is also obtained by imaging over a field without any sample present, although the imaging field is different from the one used for Iref(x, y, k). They will be discussed in Section 4.1.)
As discussed in the following two sections, we removed the inter-user variation in identifying focal plane via an automatic focusing method (see Section 3.3), with the objective mounted on an objective nano-positioning system (Nanopositioning Piezo Actuator, #85-008, Edmund Optics). We also corrected for the wavelength-dependent shift of the focal planes (see Section 3.4).
After obtaining the quantitative phase images and the nanoNAM spectral interference data cube of the unstained tissue section, the slide is removed from the sample stage and immersed in xylene overnight to remove the coverslip. The de-coverslipped tissue slide is then rehydrated in graded ethanol series (following the same processing steps as described in Section 3.1), stained with H&E, and then dehydrated back to xylene in the reversed order. The slide is re-coverslipped with the same mounting medium. This H&E-stained sample slide is mounted on the translational stage, which moves to the spatial coordinates that were previously recorded for the unstained slide at each of the imaging fields. At each imaging field, the quantitative phase image of the stained sample is generated using the QPI module shown in Fig. 6A, in a manner identical to that described above for the unstained sample. In addition, a bright-field image is also obtained using the camera sCMOS1. As detailed in Sections 4.3 and 4.4 below, the quantitative phase images obtained before and after H&E staining are used for image registration, while the bright-field image of the stained tissue section is for pathology evaluation and nuclei segmentation.
3.3 Automatic focusing
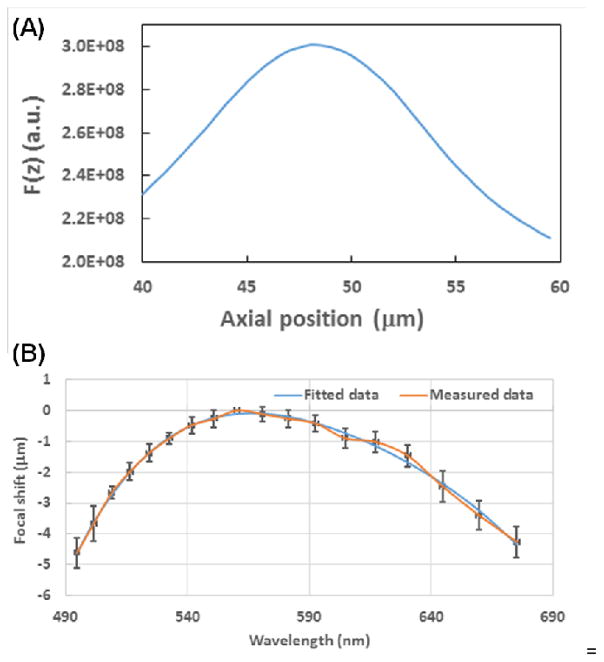
To ensure that the focal planes identified by different users are consistent, we used a simple gradient-based algorithm to perform autofocusing. At each imaging field, a fixed wavelength is chosen, and z-stack reflectance images are acquired. The squared gradient algorithm [35] is then used to define the position of the focal plane. Specifically, at each image, the focus measure is calculated as F(z) = ΣheightΣwidth(I(x + 1, y) − I(x, y))2 + (I(x, y + 1) − I(x, y))2 (F(z) ≥ θ, θ being the gradient threshold). The focus plane is then found by . As an example, Fig. 7A shows the focus measure F(z) as a function of focal planes (z), where the axial z position of the focal plane is defined as z with the maximum value of F(z).
Figure 7.
(A) Squared gradient plot versus the axial position of the objective lens at the wavelength of 550 nm. (B) The dependence of the focal-plane shift on the wavelength. Each point was the average value from 20 measurements (orange line), and the error bar indicates standard deviation. Data was then fitted to a fourth-order polynomial (blue line).
3.4 Correction for wavelength-dependent shift of the focal planes
Despite the use of achromatic optics throughout the nanoNAM optical system, minor chromatic aberration is still present in the system which introduces a small shift of several microns in the axial focal planes for the spectral range of 490–680 nm. To correct for this chromatic aberration, we developed a calibration curve. Specifically, we used 18 wavelengths (evenly spaced along the spectral range 490 to 680 nm, and for each wavelength, the above autofocusing algorithm is used to obtain the focal shift curve along the entire spectral range. Figure 7B shows the average focal shift curve with error bar indicating the standard deviation. To minimize the effect of noise, we fit this curve with a fourth order polynomial (shown in blue) to find the best focal plane at each wavelength.
3.5 Chromatic correction in the lateral direction
The above-mentioned chromatic aberration also introduces a small chromatic distortion in the lateral direction. Figure 8A shows a chosen region of an imaging standard (Image analysis micrometer, Edmund Optics) along with the difference image between images at wavelengths 510 nm and 674 nm shown in Fig. 8B. The presence of boundary lines at the edges of the squares in the latter figure illustrates this distortion. To correct for it, the chosen region of the imaging standard was imaged over the spectral range of interest (490 to 680 nm), and for each spectral image, point estimates of lateral, location-dependent spectral drift at 9 locations – corresponding to the centroids of the nine squares covering the entire field-of-view – were obtained. The point estimates were used to estimate the location-dependent distortion field over the field-of-view for the said spectral range using spline-based interpolation. The distortion field for a specific wavelength is the estimate of the location-dependent translation that the image undergoes with respect to the image at the first wavelength. Distortion correction reverses this translation to be within 2–5 pixels or ~500 nm, which is below the image resolution, as shown in the difference image after lateral image distortion correction (Fig. 8C). By extending this correction to the entire spectral range, we obtained the undistorted spectral interference data cube Isample(x, y, k).
Figure 8.
Correction for chromatic aberration-induced image distortion. (A) The region of interest on the imaging standard. (B–C) The difference maps between two wavelengths of 510 nm and 674 nm (B) before distortion correction and (C) after distortion correction.
4. Post image processing for nanoNAM
4.1 Computing drOPD map
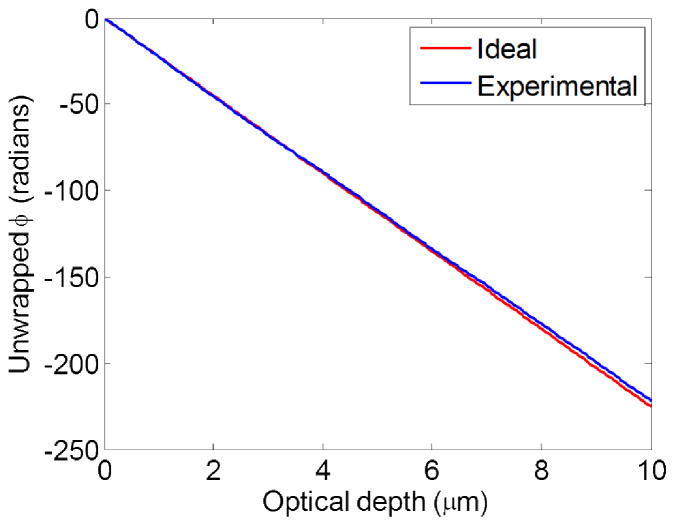
The calculation of drOPD map for each imaging field is based on the steps outlined in Section 2.2. First, the spectral data cubes Isample(x, y, k), Iref(x, y, k), and Ibg(x, y, k) are corrected for the shape of the source spectrum along the -dimension (spectral dimension) by dividing them by the spectral response of the optical system. The contribution of the reference wave is then removed from the spectral interference data cube by computing , followed by the computation of Fourier phase ϕfinal(x, y, zopl(z)) from the Fourier transform of Ifinal(x, y, k), as discussed in Section 2.2. Specifically, phase associated with the Fourier transform of Ifinal(x, y, k) is first unwrapped along the optical depth, and then demodulated by removing the phase −2πKc(zopl(z)) associated with the carrier frequency of the broadband light source, with λc = 590nm. Instead of demodulating the unwrapped phase by subtracting −2πKc(zopl(z)), however, in practice we perform demodulation differently to further suppress phase noise beyond the steps described in Section 3.2. First is calculated, and then its Fourier phase ϕmod(x, y, zopl(z)) is computed in the same manner as ϕfinal(x, y, zopl(z)). Since Iref(x, y, k) and Ibg(x, y, k) correspond to areas without sample present, ideally, we would expect Imod to be zero. However, practically this is not the case due to system noise. As a result, Imod is the noise signal spread along the spectral bandwidth, and its Fourier transform – whose width is inversely proportional to the source spectral bandwidth – is centered at optical depth zopl(0)) = 0, with its phase ϕmod(zopl(z)) close to −2πKc(zopl(z)) capturing the modulation by the source carrier frequency. The noise in the signal, however, perturbs ϕmod(zopl(z)) away from being exactly equal to −2πKc(zopl(z)). (See Fig. 9.) Importantly though, such perturbations are also implicit in ϕfinal(x, y, zopl(z)). Therefore, employing ϕmod(zopl(z)) over −2πKc(zopl(z)) when demodulating ϕfinal(x, y, zopl(z)) ameliorates their impact. Subtracting ϕmod(zopl(z)) from ϕfinal(x, y, zopl(z)) results in the unwrapped and demodulated Fourier phase ϕfinal_demod(x, y, zopl(z)) of the tissue sample. The optical depths zopl(z) at which the Fourier transform of the spectral interference cube Ifinal(x, y, k) is computed are 0.045 μm apart. This step size is much smaller than the width of the coherence gate, so that following Eq. (8) in Section 2.2, and integrating the gradient of ϕfinal_demod(x, y, zopl(z)) around the coherence gate centered at the optical depth zopl(z), the symmetric effect of sub-resolution offset δzopl(z) is marginalized, resulting in ϕfinal_demod(x, y, zopl(z)), which provides the depth-resolved nanoNAM-based estimate of mean spatial frequency that capture coherence-gated alterations in mean refractive index, and localized heterogeneity as detailed in Section 2. For each optical depth, a two-dimensional (x-y) plane phase unwrapping of ϕfinal_nanoNAM(·, ·, zopl(z)), based on Goldstein algorithm [36], is performed to obtain a consistent representation of mean spatial frequency at each slice. The nanoNAM-based drOPD map is finally obtained by multiplying ϕfinal_nanoNAM(x, y, zopl(z)) by .
Figure 9.
Phase modulation – due to the carrier frequency of the light source – of the Fourier phase associated with the Fourier transform of the spectral interference signal. Ideal phase modulation, given by −2πKc(zopl(z)), is depicted in red, while the experimentally-obtained phase modulation is shown in blue. Unwrapped versions of the respective phase modulations are shown.
4.2 Depth-resolved capability of nanoNAM
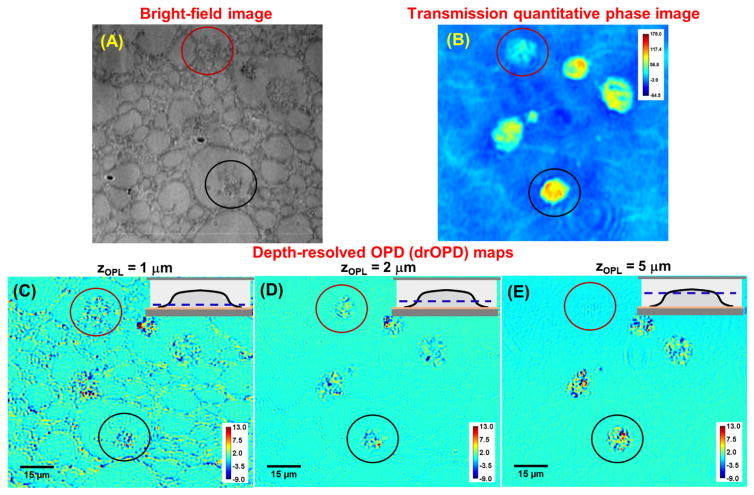
Figure 10 shows the experimental confirmation of the depth-resolved imaging capability of nanoNAM method. For this experiment, we used an unstained FFPE section (5 μm) from a cell block containing HeLa cells embedded in a polymer network of HistoGel®. Figure 10A shows the bright-field image of cell section, which shows cells embedded in polymer network. Its quantitative phase map, with the accumulated phase (optical path length) of the light passing through the entire thickness of the sample is shown in Fig. 10(B). Figures 10(C–E) show the corresponding drOPD maps at three optical depths (zopl(z) = 1, 2, and 5 μm), which clearly show the depth-resolved imaging capability of the drOPD map. At the superficial optical depth of 1 μm (Fig. 10C), both cells and their embedding medium of HistoGel® are present in the drOPD map. At the optical depth of ~2 μm (Fig. 10D), only cells are visible. At optical depth of ~5 μm (Fig. 10E), the cell circled in red, which was visible at 1 and 2 μm, no longer is; while the cell circled in black is visible at all three depths. These observations are supported by the greater phase contrast of the cell circled in black as compared with the cell circled in red in the quantitative phase image, indicating its greater optical thickness. Thus, nanoNAM provides optically sectioning capability.
Figure 10.
Demonstration of the depth-resolved capability of drOPD mapping. (A) Bright-field image and (B) transmission quantitative phase map of a 5μm section of HeLa cell block. (C–E) The corresponding drOPD maps of the 5μm section at the optical depth (zopl) of (C) 1μm, (D) 2μm and (E) 5μm. The dashed lines from the insets illustrate the location of the optical depth with respect to the sample where the thicker bottom layer indicates the glass slide that faces the incoming light. The pseudo color shown in (B) is the integrated optical path length along the axial direction and those in (C–E) are drOPD value. The colorbar represents values in nanometer.
4.3 Image registration of unstained and stained tissue
As nanoNAM images unstained tissue sections, it lacks molecular specificity. Additionally, although nanoNAM has the capability to capture minute depth-resolved alterations in refractive index with nanoscale sensitivity, the corresponding drOPD maps have low contrast. As a result, nanoNAM-based drOPD maps lack both molecular specificity and sufficient cellular contrast to unambiguously identify cell nuclei. Furthermore, initial assessment of cancer phenotype is based on evaluation of standard H&E-stained slides, therefore, nanoNAM-based drOPD maps need to be correlated with conventional pathology. We have, therefore, developed a method to register the nanoNAM-based drOPD maps of the unstained tissue sample with bright-field images of the same tissue after H&E staining, so that H&E stain-based segmented nuclear masks (see Section 4.4) of cell nuclei whose phenotypes were determined via bright-field H&E stained images can be directly applied to the drOPD maps.
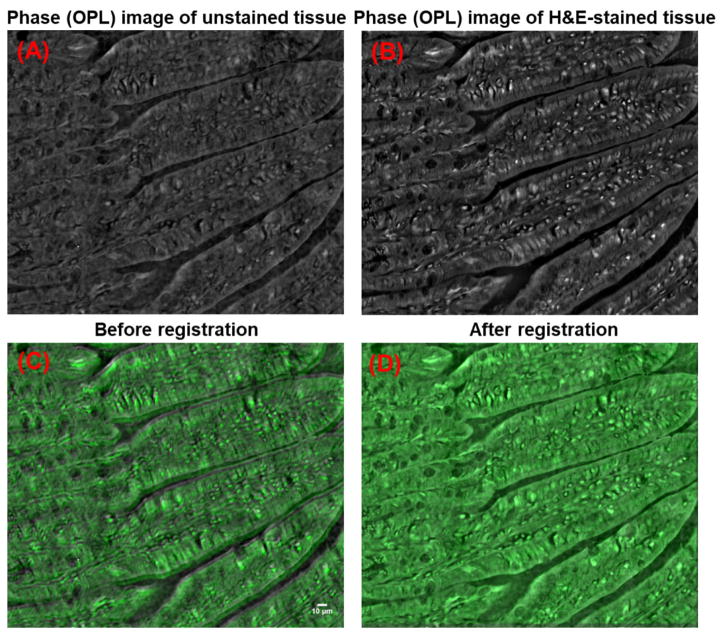
Robust image registration is facilitated by the presence of identifiable and invariant image features in the pair of images to be registered. Consistently identifying a set of such invariant features between low-contrast nanoNAM-based drOPD maps of unstained tissue and the bright-field image of H&E-stained tissue is challenging. However, as shown in Figs. 11(A–B), we observed that QPI-based phase contrast images generated by the QPI module for the tissue sample before and after H&E-staining, consistently preserve structural invariance in their contrast profiles. We exploit this contrast-based structural invariance in our image registration algorithm. Specifically, using Otsu’s method [37], we individually threshold the quantitative phase images of unstained and stained tissue section to identify similar foreground landmark features in each. Normalized cross-correlation between the segmented landmark features in the unstained and stained images is then used to estimate the translation, and log-polar fast Fourier transform [38] is used to estimate the scaling and rotation. We found that a tight microscope slide holder (e.g., MLS203P8, Thorlabs or similar product) minimized rotation. Additionally, focus-correction (see Section 3.4) dramatically reduced scaling effect. Consequently, we observed that translation correction alone provided robust registration. Figures 11(C–D) show the overlaid quantitative phase images of unstained tissue and the H&E-stained tissue before and after image registration, confirming the proper co-registration of the two images. We note that the registration was performed under the assumption that the mounted tissue sample did not move relative to the slide during tissue staining process. To ensure the validity of this assumption, we optimized the tissue processing protocol through the following two strategies: (1) The glass slide is coated with poly-L-lysine to ensure good adherence of the tissue onto the slide; (2) A stepwise hydration-dehydration using graded ethanol series is used to in both unstained and stained tissue processing to ensure minimal shrinkage (see Section 3.1). This protocol has been extensively tested, and found to work in ~99% of the cases, with no tissue position shift after staining.
Figure 11.
Image registration based on the transmission phase (OPL) images of unstained and H&E-stained tissue. The transmission phase (OPL) images of (A) unstained and (B) stained tissue, as well as (C–D) the overlaid transmission phase images (gray: unstained tissue; green: H&E-stained tissue) (C) before and (D) after image registration.
4.4 Cell nuclei segmentation
For cell nuclei segmentation in bright-field images of H&E stained tissue sections, we developed a GUI-based segmentation tool to (1) provide the operator with the ability to perform both manual and semi-automatic segmentation, and (2) streamline the association between the segmented nuclei and their pathological class. The semi-automated nuclei segmentation was based on constrained region-growing where the seed location within the nucleus was identified by the operator. The constraint was a relaxed convexity constraint to prevent unstable region growing, therefore ensuring a well-defined nuclear boundary. We note that only the epithelial cell nuclei – confirmed by a pathologist – are segmented. If the boundary of a cell nucleus cannot be clearly determined either through direct visualization or the semi-automatic segmentation method, the nucleus is not selected for analysis.
4.5 Technical specifications and characterization of the nanoNAM system
4.5.1 Specifications
The lateral and axial resolutions of the nanoNAM optical system respectively are ~1μm and ~1.5μm, and the field of view is ~250×250 μm. Acquisition of each spectral interference data cube, with ~230 wavelengths in the range of 490–680 nm, takes ~10–20 seconds. The coherence gate width is ~1.5μm.
4.5.2 Characterization
The nanoNAM system provides stable drOPD maps with nanoscale sensitivity. To validate this claim, we have conducted extensive characterization of the system. First, the temporal phase stability of the system was characterized by continuously acquiring spectral interference data cubes of an unstained tissue section slide for ~3 hours. The corresponding drOPD maps were computed for each data cube. Pairwise differences between drOPD maps were computed for different times over a fixed 60 by 60-pixel area (approximately the size of a single nucleus). An average drOPD value was computed at every optical depth of every pairwise difference between drOPD maps. These drOPD values for the nanoNAM system have an upper bound of 0.9 nm indicating good temporal stability.
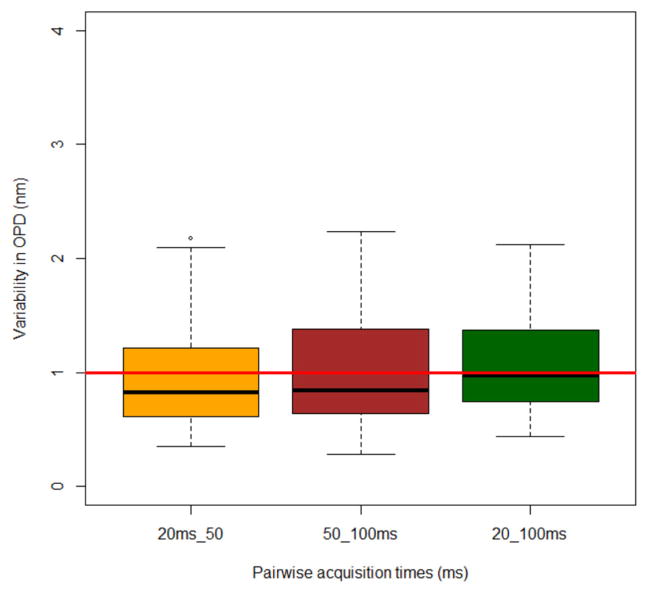
Second, we tested the reproducibility of the drOPD value over multiple repeated measurements spread over a one-week period on the same unstained tissue section. Specifically, spectral interference data cubes were acquired once a day using three different acquisition times (20, 50 and 100ms) for one week. Different acquisition times are used to mimic the possible intensity variation over a large set of data acquisitions. As detailed in Section 4.1, the drOPD map was calculated for the spectral interference data cube acquired for each measurement. We then computed the mean drOPD value at each depth of the drOPD map for ~200–300 nuclei. For a given optical depth and cell nucleus, we computed the pairwise difference between mean-drOPD values for different acquisition times and different days. We did this for all optical depths and all cell nuclei. In the ideal scenario, these pairwise differences will be zero for each optical depth of every cell nucleus. Figure 12 shows the results for the nanoNAM system. The results are presented in the form of boxplots. Each boxplot compares two acquisition times with the pairwise-differences for all depths and all nuclei determining the statistics of the boxplot. As can be seen for the three boxplots, the interquartile range is less than 1 nm, and the average, shown by the red line, is ~1 nm. Most importantly, the worst-case values have an upper bound of ~2 nm. The significance of this characterization is that it shows that on average when the depth-resolved structural characterization of nuclear architecture computed by the nanoNAM method are greater than 1 nm, they represent the actual structural alteration, rather than noise. For the worst-case scenario, this threshold is 2 nm.
Figure 12.
Reproducibility of mean-drOPD value at a single-nucleus level for ~150 cell nuclei. For each column, the box plot shows the variation of drOPD value for the pairwise difference of the same sample with two different acquisition times (20 ms, 50 ms and 100 ms). The red line indicates 1 nm. The average variation of the single-nucleus mean-drOPD is below 1 nm (red line), as shown in the dark line on each box plot.
4.6 Imaging modalities of nanoNAM optical system
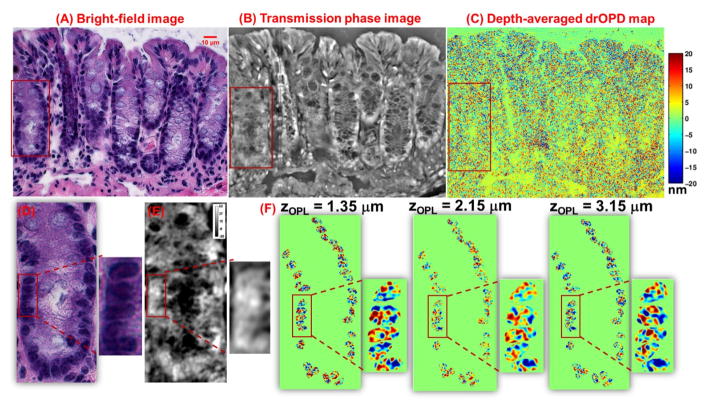
Figure 13 depicts the images obtained using the three imaging modalities making up the nanoNAM optical system: bright-field imaging of H&E-stained tissue (Fig. 13A), quantitative phase imaging (Fig. 13B), and nanoNAM-based drOPD maps of unstained tissue (Fig. 13C).
Figure 13.
Nuclear architecture maps obtained from the three imaging modalities of our optical microscopy system: (A) Bright-field image of an H&E-stained colon tissue, corresponding (B) transmission quantitative phase image and (C) depth-averaged (over the range of range of 1.35 to 3.15μm at a step size of 0.045μm) drOPD maps from an unstained colon tissue section. (D–F) The zoom-in regions of the red boxes in (A–C). (F) The drOPD map at 3 optical depths (central localization zOPL = 1.35μm, 2.25 μm and 3.15μm) from the unstained colon tissue. The scale bar shows drOPD value in nanometers.
The bright-field image of the H&E-stained tissue (Fig. 13A) is the standard image for pathology evaluation. It clearly identifies cell nuclei through the accumulation of chromatic contrast generated by the wavelength-specific absorption of nuclear stains as light is transmitted through the sample (Fig. 13D). This contrast is utilized for performing nuclei segmentation discussed in Section 4.4.
The quantitative phase image shown in Fig. 13B generates optical thickness-based contrast image. Due to the lack of molecular specificity, the individual epithelial cell nuclei cannot always be unambiguously identified (Fig. 13E). However, the H&E staining does not dramatically alter the relative phase contrast of the quantitative phase image before and after H&E staining, thereby allowing the QPI modality to co-register H&E-stained bright-field tissue image and nanoNAM-based drOPD maps.
The nanoNAM-based drOPD maps are shown in Fig. 13C. As mentioned in Section 4.3, the drOPD maps have low contrast. However, as shown in Fig. 13F, they capture distinct depth- resolved structural information capturing the joint effect of coherence-gated alterations in mean optical nuclear density, and localized heterogeneity in optical density of the cell nuclei. A shift toward the deeper red indicates an increase in drOPD value indicating a joint effect of increased alteration in density and/or heterogeneity in nuclear architecture.
5. Application of nanoNAM to cancer detection
The ability of the nanoNAM method to capture, with nanoscale sensitivity, depth-resolved condensed and heterogeneous nuclear architecture, possibly due to alterations in chromatin structure, has many potential applications in studying subtle structural changes of the cell nuclei during many biological processes. One such application is the detection of early-stage carcinogenesis, where structural changes in the nuclear architecture during early cancer development – the gold-standard in cancer diagnosis – is too subtle to be detected by conventional pathology.
An example of this application is cancer risk assessment in patients with ulcerative colitis (UC), a disease with chronic inflammation in the colon. UC patients are at an increased risk for developing colorectal cancer (CRC), but only a small fraction of these patients (1.7 cases per 1000 patient-years) [39] will eventually develop CRC. A method that can identify the small subset of patients who are at the highest risk for colorectal cancer development prior to the detection of clinically significant lesions will significantly improve the efficiency of patient care by preventing large patient cohorts from being subjected to invasive surveillance with associated financial, physical and emotional burdens. Moreover, it will allow resources to be more efficiently targeted at the truly at-risk subset of patients.
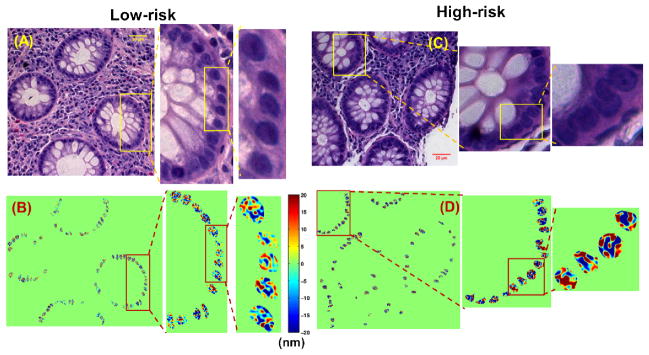
We have recently demonstrated the feasibility of nanoNAM method for cancer risk assessment in UC patients [19]. In this proof-of-concept retrospective study, we identified two groups of patients – a high-risk group with 15 patients that developed CRC or high-grade dysplasia during follow-up of more than one year, and a low-risk group with 18 patients that did not develop any advanced lesions or CRC up to thirteen years of surveillance colonoscopy based follow-up. In a retrospective study, it is important to ensure absence of selection bias. We, therefore, ensured that all patients in the study were matched for clinical and pathological factors such as inflammation status, age, sample age, gender and presence of adenoma. There were no high-grade dysplasia or CRC identified at the time when the tissue was acquired. The archived FFPE tissue blocks of colon tissue biopsies from the initial surveillance colonoscopy of the patients were retrieved, and nanoNAM-based drOPD maps for histologically normal-appearing epithelial cell nuclei were computed. Approximately 500 cell nuclei per patient were analyzed. Figure 14 shows representative drOPD maps of such nuclei from the initial tissue biopsies from a low-risk and high-risk UC patient. Despite the apparent non-dysplastic pathology of the epithelial cells, the pseudo colormap in Fig. 14 shows that there is a shift in the drOPD values between low-risk and high-risk patient groups. Specifically, if we consider positive drOPD values on the color bar, we see that they increase from an average of 10–12 nm to 15–20 nm, which indicates that drOPD captures the alterations in mean nuclear optical density and localized structural heterogeneity in cells that appear histologically normal. Therefore, nanoNAM shows the potential to visualize the trend in nuclear structural change during early-stage carcinogenesis.
Figure 14.
Cancer risk assessment of UC patients: Bright-field image of stained H&E tissue section (from the initial tissue biopsy) from a (A) low-risk UC patient, and (C) a high-risk UC patient. drOPD maps for the same (B) low-risk and (D) high-risk UC patients computed from the same tissue sections as those used for bright-field imaging before staining.
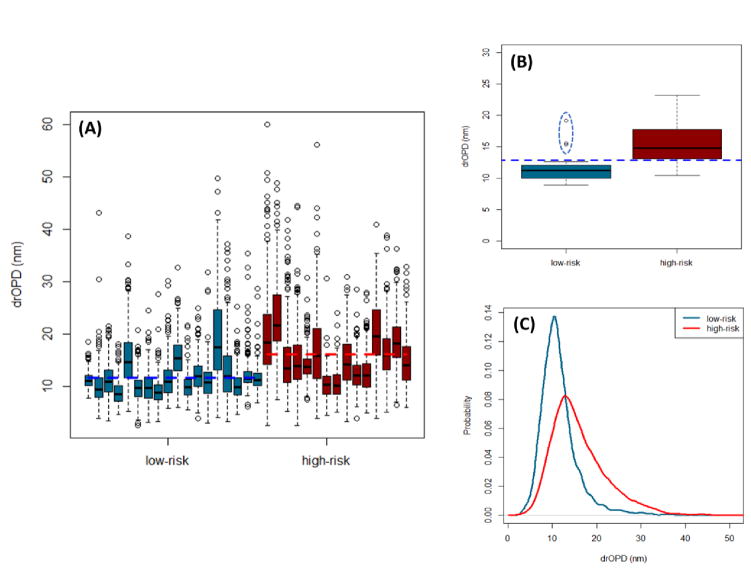
Figures 15(A) and 15(B) make the above discussed visualization quantitative. Here we focus on the positive drOPD values as the increase (decrease) in positive drOPD value is associated with increase (decrease) in mean nuclear optical density and localized heterogeneity. Figure 15(A) shows a bar graph plot of the mean drOPD values for each cell nuclei of every patient. The mean drOPD value for a cell nucleus is the volumetric average of the nanoNAM-based depth-resolved nuclear architecture of the cell nucleus. It is generated using the nucleus mask obtained from cell segmentation, applied to the drOPD map of the tissue section. The resulting drOPD map of each nucleus is averaged over all relevant depths to obtain the mean drOPD summary statistic. We note that the relevant depths that the drOPD maps were limited to were between 1.35 and 3.15μm. This range was chosen to ensure that those depths of the 5μm tissue section that could potentially be affected by variations in thickness – due to variations in microtome sectioning [30] – within their coherence gate were excluded from analysis.
Figure 15.
nanoNAM based assessment and quantification of low- and high-risk UC patients. (a) Box plot of cell-level mean drOPD values for each patient. (b) Box plot of patient-level drOPD value for each patient. (c) Probability distribution of cell-level mean drOPD values from all patients in the low-risk and high-risk groups.
As can be seen, there is an increase in the mean drOPD value between low-risk and high-risk patients. This increase in mean drOPD value at the cell-nuclei level is statistically significant at the 95% confidence level with p-value of 2.2E-16. More importantly, we see the statistically significant increase of mean drOPD at the patient-level too. We summarize the cell-nuclei level mean drOPD values for each patient by a single averaged drOPD value. Figure 15(B) shows the bar graph plot of these drOPD values for both low-risk and high-risk patient groups. As can be seen, the drOPD value increases from an average of 11.7 nm for the low-risk group to 15.6 nm for the high-risk group. This increase is statistically significant with p-value of 0.0022. Furthermore, the blue dashed line corresponding to drOPD value of 12.85 nm defines the classifier that separates the patients in the two groups, except for three patients in the low-risk group encircled by the ellipse drawn with a blue dashed line. This result strongly indicates that nanoNAM method has the potential to reveal increase in nuclear density and/or heterogeneity in early-stage carcinogenesis and identify high-risk patients.
Figures 15(A–B) also illustrate the important notion of heterogeneity in sub-populations: although the shift in mean drOPD values of the cell nuclei is significant, patients in both low- and high-risk groups also have cells with similar mean drOPD values, which captures cell heterogeneity expected during carcinogenesis. This point is clearly brought forth in Fig. 15(C), which shows the probability distributions of mean drOPD values of all measured individual cell nuclei from all patients in the two risk groups. As can be seen, despite the distinct shift, there is overlap between the two risk-groups suggesting that patients in both risk groups have cells undergoing various biological processes, with similar alterations in nuclear architecture captured by their drOPD values. However, cells from the high-risk group that have accumulated enough genetic and epigenetic alterations undergo malignant transformation, where the increased drOPD values are observed. We emphasize that these changes have not yet manifested at the micro-scale, and cannot be identified by a pathologist.
6. Challenges and future directions
We have introduced the theoretical basis, optical system, and experimental implementation of nanoNAM as a new method for probing, with nanoscale sensitivity, the depth-resolved alterations in coherence-gated mean optical density, and depth-resolved localized heterogeneity in optical density in phase objects (thin samples) with weakly varying refractive and without a strong interface. We showed that this ability had the potential to allow nanoNAM capture subtle structural alterations in cell nuclei during biological processes involved in disease pathology. We presented a specific retrospective study to exemplify this potential, by showing the capacity of nanoNAM in assessing colorectal cancer risk in UC patients from histologically normal appearing cell nuclei.
Despite the initial promise, however, there are challenges that need to be addressed. As an example, our optimal sample preparation protocol for ensuring preservation of tissue-section integrity during multi-modal nanoNAM imaging needs to be further evaluated to ensure robust performance in a multi-center study. Additionally, nanoscale nuclear architectural changes mapped by nanoNAM lack molecular specificity. Such specificity, either through identification of unique biophysical properties in nanoNAM-based drOPD maps, or through combination of nanoNAM with modalities that would link nanoNAM measurements to specific molecular-level structural changes would allow nanoNAM to relate structural alterations in early stage carcinogenesis to the underlying mechanism in carcinogenesis. Addressing the biological basis of nanoscale nuclear architecture in cancer development is the future direction for nanoNAM development.
Supplementary Material
Highlights.
Fourier-domain optical coherence tomography based extension of quantitative phase imaging to the reflection mode
Theory and modeling of Fourier phase for assessing depth-resolved refractive-index-based structural properties of weakly scattering objects
Method and instrumentation for measuring nuclear structural properties, and its application in detecting early stage carcinogenesis
Acknowledgments
We acknowledge the funding support from National Institute of Health R01EB016657 and R01CA185363.
Appendix
A. Mean spatial frequency, s(zopl(z)), of the coherence-gated refractive index at optical depth zopl(z)
In [11] we showed that the mean spatial frequency s(zopl(z)) of the refractive index within the coherence gate is given by,
| (A.1) |
Strictly speaking, as rs(zopl(z)) and its gradient are accessed through p(zopl(z)), the Fourier transform of the spectral interference signal, which is modulated by the carrier frequency of the source spectrum S(K), should be demodulated first. Consequently, both rs(zopl(z)) and should be the baseband representations respectively of the reflection profile and its gradient accessed through p(zopl(z)). (cf. Eq. (23) in [11].) For ease of representation, although we assume and perform demodulation of the carrier frequency, we have not made this notationally explicit in Eq. (A.1). (See [11] for more details.)
On substituting in Eq. (A.1), with
| (A.2) |
and using basic calculus, we get,
| (A.3) |
Linearity of the convolution operator allows Eq. (A.3) to expand to
| (A.4) |
Equation (A.4) is written without a common factor of 2 to emphasize its most basic form. We note, however, that keeping the common factor does not in any way affect the analysis, method or conclusions.
B. Mean spatial frequency, s(zopl(z)), expression for the simple refractive index model in Eq. (5)
Using the modified sigmoid function to model the refractive index ns with respect to the optical depth zopl(z), allows us to express the first and second derivates of ns(zopl(z)) as
| (B.1) |
and
| (B.2) |
Substituting them in Eq. (A.4), along with ns(zopl(z)), results in s(zopl(z)) of the simple refractive index profile within the coherence gate centered at zopl(z) reducing to
| (B.3) |
with gs(n0, Δn, s, zopl(z)) given by
| (B.4) |
where f(·) represents the convolution of its argument with Γ, the source correlation function. The derivation of the above result assumes Δn ≪ n0.
Although the expression of the function gs(n0, Δn, s, zopl(z)) is complex, it simply captures the normalized (to the range [−1,1]) sigmoid profile of the refractive index. We note that this ability is implicitly related to the Fourier phase being able to capture the profile of the refractive index. (See Figs. 2D, 3D and 5D.)
Going back to Eq. (B.3) we observe that s(zopl(z)) is also a function of (sΔn). This product captures the joint effect of the alteration in the mean refractive index, and the rate at which the alteration occurs. Thus, where gs(n0, Δn, s, zopl(z)) captures the form of the refractive index profile, its strength depends on (sΔn). (See Figs. 2D, 3D and 5D.)
Footnotes
Publisher's Disclaimer: This is a PDF file of an unedited manuscript that has been accepted for publication. As a service to our customers we are providing this early version of the manuscript. The manuscript will undergo copyediting, typesetting, and review of the resulting proof before it is published in its final citable form. Please note that during the production process errors may be discovered which could affect the content, and all legal disclaimers that apply to the journal pertain.
References
- 1.Mir M, Bhaduri B, Wang R, Zhu R, Popescu G. Quantitative phase imaging. Prog Opt. 2012;57:133. doi: 10.1016/B978-0-44-459422-8.00003-5. [DOI] [Google Scholar]
- 2.Shanker A, Waller L, Neureuther AR. Defocus based phase imaging for quantifying electromagnetic edge effects in photomasks. 2014 Technical Report No. UCB/EECS-2014-105. [Google Scholar]
- 3.Popescu G. Quantitative Phase Imaging of Cells and Tissues. McGraw-Hill Education; 2011. [Google Scholar]
- 4.Ma L, Rajshekhar G, Wang R, Bhaduri B, Sridharan S, Mir M, Chakraborty A, Iyer R, Prasanth S, Millet L, Gillette MU, Popescu G. Phase correlation imaging of unlabeled cell dynamics. Sci Rep. 2016;6:32702. doi: 10.1038/srep32702. [DOI] [PMC free article] [PubMed] [Google Scholar]
- 5.Kastl L, Isbach M, Dirksen D, Schnekenburger J, Kemper B. Quantitative phase imaging for cell culture quality control. Cytom Part A. 2017;91:470–481. doi: 10.1002/cyto.a.23082. [DOI] [PubMed] [Google Scholar]
- 6.Ding H, Wang Z, Nguyen F, Boppart SA, Popescu G. Fourier transform light scattering of inhomogeneous and dynamic structures. Phys Rev Lett. 2008;101 doi: 10.1103/PhysRevLett.101.238102. [DOI] [PMC free article] [PubMed] [Google Scholar]
- 7.Majeed H, Nguyen T, Kandel M, Marcias V, Do M, Tangella K, Balla A, Popescu G. Automatic tissue segmentation of breast biopsies imaged by QPI. Proc SPIE. 2016 doi: 10.1117/12.2209142. 971817-971817–6. [DOI] [Google Scholar]
- 8.Kim T, Zhou R, Goddard LL, Popescu G. Breakthroughs in Photonics 2013: Quantitative Phase Imaging: Metrology Meets Biology. IEEE Photonics J. 2014;6 doi: 10.1109/JPHOT.2014.2309647. [DOI] [Google Scholar]
- 9.Choma M, Ellerbee AK, Yang C, Creazzo TL, Izatt Ja. Spectral-domain phase microscopy. Opt Lett. 2005;30:1162–1164. doi: 10.1364/ol.30.001162. [DOI] [PubMed] [Google Scholar]
- 10.Joo C, Akkin T, Cense B, Park BH, de Boer JF. Spectral-domain optical coherence phase microscopy for quantitative phase-contrast imaging. Opt Lett. 2005;30:2131–2133. doi: 10.1364/OL.30.002131. [DOI] [PubMed] [Google Scholar]
- 11.Uttam S, Liu Y. Fourier phase in Fourier-domain optical coherence tomography. J Opt Soc Am A Opt Image Sci Vis. 2015;32:2286–2306. doi: 10.1364/JOSAA.32.002286. [DOI] [PMC free article] [PubMed] [Google Scholar]
- 12.Joo C, Akkin T, Cense B, Park BH, de Boer JF. Spectral-domain optical coherence phase microscopy for quantitative phase-contrast imaging. Opt Lett. 2005;30:2131–2133. doi: 10.1364/OL.30.002131. [DOI] [PubMed] [Google Scholar]
- 13.Sarunic MV, Weinberg S, Izatt JA. Full-field swept-source phase microscopy. Opt Lett. 2006;31:1462–1464. doi: 10.1364/OL.31.001462. [DOI] [PubMed] [Google Scholar]
- 14.Rinehart MT, Jaedicke V, Wax A. Quantitative phase microscopy with off-axis optical coherence tomography. Opt Lett. 2014;39:1996–1999. doi: 10.1364/OL.39.001996. [DOI] [PubMed] [Google Scholar]
- 15.Ansari R, Myrtus C, Aherrahrou R, Erdmann J, Schweikard A, Hüttmann G. Ultrahigh-resolution, high-speed spectral domain optical coherence phase microscopy. Opt Lett. 2014;39:45. doi: 10.1364/OL.39.000045. [DOI] [PubMed] [Google Scholar]
- 16.Leitgeb RA, Werkmeister RM, Blatter C, Schmetterer L. Doppler Optical Coherence Tomography. Prog Retin Eye Res. 2014;41:26–43. doi: 10.1016/j.preteyeres.2014.03.004. [DOI] [PMC free article] [PubMed] [Google Scholar]
- 17.Choi W, Potsaid B, Jayaraman V, Baumann B, Grulkowski I, Liu JJ, Lu CD, Cable AE, Huang D, Duker JS, Fujimoto JG. Phase-sensitive swept-source optical coherence tomography imaging of the human retina with a vertical cavity surface-emitting laser light source. Opt Lett. 2013;38:338–40. doi: 10.1364/OL.38.000338. [DOI] [PMC free article] [PubMed] [Google Scholar]
- 18.Wang RK, Nuttall AL. Phase-sensitive optical coherence tomography imaging of the tissue motion within the organ of Corti at a subnanometer scale: a preliminary study. J Biomed Opt. 2010;15:56005. doi: 10.1117/1.3486543. [DOI] [PMC free article] [PubMed] [Google Scholar]
- 19.Uttam S, Pham HV, LaFace J, Leibowitz B, Yu J, Brand RE, Hartman DJ, Liu Y. Early prediction of cancer progression by depth-resolved nanoscale mapping of nuclear architecture from unstained tissue specimens. Cancer Res. 2015;75:4718–4727. doi: 10.1158/0008-5472.CAN-15-1274. [DOI] [PMC free article] [PubMed] [Google Scholar]
- 20.Born M, Wolf E. Principles of optics. In: Born Max, Wolf Emil., editors. Princ Opt Electromagn Theory Propag Interf Diffr Light. 2. Vol. 1964. New York NY: Pergamon Press; 1999. pp. 1–952. [DOI] [Google Scholar]
- 21.Feinberg AP, Ohlsson R, Henikoff S. The epigenetic progenitor origin of human cancer. Nat Rev Genet. 2006;7:21–33. doi: 10.1038/nrg1748. [DOI] [PubMed] [Google Scholar]
- 22.Reddy KL, Feinberg AP. Higher order chromatin organization in cancer. Semin Cancer Biol. 2013;23:109–115. doi: 10.1016/j.semcancer.2012.12.001. [DOI] [PMC free article] [PubMed] [Google Scholar]
- 23.Brock MV, Herman JG, Baylin SB. Cancer as a manifestation of aberrant chromatin structure. Cancer J. 2007;13:3–8. doi: 10.1097/PPO.0b013e31803c5415. [DOI] [PMC free article] [PubMed] [Google Scholar]
- 24.Zink D, Fischer AH, Nickerson JA. Nuclear structure in cancer cells. Nat Rev Cancer. 2004;4:677–687. doi: 10.1038/nrc1430. [DOI] [PubMed] [Google Scholar]
- 25.Fischer AH, Zhao C, Li QK, Gustafson KS, Eltoum IE, Tambouret R, Benstein B, Savaloja LC, Kulesza P. The cytologic criteria of malignancy. J Cell Biochem. 2010;110:795–811. doi: 10.1002/jcb.22585. [DOI] [PubMed] [Google Scholar]
- 26.Fercher AF, Drexler W, Hitzenberger CK, Lasser T. Optical coherence tomography—principles and applications. Rep Prog Phys. 2003;66:239–303. doi: 10.1088/0034-4885/66/2/204. [DOI] [Google Scholar]
- 27.Uttam S, Alexandrov Sa, Bista RK, Liu Y. Tomographic imaging via spectral encoding of spatial frequency. Opt Express. 2013;21:7488–504. doi: 10.1364/OE.21.007488. doi: http://dx.doi.org/10.1364/OE.21.007488. [DOI] [PMC free article] [PubMed] [Google Scholar]
- 28.Sheppard CJR, Connolly TJ, Gu M. The scattering potential for imaging in the reflection geometry. Opt Commun. 1995;117:16–19. doi: 10.1016/0030-4018(95)00107-J. [DOI] [Google Scholar]
- 29.Sheppard CJ, Connolly TJ, Lee J, Cogswell CJ. Confocal imaging of a stratified medium. Appl Opt. 1994;33:631–40. doi: 10.1364/AO.33.000631. [DOI] [PubMed] [Google Scholar]
- 30.Uttam S, Bista RK, Staton K, Alexandrov S, Choi S, Bakkenist CJ, Hartman DJ, Brand RE, Liu Y. Investigation of depth-resolved nanoscale structural changes in regulated cell proliferation and chromatin decondensation. Biomed Opt Express. 2013;4:596–613. doi: 10.1364/BOE.4.000596. [DOI] [PMC free article] [PubMed] [Google Scholar]
- 31.Adhi M, Duker JS. Optical coherence tomography--current and future applications. Curr Opin Ophthalmol. 2013;24:213–21. doi: 10.1097/ICU.0b013e32835f8bf8. [DOI] [PMC free article] [PubMed] [Google Scholar]
- 32.Cybenko G. Approximation by superpositions of a sigmoidal function. Math Control Signals, Syst. 1989;2:303–314. [Google Scholar]
- 33.Saleh BEA, Teich MC. Fundamentals of Photonics. 2. Wiley; 2007. p. 1200. [DOI] [Google Scholar]
- 34.Popescu G, Ikeda T, Dasari RR, Feld MS. Diffraction phase microscopy for quantifying cell structure and dynamics. Opt Lett. 2006;31:775–777. doi: 10.1364/ol.31.000775. [DOI] [PubMed] [Google Scholar]
- 35.Santos A, Ortiz de Solorzano C, Vaquero JJ, Pena JM, Malpica N, del Pozo F. Evaluation of autofocus functions in molecular cytogenetic analysis. J Microsc. 1997;188:264–272. doi: 10.1046/j.1365-2818.1997.2630819.x. [DOI] [PubMed] [Google Scholar]
- 36.Ghiglia DC, Pritt MD. Two-dimensional phase unwrapping: theory, algorithms, and software. Wiley; 1998. [Google Scholar]
- 37.Otsu N. A threshold selection method from gray-level histograms. IEEE Trans Syst Man Cybern. 1979;9:62–66. doi: 10.1109/TSMC.1979.4310076. [DOI] [Google Scholar]
- 38.Reddy BS, Chatterji BN. An FFT-based technique for translation, rotation, and scale-invariant image registration. Ieee Trans Image Process. 1996;5:1266–1271. doi: 10.1109/83.506761. [DOI] [PubMed] [Google Scholar]
- 39.Beaugerie L, Itzkowitz SH. Cancers complicating inflammatory bowel disease. N Engl J Med. 2015;372:1441–1452. doi: 10.1056/NEJMra1403718. [DOI] [PubMed] [Google Scholar]
Associated Data
This section collects any data citations, data availability statements, or supplementary materials included in this article.


