

Abstract
Chronic distress associates with peripheral release of cortisol and a parallel upregulation of innate inflammation. Typically, cortisol functions to down-regulate inflammatory processes. However, in the context of chronic stress, it is hypothesized that glucocorticoid receptors within immune cells become less sensitive to the anti-inflammatory effects of cortisol, resulting in increased systemic inflammation. Caring for a child newly diagnosed with cancer is a particularly provocative chronic stressor. Here, we examine evidence for the development of cellular resistance to glucocorticoids among 120 mothers (Aged 18-56yrs; 86% Caucasian) across the 12 months following their child’s new diagnosis with cancer. Measures of psychological distress, interleukin (IL)-6, and glucocorticoid resistance (GCR) were assessed 1, 6, and 12 months after the diagnosis. A latent factor for distress was derived from the covariation among symptoms of anxiety, depression, and post-traumatic stress. Latent change score models revealed a significant positive association between change in distress and change in GCR from 0-6 months, and 6 months-1 year. This finding provides initial evidence for a longitudinal association between change in maternal distress and change in GCR from the onset of a chronic stressor through one year. Although levels of IL-6 increased during the first six months after the child’s diagnosis, the magnitude of this change was not related to change in distress or change in GCR. Given the possible health consequences of reduced immune sensitivity to glucocorticoids, future work should further explore this stress response and its clinical significance.
Keywords: cortisol sensitivity, chronic stress, caregiving, immune, inflammation, IL-6
1. Introduction
Life event stress associates with increased risk for a range of physical health morbidities that involve inflammatory pathophysiology (S. Cohen, Janicki-Deverts, & G. E. Miller, 2007; Tosevski & Milovancevic, 2006), including cardiovascular disease, asthma, rheumatoid arthritis, and progression to AIDS (Cutolo & Straub, 2006; Kozyrskyj et al., 2008; Leserman et al., 2002; Steptoe & Kivimaki, 2013). Long-term caregiving for a loved one is a particularly provocative chronic stressor, associated with a 40-60% increased risk of cardiovascular disease beyond that associated with more conventional risk factors (Steptoe & Kivimaki, 2013). Although the pathways that link life stress, such as caregiving, to adverse health outcomes remain unclear and are likely complex, growing evidence suggests that inflammatory processes may play a role.
When compared with age-matched individuals who are not caregiving, a number of studies show elevated circulating markers of inflammation (e.g., IL-6 and CRP) among caregivers; however, not all findings are consistent (see Lovell & Wetherell, 2011; Potier et al., 2017 for reviews). Longitudinal studies investigating the impact of caregiving on systemic inflammation show similarly mixed results. For example, one study reported increases in circulating levels of IL-6 among spousal caregivers over a 6 year period (Kiecolt-Glaser et al., 2003), and another study reported increases in CRP, but not IL-6, among spousal caregivers across a 1-year period (Rohleder et al., 2009). Reasons for inconsistent associations between caregiving and inflammation remain unclear; however, it is possible that psychological responses to the caregiving situation moderate the magnitude of the effect, with caregivers experiencing heightened levels of distress at greater risk for systemic inflammation.
Individual differences in emotional response to life events are thought to affect levels of inflammation indirectly through health behaviors, and/or directly through biological pathways. The HPA axis is one established biological pathway that activates in response to psychological distress and is important for mobilization of adaptive metabolic resources, including modulation of inflammatory processes (Castro, Elias, Elias, & Moreira, 2011; Schoneveld & Cidlowski, 2007; Tsigos & Chrousos, 2002). A meta-analytic review of over 50 years of human research concluded that persistent psychological distress is accompanied by dysregulation of cortisol hormone secretion, with higher than normal levels of cortisol secreted over the course of the day (G. E. Miller et al., 2007). Given that glucocorticoids like cortisol act through glucocorticoid receptors in immune cells to down-regulate transcription of pro-inflammatory cytokines, one would expect stress-related increases in cortisol to associate with decreased peripheral levels of inflammatory markers. Contrary to this expectation, considerable evidence links persistent psychological distress to elevated circulating markers of systemic inflammation, such as IL-1, IL-6, TNF-a, and CRP (Haapakoski, Mathieu, Ebmeier, Alenius, & Kivimaki, 2015; Hansel et al., 2010; Pace & Heim, 2011; Rohleder, 2014). In this regard, it is widely suggested that chronic exposure to cortisol reduces the sensitivity of glucocorticoid receptors in immune cells to the downregulation of pro-inflammatory gene transcription by cortisol (A. H. Miller, 2008; Raison & Miller, 2003). Possible receptor alterations that could confer reduced sensitivity to cortisol include changes in the number, binding affinity, or functional signaling capacity of the glucocorticoid receptor (Raison & G. E. Miller, 2003).
In support of this possibility, animal models show that chronic psychological stress results in elevated levels of glucocorticoids, increased systemic inflammation (e.g. IL-6), and glucocorticoid resistance, with decreased nuclear translocation of the glucocorticoid complex, as well as failure to block pro-inflammatory NFkB-mediated transcription (Quan et al., 2003; Stark, Avitsur, Hunzeker, Padgett, & Sheridan, 2002; Stark et al., 2001). In humans, initial cross-sectional evidence also supports this pattern, with increased resistance observed among distressed spousal caregivers of dementia patients when compared to non-caregivers (Bauer et al., 2000). Similarly, and of particular relevance to the current study, G. E. Miller et al. (2002) showed reduced sensitivity to cortisol among 25 distressed parental caregivers of cancer patients when compared to 25 parents of medically healthy children matched on age, gender, ethnicity, and marital status (G. E. Miller et al., 2002). Importantly, parents in this study were evaluated an average of 9.6 months after their child’s initial diagnosis, with a standard deviation of 9.5 months and a range of 1-35 months. In a more recent study, G. E. Miller et al. (2014) showed downregulation of glucocorticoid complex signaling in monocytes of 33 caregivers of a spouse with cancer when compared to 47 age-matched non-caregivers. In sum, cross-sectional evidence in humans suggests that caregiving stress is associated with cellular resistance to the anti-inflammatory effects of cortisol. However, the timing of these changes remains unclear. To date, only one study has examined changes in glucocorticoid resistance and inflammation over time (Rohleder et al., 2009). Specifically, when compared with 19 age-matched non-caregivers, 18 distressed caregivers of a spouse with cancer showed a tendency towards increasing glucocorticoid resistance and increasing circulating levels of CRP, but no change in IL-6, across a one-year period (Rohleder et al., 2009). Collectively, existing evidence suggests development of glucocorticoid resistance among chronically distressed caregivers, with some support for the possibility that resistance is accompanied by elevated levels of systemic inflammation. However, available studies are small, largely cross-sectional, and fail to systematically examine associations between psychological distress, glucocorticoid sensitivity, and systemic inflammation. Accordingly, the primary goal of the current study was to examine the development of glucocorticoid resistance following the onset of a distressing life event, having a child newly diagnosed with cancer, and to examine concomitant changes in psychological distress and inflammation. Based on existing cross-sectional evidence, it was hypothesized that glucocorticoid resistance would increase among mothers across the 12 months following their child’s diagnosis in concert with increases in psychological distress and peripheral markers of inflammation.
2. Methods
2.1 Participants
Data for this study were drawn from a randomized controlled trial designed to examine the efficacy of a supportive stress management intervention. Primary outcomes of the parent project included psychological distress and inflammation. For this trial, one-hundred and twenty female, biological, adoptive or legal-guardian primary caregivers of a child newly diagnosed with any cancer except central nervous system (CNS) tumors or early stage lymphoma were recruited from the Division of Hematology and Oncology, Children’s Hospital of Pittsburgh (CHP) between October, 2010 and February, 2014. Eligibility criteria included (1) no reported clinical history of psychotic or bipolar illness, neurological disorder (stroke, transient ischemic attacks, Parkinson’s disease, multiple sclerosis) or chronic disease known to influence immune function, including cardiovascular disease, cancer [within the past 2 years], or autoimmune disease; (2) not taking medications that might alter responses to questionnaires or indices of immune function (including major sedatives or glucocorticoid, anti-inflammatory, anti-retroviral, or immunosuppressant medication); (3) fluency in English (i.e., have commonly used English in everyday speaking and reading for at least 10 years); (4) at least 18 years of age; and (5) not working nightshifts exclusively. Informed consent was obtained in accordance with the University of Pittsburgh Institutional Review Board.
Maternal caregivers were assessed at 3 time points following their child’s diagnosis: T1 (mean = 1.84 (SD = 0.82) months post dx.), T2 (mean = 6.81 (SD = 1.94) months post dx.), and T3 (mean = 12.74 (SD = 2.20) months post dx.). Eleven mothers did not complete the T2 assessment due to feeling too overwhelmed, losing custody of the child, the child moving to palliative care, bereavement due to losing the child, or lack of compliance with the study protocol. An additional 6 mothers were lost at T3 due to similar reasons. Participants who dropped out did not differ from those who completed the study in age, educational attainment, race, intervention group, the child’s treatment intensity, or T1 measures of distress, glucocorticoid resistance (GCR), or IL-6. GCR was added to the study protocol in July, 2011. Thus, GCR data was collected for 56 individuals at T1, 62 individuals at T2, and 47 individuals at T3. Individuals with GCR data were not significantly different from those missing GCR data at any of the three time points in age, educational attainment, race, the child’s treatment intensity, intervention group, measures of distress, or peripheral levels of IL-6 (see Supplementary Tables S1-S3).
2.2 Procedure
At all three assessment time points, participants met with a research nurse in the pediatric oncology outpatient clinic. Prior to this meeting, participants were instructed to limit physical activity and alcohol intake for 24 hours, and caffeine intake for 3 hours. The nurse administered a medical history and medication use interview, measured participant’s height and weight for calculation of BMI (kg/m2), and drew a blood sample. Participants were rescheduled if they showed signs or reported symptoms of acute illness or allergies, or had taken antibiotics or received a vaccination in the prior 2 weeks. To the extent possible, all 3 visits were scheduled at the same time of day to control for diurnal variation in IL-6. Following the blood draw, participants were given questionnaires to complete and return by mail or to the clinic within 3 weeks.
2.3 Measures
2.3.1 Psychological Distress
Psychological distress was assessed using 3 symptom scales: (1) the Beck Depression Inventory (BDI-II; Beck et al., 1961), (2) the State-Trait Anxiety Inventory-State (STAI-S; Spielberger et al., 1983), and (3) the Impact of Events Scale (IES; Horowitz et al., 1979). The BDI-II is a 21-item measure of depressive symptoms over the past 2 weeks that has good reliability and validity (Beck et al., 1961). Estimates of internal reliability in this sample were .93, .95, and .95 for T1, T2, and T3, respectively. The STAI-S is a well-validated 20-item measure of state anxiety (Spielberger, et al., 1983). Coefficient alpha estimates in this sample were .94, .96, and .96 for T1, T2, and T3, respectively. Finally, the IES is a 15-item measure assessing the psychological impact of a traumatic event (Horowitz et al., 1979). Coefficient alpha estimates in this sample were .85, .89, and .93 for T1, T2, and T3, respectively.
2.3.2 Systemic Inflammation
IL-6 levels were determined from plasma samples extracted from heparinized blood. These samples were frozen at −80°C and analyzed in batches using a high sensitivity quantitative sandwich enzyme immunoassay kit (R&D Systems, Cat # HS600B) run according to manufacturer’s directions. The range of detection for the assay was 0.156 – 10pg/mL. The average intra-assay CV was 7.5% and the inter-assay CV was 8.5%. Values for circulating IL-6 were treated as missing at all time points for individuals reporting a current diagnosis of an immune-related disease and current medication use for that diagnosis (N = 13). Prior to analysis, IL-6 values were natural log transformed to better approximate a normal distribution.
2.3.3 Glucocorticoid Resistance (GCR)
Whole blood was diluted 10:1 with saline (.9% NaCl) and incubated with increasing concentrations of cortisol in the presence of LPS for 18 hours. One positive (stimulated) control containing LPS, but no cortisol, and one negative (unstimulated) control containing neither cortisol nor LPS were included. Final cortisol concentrations were 276, 27.6, 2.76, 0.276, 0.0276 nmol/L. The final concentration of LPS was 2.5ng/mL. Following incubation, plasma supernatants were harvested and stored at −80 °C. The level of stimulated IL-6 in these supernatants was assessed using an enzyme-linked immunosorbant assay (BD, Cat # 555220). The range of detection for the assay was 3.91pg/mL – 300pg/mL. The average intra-assay CV was 3.4%, and the inter-assay CV was 14.5%. The area under the curve (AUC) was calculated using trapezoidal method with zero as ground by plotting stimulated levels of IL-6 (minus the unstimulated controls) at the five concentrations of cortisol (Pruessner et al., 2003; Cohen et al., 2012). Note that a larger AUC corresponds to higher levels of IL-6 production across cortisol concentrations, and thus increased glucocorticoid resistance.
To control for the influence of stress-related changes in circulating numbers of white blood cells or monocytes (Dhabar, 2014; Segerstrom & G. E. Miller, 2004), the absolute number of cells in the whole blood samples was assessed by complete blood count, and the level of IL-6 production per white blood cell (or monocyte) was calculated. Adjusting for white blood cell numbers or monocytes produced similar results; thus, only results correcting for white blood cell count are reported.
2.3.4 Covariates
A number of control variables were examined. These included age, race (coded as white [0] versus other races/ethnicities [1]), years of education, intervention group (coded as standard care control [0] versus intervention [1] group), BMI, and the child’s level of treatment intensity. Treatment intensity was coded on a scale from 0 [least] to 3 [most] intensive by a pediatric oncologist using the Intensity of Treatment Rating Scale (Werba et al., 2007), which considers treatment duration, side effects, and recovery time. This measure has high inter-rater reliability (r = 0.87) and content validity (r = 0.95) (Werba et al., 2007).
2.4 Statistical Analysis
Analyses were performed using SPSS Version 22 (SPSS Inc., Chicago, IL) and Mplus Version 7.4 (Muthen & Muthen, Los Angeles, CA). Data were checked for normality and outliers at each time point. Univariate outliers were indicated by those cases > 3SD above or below the mean; outliers for a specific time point and variable were removed from the data set and treated as missing in analyses. At T1, there were 3 outliers for IL-6 (mean = 19.79 pg/mL, range = 17.86-22.86 pg/mL), and one outlier for GCR (9.7×10⁶ pg-μmol/mL2). At T2, there were 2 outliers for IL-6 (mean = 16.42 pg/mL, range = 14.42-18.42 pg/mL). At T3, there were 3 outliers for IL-6 (mean = 17.40 pg/mL, range = 15.43-19.81 pg/mL). These outliers together accounted for 6 individuals; 3 of these individuals had high values at 2 time points.
Dropout analyses and group comparisons were performed using independent samples t-tests and one-way analysis of variance for continuous variables, and χ2-tests for categorical and dichotomous variables. Preliminary analyses examined relationships between the control variables (age, education, race, treatment intensity, and BMI) and variables of interest (GCR and IL-6) using Pearson correlations for continuous control variables and one-way analysis of variance for categorical variables. For the latent construct of distress, continuous control variables were covaried with distress at each time point, and the distress latent factor was regressed on categorical variables at each time point. The relationships between time since diagnosis at each time point and the variables of interest (distress, GCR, and IL-6) were examined using these same procedures.
Given high bivariate correlations between the 3 measures of distress (IES, STAI-S, and BDI-II) at each time point (T1: r = [.61 – .76]; T2: r = [.64 – .81]; T3: r = [.59 – .78], p’s < .001), we constructed a latent factor for distress at each time point using confirmatory factor analysis, and examined measurement invariance across time (see Supplemental Methods). We then used latent change score (LCS) models to examine mean change in distress, GCR, and IL-6 over time. For model specification, see Supplemental Methods, Figures S1, S2, and S3. All LCS models used maximum likelihood (ML) estimation. Missing data were assumed to be missing at random (MAR) and full information maximum likelihood (FIML) was used in model analyses to accommodate missing data. FIML estimation for missing data is preferred over listwise deletion of data as the latter tends to produce biased, inefficient (lacking in power), and unreliable estimates of parameters, as well as sample selection bias (Schafer & Graham, 2002; Little & Rubin, 1987). All LCS models included age, race, education and the child’s treatment intensity as standard control variables. In addition, BMI was included as a covariate in models that included IL-6 and/or GCR. Latent change score factors were regressed on each control variable. We used chi-square difference (Δχ2) tests for statistical comparison of unconstrained models to models in which the latent change score factor mean was constrained to zero (Satorra and Bentler, 2001). Significant Δχ2 values indicated that change was significantly greater than zero.
Simultaneous LCS models were then used to examine the association between changes in (1) distress and GCR, (2) distress and IL-6, and (3) GCR and IL-6. To do this, we combined the single construct LCS models described above, with the latent change score factor of the outcome variable regressed on the latent change score factor for the predictor variable between complementary time points (see Supplemental Methods, and Figures 1, 2, and 3). As above, we used a Δχ2 difference test to compare the unconstrained model to a model in which these paths were constrained to zero. Significant Δχ2 values indicated that the association between within-subject change in variables was significantly greater than zero.
Figure 1a.
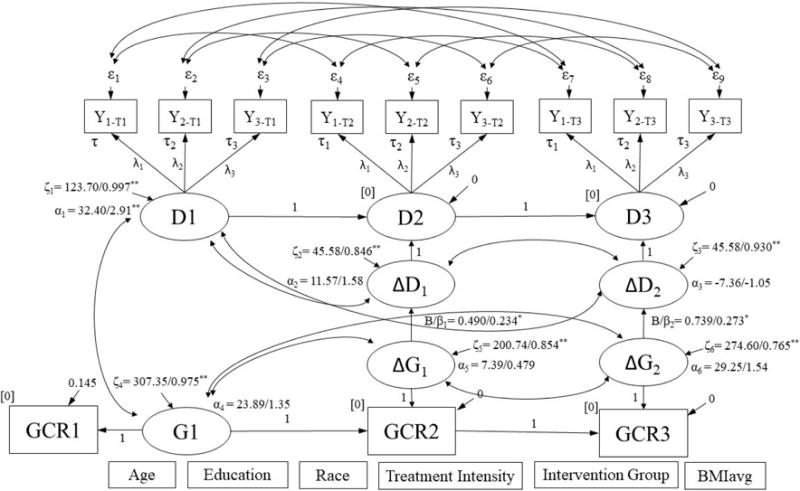
Simultaneous latent difference score model for change in distress predicting change in GCR.
∆D1, ∆D2, ∆G1, and ∆G2 were regressed on covariates listed at bottom of figure. Results are reported as: unstandardized/standardized; *p < .05, **p < .001. Model Fit: χ2 (104) = 110.77, p = .307; RMSEA = 0.023, p = .917; CFI = 0.991; SRMR = 0.081. GCR = glucocorticoid resistance.
Figure 1b.
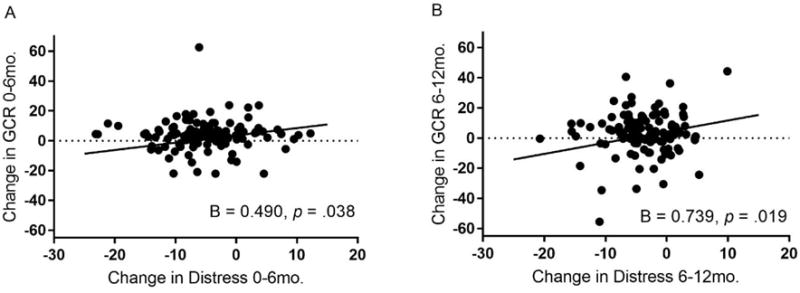
Associations between change in maternal distress and change in GCR across the first and second six months after a child’s diagnosis with cancer.
Adjusted for age, race, education, child’s treatment intensity, intervention group, and body mass index, latent difference scores for maternal distress and glucocorticoid resistance (GCR) were positively associated over the first six months (Plot A) and the second six months (Plot B) after a child’s diagnosis with cancer.
Figure 2a.
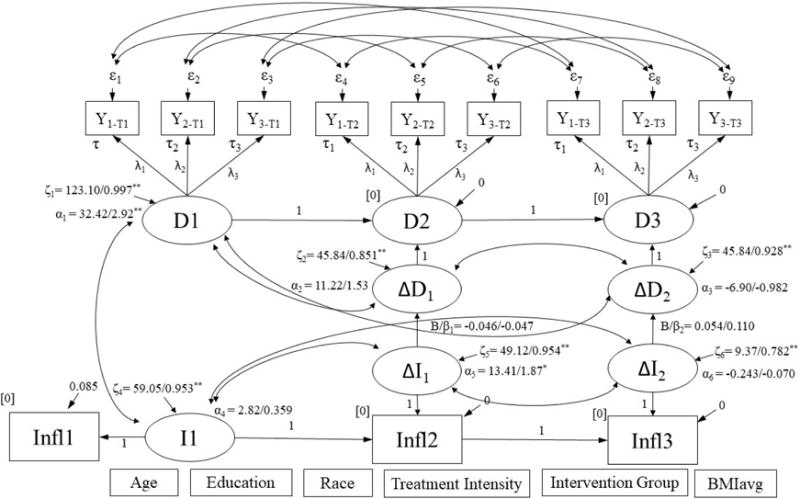
Simultaneous latent difference score model for change in distress predicting change in IL-6.
∆D1, ∆D2, ∆I1, and ∆I2 were regressed on covariates listed at bottom of figure. Results are reported as: unstandardized/standardized; *p < .05, **p < .001. Model Fit: χ2 (104) = 118.11, p = .163; RMSEA = 0.034, p = .825; CFI = 0.983; SRMR = 0.083. IL6 = circulating IL-6.
3. Results
3.1 Sample Characteristics
Demographic characteristics and descriptive data are in Table 1 and inter-correlations between variables are in Table S4. Subjects were on average aged 36 ± 8 years (range: 19-57 years), primarily Caucasian (86%), and had an average of 14 years of education. Bivariate correlations revealed a significant association between lower distress and older age at T1 (T1: r = −0.23, p = .015). Additionally, lower GCR was significantly associated with higher education at T2 and T3 (T2: r = −0.28; T3: r = −0.20; p’s < .001). Further, lower IL-6 was significantly associated with older age (T1: r = −0.18, p < .05; T2: r = −0.26; T3: r = −0.35; p’s < .001), higher education (T1: r = −0.25, p < .001; T2: r = −0.16; T3: r = −0.21; p’s < .05), and greater treatment intensity (T1: F(2, 96) = 3.35, p = .039; T2 : F(2, 78) = 5.45, p = .006, T3: F(2, 67) = 3.38, p = .040).
Table 1.
Means and Standard Deviations for all variables
| Measure | N | Mean | SD | |
|---|---|---|---|---|
| 1 | Age (yrs) | 120 | 35.94 | 7.95 |
| 2 | Education (yrs) | 120 | 13.99 | 2.12 |
| 3 | BMIavg (kg/m2) | 106 | 29.12 | 7.56 |
|
|
||||
| 4 | Race (%Caucasian, W/AA+other) | 120 | 86, 103/17 | |
| 5 | Intervention group (%I, I/C) | 120 | 50, 60/60 | |
| 6 | Treatment Intensity (%most, mild/moderate/very/most) | 119 | 15, 0/34/67/18 | |
|
|
||||
| 7 | Months Since Diagnosis T1 | 120 | 1.84 | 0.82 |
| 8 | BDI T1 | 116 | 18.42 | 11.69 |
| 9 | STAI-S T1 | 117 | 49.98 | 13.89 |
| 10 | IES T1 | 118 | 33.17 | 15.01 |
|
|
||||
| 11 | Glucocorticoid Resistance AUC T1 (pg-μmol/mL2) | 56 | 1.9×10⁶ | 1.8×10⁶ |
| 12 | White Blood Cell Count T1 (109cells/L) | 55 | 6.86 | 1.99 |
| 13 | Glucocorticoid Resistance AUCwbcs T1 (pg-nmol/cell-L) | 52 | 4.42 | 4.17 |
| 14 | BMI T1(kg/m2) | 105 | 28.98 | 7.61 |
| 15 | cIL6 T1 (pg/mL)a | 98 | 1.39 | 1.47 |
|
|
||||
| 16 | Months Since Diagnosis T2 | 102 | 6.81 | 1.94 |
| 17 | BDI T2 | 96 | 17.55 | 12.76 |
| 18 | STAI-S T2 | 97 | 44.69 | 15.45 |
| 19 | IES T2 | 97 | 27.13 | 16.82 |
|
|
||||
| 20 | Glucocorticoid Resistance AUC T2 (pg-μmol/mL2) | 62 | 2.2×10⁶ | 1.7×10⁶ |
| 21 | White Blood Cell Count T2 (109cells/L) | 54 | 7.12 | 2.05 |
| 22 | Glucocorticoid Resistance AUCwbcs T2 (pg-nmol/cell-L) | 54 | 4.88 | 3.92 |
| 23 | BMI T2 (kg/m2) | 84 | 30.06 | 8.08 |
| 24 | cIL6 T2 (pg/mL)a | 80 | 1.43 | 1.23 |
|
|
||||
| 25 | Months Since Diagnosis T3 | 97 | 12.74 | 2.20 |
| 26 | BDI T3 | 85 | 13.64 | 12.14 |
| 27 | STAI-S T3 | 86 | 39.67 | 15.32 |
| 28 | IES T3 | 87 | 23.09 | 17.98 |
|
|
||||
| 29 | Glucocorticoid Resistance AUC T3 (pg-μmol/mL2) | 47 | 2.5×10⁶ | 1.3×10⁶ |
| 30 | White Blood Cell Count T3 (109cells/L) | 38 | 7.08 | 1.60 |
| 31 | Glucocorticoid Resistance AUCwbcs T3 (pg-nmol/cell-L) | 38 | 5.74 | 3.22 |
| 32 | BMI T3 (kg/m2) | 75 | 29.63 | 7.56 |
| 33 | cIL6 T3 (pg/mL)a | 68 | 2.05 | 1.78 |
|
|
||||
Notes: BMI = Body Mass Index; W = White; AA = African American; I = Intervention; C = Control; BDI = Beck
Depression Inventory; STAI-S = State Trait Anxiety Inventory – State version; IES = Impact of Events Scale; AUC = Area under the curve; AUCmonos = Area under the curve adjusted for concentration of monocytes; AUCwbcs = Area under the curve adjusted for concentration of white blood cells; cIL-6 = circulating levels of interleukin-6;
valid inflammation data only
3.2 Models for Change in Distress, GCR, and IL-6
We first examined whether there were any group differences in distress, GCR, or IL-6 as a function of the intervention. Controlling for age, education, race, and the child’s treatment intensity, models in which the paths between intervention group and mean change in distress, IL-6, and GCR from T1 to T2 and from T2 to T2 was constrained to zero were not significantly different from models in which these paths varied freely (See Figures S1, S2 and S3). Given this lack of significant intervention effect, all subsequent models included intervention group as a standard covariate.
Models examining change in distress, GCR, and IL-6 fit the data adequately (See Figures S1, S2, S3, respectively). The model for change in distress over time revealed a non-significant mean increase in distress over the first six months after a child’s diagnosis with cancer (T1 to T2: α (SE) = 11.89 (6.64), p = .073; Δχ2 (1) = 3.24, p = .072), followed by a non-significant mean decrease in distress over the second six months (T2 to T3: α (SE) = −7.93 (6.97), p = .255; Δχ2 (1) = 1.27, p = .260). The model for change in GCR showed a non-significant mean increase in GCR over both the first six months (T1 to T2 (α (SE) = 12.72 (18.99), p = .503; Δχ2 (1) = 0.453, p = .501) and second six months after the child’s diagnosis (T2 to T3 (α (SE) = 13.79 (22.71), p = .544; Δχ2 (1) = 0.369, p = .544). Finally, the model for change in peripheral levels of IL-6 demonstrated a significant mean increase in IL-6 over the first six months after a child’s diagnosis with cancer (T1 to T2: α (SE) = 12.94 (6.43), p = .044; Δχ2 (1) = 4.00, p = .045), followed by a non-significant mean decrease in IL-6 over the second six months (T2 to T3 α (SE) = −0.930 (3.85), p = .809; Δχ2 (1) = 0.059, p = .808). For all three models, the difference score factor variances exhibited significant individual differences in change (distress: T1 to T2: ζ (SE) = 50.81 (10.57); T2 to T3: ζ (SE) = 40.09 (9.97); GCR: T1 to T2: ζ (SE) = 195.99 (44.38); T2 to T3: ζ (SE) = 313.18 (71.31); IL-6: T1 to T2: ζ (SE) = 49.15 (8.14); T2 to T3: ζ (SE) = 9.68 (1.92), all p’s < .001).
3.3 Simultaneous Change in Distress and GCR
The model for the association between change in distress and change in GCR fit the data adequately (See Figure 1a). This model revealed a significant and positive association between change in distress and change in GCR over both time periods of the study (T1 to T2: B (SE) = 0.490 (0.236), p = .038, Δχ2 (1) = 4.24, p = .039; T2 to T3: B (SE) = 0.739 (0.314), p = .019, Δχ2 (1) = 5.07, p = .024) (Figures 1a, 1b). In a model that examined GCR adjusted for concentration of white blood cells (WBCs) (See Figure S4), the significant association between change in distress and change in GCR over the second six months after a child’s diagnosis with cancer was retained (T2 to T3: B (SE) = 0.219 (.072), p = .002, Δχ2 (1) = 7.98, p = .005), while the significant association over the first six months was not (T1 to T2: B (SE) = 0.064 (.068), p = .345; Δχ2 (1) = 0.892, p = .345).
3.4 Models for Change in IL-6
The model for the association between change in distress and change in IL-6 fit the data adequately (See Figure 2a). This model showed no significant association between change in distress and change in inflammation over either 6-month periods of the study (T1 to T2: B (SE) = −0.046 (0.098), p = .643, Δχ2 (1) = 0.225, p = .635; T2 to T3: B (SE) = 0.054 (0.065), p = .403, Δχ2 (1) = 0.713, p = .398) (Figures 2a, 2b). Similarly, the model for the association between change in GCR and change in IL-6 fit the data adequately (See Figure 3a), but showed no significant association between change in GCR and change in peripheral levels of IL-6 over either 6-month periods of the study (T1 to T2: B (SE) = 0.041 (0.071), p = .566, Δχ2 (1) = 0.318, p = .573; T2 to T3: B (SE) = 0.031 (0.030), p = .293, Δχ2 (1) = 1.05, p = .306) (Figures 3a, 3b). A similar pattern was observed when examining GCR adjusted for WBC concentration.
Figure 2b.
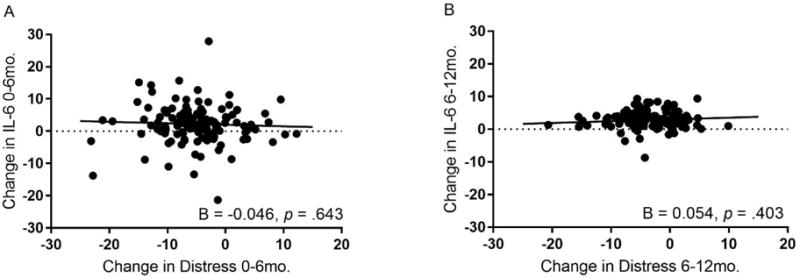
Associations between change in maternal distress and change in IL-6 across the first and second six months after a child’s diagnosis with cancer.
Adjusted for age, race, education, child’s treatment intensity, intervention group, and body mass index, there was no association between latent difference scores for maternal distress and circulating levels of IL-6 over the first six months (Plot A) or the second six months (Plot B) after a child’s diagnosis with cancer.
Figure 3a.
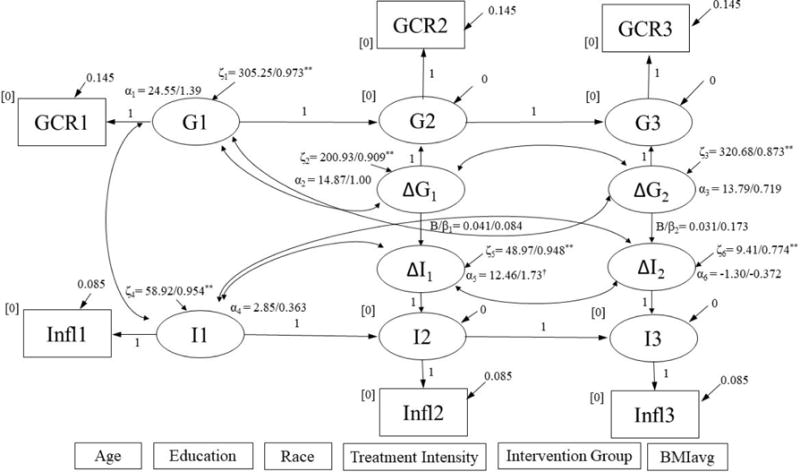
Simultaneous latent difference score model for change in GCR predicting change in IL-6.
∆G1, ∆G2, ∆I1, and ∆I2 were regressed on covariates listed at bottom of figure. Results are reported as: unstandardized/standardized; *p < .05, **p < .001. Model Fit: χ2 (24) = 30.09, p = .182; RMSEA = 0.046, p = .515; CFI = 0.960; SRMR = 0.072. GCR = glucocorticoid resistance; IL-6 = circulating IL-6.
Figure 3b.
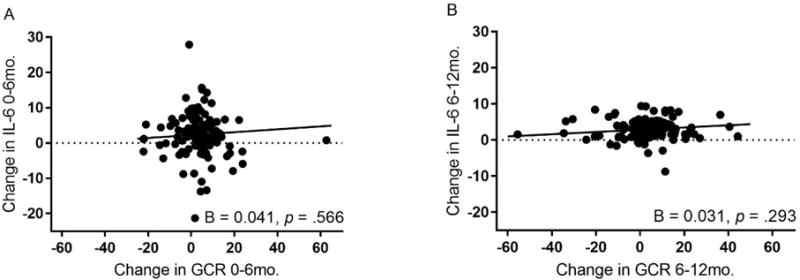
Associations between change in maternal GCR and change in IL-6 across the first and second six months after a child’s diagnosis with cancer.
Adjusted for age, race, education, child’s treatment intensity, intervention group, and body mass index, there was no association between latent difference scores for maternal glucocorticoid resistance (GCR) and circulating levels of IL-6 over the first six months (Plot A) or the second six months (Plot B) after a child’s diagnosis with cancer.
4. Discussion
This study provides new longitudinal evidence for the association of psychological distress with development of glucocorticoid resistance over the 12 months following the onset of a major life event stressor. Specifically, mothers of children newly diagnosed with cancer who endorsed higher levels of distress across the 12 months following their child’s diagnosis showed increased cellular resistance to the anti-inflammatory effects of cortisol. These associations were independent of maternal age, race, years of education, intervention group, and the child’s treatment intensity. Contrary to expectations, although circulating levels of IL-6 increased over the first 6 months following the child’s diagnosis and remained high though the 12-month follow-up, the magnitude of this change was not related to change in level of distress or in cellular sensitivity to glucocorticoids.
In support of having a child diagnosed with cancer as an emotionally provocative stressor, individual responses revealed that some mothers showed heightened levels of distress that were maintained across the follow-up period, with others showing heightened levels of distress shortly after their child’s diagnosis followed by a decline in emotional symptoms. On average, this observed pattern of distress was consistent with other longitudinal studies of psychological responses to having a child diagnosed with cancer (Pai et al., 2007; Vrijmoet-Wiersma et al., 2008). In addition, mothers in our sample reported similar mean levels of distress to other caregiving samples (Rholeder et al., 2009; G. E. Miller et al., 2014), including primary caregivers of children with cancer (Marsland et al., 2013; Kazak et al., 2005; Mullins et al., 2012; G. E. Miller et al., 2002). For example, 59% of our sample reported mild depression or greater (a score of >13 on the BDI-II; Beck et al., 1996) shortly following their child’s diagnosis, falling to 52% at 6 months, and 42% at one year follow-up. For symptoms of post-traumatic stress, 83.9% of the sample reported symptoms above clinically significant cutoffs on the IES at the child’s initial diagnosis, 64.9% at six months, and 51.7% at one year (Horowitz et al., 1979).
Based on current theoretical models (e.g. G. E. Miller et al., 2002) and empirical evidence, we hypothesized that the emotional arousal of the provocative life experience of having a child diagnosed with cancer would result in downregulation of the sensitivity of glucocorticoid receptors. Our findings showed a positive association between change in distress and change in glucocorticoid resistance across the 12 months following stressor onset, providing initial longitudinal support for this pattern. These findings extend cross-sectional evidence reported by G. E. Miller et al. (2002), showing elevated glucocorticoid resistance among parental caregivers of pediatric cancer patients. Although G. E. Miller et al. (2002) did not find a significant association between symptoms of depression and glucocorticoid resistance, they postulated that increased distress in response to the child’s diagnosis resulted in activation of the HPA-axis and peripheral release of cortisol, resulting in the later downregulation of glucocorticoid signaling. Our longitudinal findings lend support to this possibility, providing initial evidence that individual differences in distress across time following a major life stressor moderate sensitivity to glucocorticoids in peripheral immune cells. An examination of the role of stress-related activation of the HPA-axis in the development of glucocorticoid resistance following challenging life circumstances is warranted.
In the current study, glucocorticoid resistance was assessed in vitro using a whole blood assay. This assay involved incubating whole blood with an immune stimulant (LPS) in the presence of increasing concentrations of exogenous cortisol. While whole blood assays are used because they are thought to approximate the in vivo response of the immune system acting in concert to protect against bacterial infection, this approach does not permit an examination of the mechanisms that result in elevated glucocorticoid resistance. For example, it is possible that reduced sensitivity to cortisol is related to decreases in the number, binding affinity, or signaling capacity of the glucocorticoid receptors (Raison & G. E. Miller, 2003). It is also possible that an increase in absolute number of leukocytes and/or monocytes in peripheral circulation, which has been reliably associated with naturalistic stress (Segerstrom & G. E. Miller, 2004), contributes to an increase in production of pro-inflammatory cytokines in the in vitro whole blood assay. In the current study, we did not observe a significant change in mean number of leukocytes in peripheral circulation across the 3 occasions of measurement. However, when we adjusted results of the glucocorticoid resistance assay for number of leukocytes in peripheral circulation, we found that increases in parental distress over the second six months after a child’s initial diagnosis continued to predict concomitant increases in glucocorticoid resistance, but the association between distress and glucocorticoid resistance over the first 6 months was no longer significant. This raises the possibility that during the initial six-month period after a child’s initial cancer diagnosis, decreased cellular sensitivity to cortisol in vitro may at least partially result from an increase in the circulating number of leukocytes. However, more enduring changes in sensitivity, such as those observed over the second six months after a child’s cancer diagnosis, may reflect changes in receptor number, binding capacity, or availability.
In addition to examining glucocorticoid resistance, the current study assessed circulating levels of IL-6. Here, we observed an increase in maternal IL-6 across the 6 months after the child’s diagnosis that was independent of age, years of education, race, the child’s treatment intensity, intervention group, and BMI. These findings are consistent with studies showing increased levels of systemic inflammation among individuals exposed to the stress of caring for a loved one with cancer (Hansel et al., 2010; Kiecolt-Glaser et al., 2003; Rholeder et al., 2009; G. E. Miller et al., 2008). Although we observed parallel mean patterns of change for distress and circulating levels of IL-6, individual differences in the two responses were unrelated over time. Reasons for this are unclear. However, it is possible that elevations in distress and increases in peripheral levels of IL-6 are not concurrent processes. Specifically, in the context of chronic stress, it may be that cumulative distress over time relates more strongly to elevations in peripheral markers of inflammation at later time points. Moreover, it is possible that intermediate processes such as changes in underlying pathways (e.g. GCR) are more proximally related to elevations in distress, resulting in cumulative increases in peripheral IL-6.
We proposed that distress-related changes in glucocorticoid resistance would contribute to increases in peripheral levels of IL-6. Although distress covaried with increased glucocorticoid resistance, this increase in glucocorticoid resistance did not relate to changes in in vivo levels of circulating IL-6. Our findings are consistent with those of Rholeder et al. (2009) who observed an increase in glucocorticoid resistance across a 10-month period among spousal caregivers of patients with brain cancer that was unrelated to changes in circulating levels of IL-6. Indeed, to our knowledge, the only study to show a positive association between glucocorticoid resistance and IL-6 examined levels of IL-6 in nasal secretions in the context of an experimental rhinovirus challenge, and glucocorticoid resistance in an in vitro peripheral blood assay (Cohen et al., 2012). This raises the possibility that glucocorticoid resistance is more strongly associated with levels of IL-6 in the context of an immune challenge, or that this association may not extend to levels of IL-6 more generally available in peripheral circulation.
The current findings also suggest that pathways other than decreased glucocorticoid sensitivity may account for increases in peripheral levels of IL-6 accompanying exposure to chronic stress. One candidate pathway is distress-driven activation of the sympathetic division of the autonomic nervous system, which is known to increase the number and activation of leukocytes (Bellinger & Lorton, 2014; Elenkov et al., 2000). It is also possible that dysregulation of the parasympathetic nervous system could contribute to stress-related increases in peripheral inflammation, with the vagal nerve playing an important role in the down-regulation of inflammation (Martelli, McKinley, & McAllen, 2014; Pavlov & Tracey, 2015). Another possibility is that increases in inflammation could occur through behavioral pathways, such as dysregulation in sleep, which associates with increased peripheral markers of inflammation (O’Connor et al., 2009). In sum, elevations in circulating levels of IL-6 could have occurred in this sample through a number of unexplored pathways.
There are a number of limitations of the current study that should be considered when interpreting findings. First, the parent project was a randomized controlled trial of a psychosocial intervention for mothers of children newly diagnosed with cancer. Although the project provided an opportunity to conduct the first examination of changes in glucocorticoid resistance and IL-6 over time following the onset of an extreme life stressor, it was limited by lack of a control group of mothers of children not diagnosed with cancer. The study could also have benefitted from multiple blood measures on each occasion of testing to better control for diurnal variation and the influence of acute environmental stimuli (e.g., exercise and acute psychological stress; Marsland et al., 2017). It would also be interesting to examine a broader panel of inflammatory mediators and to include the assessment of peripheral cortisol levels at the same time as glucocorticoid resistance. Although glucocorticoid resistance is thought to be relatively stable within individuals (Quax et al., 2013), there is evidence that it changes acutely in response to exercise (DeRijk et al., 1997) and/or brief psychosocial stress (Rholeder et al., 2003; G. E. Miller et al., 2005). Thus, it will be important in future studies to better characterize the intra-individual stability of glucocorticoid resistance over time. Finally, as with any study that estimates missing data that is not missing completely at random, results are subject to biased estimates of parameters, bias in standard errors, and weakened generalizability of findings (Dong & Peng, 2013). However, when the assumptions of FIML are met, FIML has been demonstrated to produce unbiased estimates and valid model fit information (Enders, 2001; Enders & Bandalos, 2001).
Despite these limitations, the current study has a number of strengths. To our knowledge, it is the first study to longitudinally examine changes in the sensitivity of immune cells to the immunosuppressive effects of glucocorticoids following the onset of a highly stressful life event. Moreover, it is the first study to examine longitudinal associations between changes in psychological distress, glucocorticoid resistance, and peripheral levels of IL-6 from the onset of the chronic stressor through one year. Our findings showed that the distress of caring for a child newly diagnosed with cancer predicts increased resistance of immune cells to glucocorticoids, resulting in increased in vitro production of IL-6 in response to endotoxin. Given the substantial health impact of resistance to glucocorticoids, this finding is of potential clinical significance. Glucocorticoids are widely used to treat allergic, inflammatory, and hematologic disorders, as well as for the prevention of allograft rejection (Quax et al., 2013). Increased resistance to such treatments can result in the need for higher doses for effective treatment, which can be associated with serious adverse effects including weight gain, hypertension, type 2 diabetes mellitus, and osteoporosis (Quax et al., 2013). Thus, it is important to identify and understand processes through which the chronic stress of caregiving may confer increased health risk, including changes in glucocorticoid sensitivity.
Supplementary Material
Highlights.
Having a child diagnosed with cancer is a severe life stressor
Maternal psychological distress increased across the 12 mo. following diagnosis
Changes in distress predicted increased glucocorticoid resistance (GCR)
The increase in GCR was accompanied by an increase in plasma IL-6
Acknowledgments
This work was supported by the American Cancer Society RSG118367, the National Institute of Health 4T32HL007560 (CW), and an A. David Lazovik Research Award (CW; University of Pittsburgh, Department of Psychology).
Footnotes
Publisher's Disclaimer: This is a PDF file of an unedited manuscript that has been accepted for publication. As a service to our customers we are providing this early version of the manuscript. The manuscript will undergo copyediting, typesetting, and review of the resulting proof before it is published in its final citable form. Please note that during the production process errors may be discovered which could affect the content, and all legal disclaimers that apply to the journal pertain.
References
- Bauer ME, Vedhara Kavita, Lightman SL, Perks P, Wilcock GK, Shanks Nola. Chronic stress in caregivers of dementia patients is associated with reduced lymphocyte sensitivity to glucocorticoids. Journal of Neuroimmunology. 2000;103:84–92. doi: 10.1016/s0165-5728(99)00228-3. [DOI] [PubMed] [Google Scholar]
- Beck AT, Ward CH, Mendelson M, Mock J, Erbaugh J. An inventory for measuring depression. Archives of General Psychiatry. 1961;4:561–571. doi: 10.1001/archpsyc.1961.01710120031004. [DOI] [PubMed] [Google Scholar]
- Beck AT, Steer RA, Brown GK. Manual for the Beck Depression Inventory-II. San Antonio, TX: Psychological Corporation; 1996. [Google Scholar]
- Bellinger DL, Lorton D. Autonomic regulation of cellular immune function. Auton Neurosci. 2014;182:15–41. doi: 10.1016/j.autneu.2014.01.006. [DOI] [PubMed] [Google Scholar]
- Castro M, Elias LL, Elias PCL, Moreira AC. Physiology and pathophysiology of the HPA axis. In: Bronstein MD, editor. Cushing’s Syndrome. Humana Press; 2011. pp. 1–20. [Google Scholar]
- Cohen S, Janicki-Deverts D, Doyle WJ, Miller GE, Frank E, Rabin BS, Turner RB. Chronic stress, glucocorticoid receptor resistance, inflammation, and disease risk. Proc Natl Acad Sci U S A. 2012;109(16):5995–5999. doi: 10.1073/pnas.1118355109. [DOI] [PMC free article] [PubMed] [Google Scholar]
- Cohen S, Janicki-Deverts D, Miller GE. Psychological Stress and Disease. Journal of the American Medical Association. 2007;298(14):1685–1687. doi: 10.1001/jama.298.14.1685. [DOI] [PubMed] [Google Scholar]
- Cutolo M, Straub RH. Stress as a risk factor in the pathogenesis of rheumatoid arthritis. Neuroimmunomodulation. 2006;13(5–6):277–282. doi: 10.1159/000104855. [DOI] [PubMed] [Google Scholar]
- Dhabhar FS. Effects of stress on immune function: the good, the bad, and the beautiful. Immunologic research. 2014;58(2–3):193–210. doi: 10.1007/s12026-014-8517-0. [DOI] [PubMed] [Google Scholar]
- DeRijk R, et al. Exercise and circadian rhythm-induced variations in plasma cortisol differentially regulate interleukin-1 β (IL-1 β), IL-6, and tumor necrosis factor-α (TNF α) production in humans: High sensitivity of TNF α and resistance of IL-6. J Clin Endocrinol Metab. 1997;82:2182–2191. doi: 10.1210/jcem.82.7.4041. [DOI] [PubMed] [Google Scholar]
- Dong Y, Peng CYJ. Principled missing data methods for researchers. SpringerPlus. 2013;2(1):222. doi: 10.1186/2193-1801-2-222. [DOI] [PMC free article] [PubMed] [Google Scholar]
- Elenkov IJ, Wilder RL, Chrousos G, Vizi ES. The Sympathetic Nerve – An Integrative Interface between Two Supersystems: The Brain and the Immune System. Pharmacological Reviews. 2000;52(4):595–638. [PubMed] [Google Scholar]
- Enders CK. The performance of the full information maximum likelihood estimator in multiple regression models with missing data. Educational and Psychological Measurement. 2001;61(5):713–740. [Google Scholar]
- Enders CK, Bandalos DL. The relative performance of full information maximum likelihood estimation for missing data in structural equation models. Structural equation modeling. 2001;8(3):430–457. [PubMed] [Google Scholar]
- Haapakoski R, Mathieu J, Ebmeier KP, Alenius H, Kivimaki M. Cumulative meta-analysis of interleukins 6 and 1beta, tumour necrosis factor alpha and C-reactive protein in patients with major depressive disorder. Brain Behav Immun. 2015;49:206–215. doi: 10.1016/j.bbi.2015.06.001. [DOI] [PMC free article] [PubMed] [Google Scholar]
- Hansel A, Hong S, Camara RJ, von Kanel R. Inflammation as a psychophysiological biomarker in chronic psychosocial stress. Neurosci Biobehav Rev. 2010;35(1):115–121. doi: 10.1016/j.neubiorev.2009.12.012. [DOI] [PubMed] [Google Scholar]
- Horowitz M, Wilner N, Alvarez W. Impact of Event Scale: a measure of subjective stress. Psychosomatic medicine. 1979;41(3):209–218. doi: 10.1097/00006842-197905000-00004. [DOI] [PubMed] [Google Scholar]
- Kazak AE. Evidence-based interventions for survivors of childhood cancer and their families. Journal of Pediatric Psychology. 2005;30(1):29–39. doi: 10.1093/jpepsy/jsi013. [DOI] [PubMed] [Google Scholar]
- Kiecolt-Glaser JK, Preacher KJ, MacCallum RC, Atkinson C, Malarkey WB, Glaser R. Chronic Stress and Age-Related Increases in the Proinflammatory Cytokine IL-6. Proceedings of the National Academy of Sciences. 2003;100(15):9090–9095. doi: 10.1073/pnas. [DOI] [PMC free article] [PubMed] [Google Scholar]
- Kline RB. Principles and practice of structural equation modeling. Guilford publications; 2015. [Google Scholar]
- Kozyrskyj AL, Mai XM, McGrath P, Hayglass KT, Becker AB, Macneil B. Continued exposure to maternal distress in early life is associated with an increased risk of childhood asthma. Am J Respir Crit Care Med. 2008;177(2):142–147. doi: 10.1164/rccm.200703-381OC. [DOI] [PubMed] [Google Scholar]
- Leserman J, Petitto JM, Gu H, Gaynes BN, Barroso J, Golden RN, Evans DL. Progression to AIDS, a clinical AIDS condition and mortality: psychosocial and physiological predictors. Psychological Medicine. 2002;32(6):1059–1073. doi: 10.1017/s0033291702005949. [DOI] [PubMed] [Google Scholar]
- Little RJA, Rubin DB. Statistical analysis with missing data. New York: Wiley; 1987. [Google Scholar]
- Lovell B, Moss M, Wetherell M. The psychosocial, endocrine and immune consequences of caring for a child with autism or ADHD. Psychoneuroendocrinology. 2012;37(4):534–542. doi: 10.1016/j.psyneuen.2011.08.003. [DOI] [PubMed] [Google Scholar]
- Lovell B, Wetherell MA. The cost of caregiving: endocrine and immune implications in elderly and non elderly caregivers. Neurosci Biobehav Rev. 2011;35(6):1342–1352. doi: 10.1016/j.neubiorev.2011.02.007. [DOI] [PubMed] [Google Scholar]
- Lutgendorf SK, Garand L, Buckwalter KC, Reimer TT, Hong SY, Lubaroff DM. Life stress, Mood Disturbance, and Elevated Interleukin-6 in Healthy Older Women. Journal of Gerontology. 1999;54A(9):M434–M349. doi: 10.1093/gerona/54.9.m434. [DOI] [PMC free article] [PubMed] [Google Scholar]
- Marsland AL, Long KA, Howe C, Thompson AL, Tersak J, Ewing LJ. A pilot trial of a stress management intervention for primary caregivers of children newly diagnosed with cancer: preliminary evidence that perceived social support moderates the psychosocial benefit of intervention. Journal of pediatric psychology. 2013;38(4):449–461. doi: 10.1093/jpepsy/jss173. [DOI] [PMC free article] [PubMed] [Google Scholar]
- Marsland AL, Walsh C, Lockwood K, John-Henderson NA. The effects of acute psychological stress on circulating and stimulated inflammatory markers: A systematic review and meta-analysis. Brain, Behavior, and Immunity. 2017 doi: 10.1016/j.bbi.2017.01.011. [DOI] [PMC free article] [PubMed] [Google Scholar]
- Martelli D, McKinley MJ, McAllen RM. The cholinergic anti-inflammatory pathway: a critical review. Auton Neurosci. 2014;182:65–69. doi: 10.1016/j.autneu.2013.12.007. Retrieved from http://www.ncbi.nlm.nih.gov/pubmed/24411268. [DOI] [PubMed] [Google Scholar]
- Miller AH. Inflammation versus glucocorticoids as purveyors of pathology during stress: have we reached the tipping point? Biol Psychiatry. 2008;64(4):263–265. doi: 10.1016/j.biopsych.2008.05.018. [DOI] [PMC free article] [PubMed] [Google Scholar]
- Miller GE, Chen E, Sze J, Marin T, Arevalo JM, Doll R, Cole SW. A functional genomic fingerprint of chronic stress in humans: blunted glucocorticoid and increased NF-kappaB signaling. Biol Psychiatry. 2008;64(4):266–272. doi: 10.1016/j.biopsych.2008.03.017. [DOI] [PMC free article] [PubMed] [Google Scholar]
- Miller GE, Chen E, Zhou ES. If It Goes Up, Must It Come Down? Chronic Stress and the Hypothalamic-Pituitary-Adrenocortical Axis in Humans. Psychological Bulletin. 2007;133(1):25–45. doi: 10.1037/0033-2909.133.1.25. [DOI] [PubMed] [Google Scholar]
- Miller GE, Cohen S, Ritchey AK. Chronic psychological stress and the regulation of pro-inflammatory cytokines: A glucocorticoid-resistance model. Health Psychology. 2002;21(6):531–541. doi: 10.1037//0278-6133.21.6.531. [DOI] [PubMed] [Google Scholar]
- Miller GE, Murphy ML, Cashman R, Ma R, Ma J, Arevalo JM, Cole SW. Greater inflammatory activity and blunted glucocorticoid signaling in monocytes of chronically stressed caregivers. Brain Behav Immun. 2014;41:191–199. doi: 10.1016/j.bbi.2014.05.016. [DOI] [PMC free article] [PubMed] [Google Scholar]
- Miller GE, Rohleder N, Stetler C, Kirschbaum C. Clinical depression and regulation of the inflammatory response during acute stress. Psychosomatic medicine. 2005;67(5):679–687. doi: 10.1097/01.psy.0000174172.82428.ce. [DOI] [PubMed] [Google Scholar]
- Mullins LL, Fedele DA, Chaffin M, Hullmann SE, Kenner C, Eddington AR, McNall-Knapp RY. A clinic-based interdisciplinary intervention for mothers of children newly diagnosed with cancer: A pilot study. Journal of pediatric psychology. 2012;37(10):1104–1115. doi: 10.1093/jpepsy/jss093. [DOI] [PMC free article] [PubMed] [Google Scholar]
- O’Connor MF, Bower JE, Cho HJ, Creswell JD, Dimitrov S, Hamby ME, Thomas KS. To assess, to control, to exclude: effects of biobehavioral factors on circulating inflammatory markers. Brain, behavior, and immunity. 2009;23(7):887–897. doi: 10.1016/j.bbi.2009.04.005. [DOI] [PMC free article] [PubMed] [Google Scholar]
- Pace TW, Heim CM. A short review on the psychoneuroimmunology of posttraumatic stress disorder: from risk factors to medical comorbidities. Brain Behav Immun. 2011;25(1):6–13. doi: 10.1016/j.bbi.2010.10.003. [DOI] [PubMed] [Google Scholar]
- Pai AL, Greenley RN, Lewandowski A, Drotar D, Youngstrom E, Peterson CC. A meta-analytic review of the influence of pediatric cancer on parent and family functioning. J Fam Psychol. 2007;21(3):407–415. doi: 10.1037/0893-3200.21.3.407. [DOI] [PubMed] [Google Scholar]
- Pavlov VA, Tracey KJ. Neural circuitry and immunity. Immunol Res. 2015;63(1–3):38–57. doi: 10.1007/s12026-015-8718-1. [DOI] [PMC free article] [PubMed] [Google Scholar]
- Potier F, Degryse JM, de Saint-Hubert M. Impact of caregiving for older people and pro-inflammatory biomarkers among caregivers: a systematic review. Aging Clinical and Experimental Research. 2017:1–14. doi: 10.1007/s40520-017-0765-0. [DOI] [PubMed] [Google Scholar]
- Pruessner JC, Kirschbaum C, Meinlschmid G, Hellhammer DH. Two formulas for computation of the area under the curve represent measures of total hormone concentration versus time-dependent change. Psychoneuroendocrinology. 2003;28(7):916–931. doi: 10.1016/s0306-4530(02)00108-7. [DOI] [PubMed] [Google Scholar]
- Quan N, Avitsur R, Stark J, He L, Lai W, Dhabhar F, Sheridan JF. Molecular mechanisms of glucocorticoid resistance in splenocytes of socially stressed male mice. Journal of Neuroimmunology. 2003;137(1–2):51–58. doi: 10.1016/s0165-5728(03)00042-0. [DOI] [PubMed] [Google Scholar]
- Quax RA, Manenschijn L, Koper JW, Hazes JM, Lamberts SW, Van Rossum EF, Feelders RA. Glucocorticoid sensitivity in health and disease. Nature Reviews Endocrinology. 2013;9(11):670–686. doi: 10.1038/nrendo.2013.183. [DOI] [PubMed] [Google Scholar]
- Raison CL, Miller AH. When Not Enough Is Too Much: The Role of Insufficient Glucocorticoid Signaling in the Pathophysiology of Stress-Related Disorders. American Journal of Psychiatry. 2003;160:1554–1565. doi: 10.1176/appi.ajp.160.9.1554. [DOI] [PubMed] [Google Scholar]
- Rohleder N. Stimulation of systemic low-grade inflammation by psychosocial stress. Psychosom Med. 2014;76(3):181–189. doi: 10.1097/PSY.0000000000000049. [DOI] [PubMed] [Google Scholar]
- Rohleder N, Marin TJ, Ma R, Miller GE. Biologic cost of caring for a cancer patient: dysregulation of pro- and anti-inflammatory signaling pathways. J Clin Oncol. 2009;27(18):2909–2915. doi: 10.1200/JCO.2008.18.7435. [DOI] [PubMed] [Google Scholar]
- Rohleder N, Wolf JM, Kirschbaum C. Glucocorticoid sensitivity in humans-interindividual differences and acute stress effects. Stress. 2003;6(3):207–222. doi: 10.1080/1025389031000153658. [DOI] [PubMed] [Google Scholar]
- Satorra A, Bentler PM. A scaled difference chi-square test statistic for moment structure analysis. Psychometrika. 2001;66(4):507–514. doi: 10.1007/s11336-009-9135-y. [DOI] [PMC free article] [PubMed] [Google Scholar]
- Schafer JL, Graham JW. Missing data: our view of the state of the art. Psychological methods. 2002;7(2):147. [PubMed] [Google Scholar]
- Schoneveld OJLM, Cidlowski JA. Glucocorticoids and Immunity: Mechanisms of Regulation. In: Ader R, editor. Psychoneuroimmunology. Vol. 1. Burlington, MA: Elsevier Academic Press; 2007. pp. 45–62. [Google Scholar]
- Segerstrom SC, Schipper LJ, Greenberg RN. Caregiving, repetitive thought, and immune response to vaccination in older adults. Brain Behav Immun. 2008;22(5):744–752. doi: 10.1016/j.bbi.2007.11.004. [DOI] [PMC free article] [PubMed] [Google Scholar]
- Segerstrom SC, Miller GE. Psychological Stress and the Human Immune System: A Meta-Analytic Study of 30 Years of Inquiry. Psychological Bulletin. 2004;130(4):601–630. doi: 10.1037/0033-2909.130.4.601. [DOI] [PMC free article] [PubMed] [Google Scholar]
- Spielberger CD, Gorsuch RL, Lushene R, Vagg PR, Jacobs GA. Manual for the state-trait anxiety inventory. Palo Alto, CA: Consulting Psychologists Press; 1983. [Google Scholar]
- Stark J, Avitsur R, Hunzeker J, Padgett DA, Sheridan JF. Interleukin-6 and the development of social disruption-induced glucocorticoid resistance. Journal of Neuroimmunology. 2002;124:9–15. doi: 10.1016/s0165-5728(02)00004-8. [DOI] [PubMed] [Google Scholar]
- Stark J, Avitsur R, Padgett DA, Campbell KA, Beck FM, Sheridan JF. Social stress induces glucocorticoid resistance in macrophages. Am J Physiol Regulatory Integrative Comp Physiol. 2001;280:R1799–R1805. doi: 10.1152/ajpregu.2001.280.6.R1799. [DOI] [PubMed] [Google Scholar]
- Steptoe A, Kivimaki M. Stress and cardiovascular disease: an update on current knowledge. Annu Rev Public Health. 2013;34:337–354. doi: 10.1146/annurev-publhealth-031912-114452. [DOI] [PubMed] [Google Scholar]
- Tosevski DL, Milovancevic MP. Stressful life events and physical health. Current Opinion in Psychiatry. 2006;19:184–189. doi: 10.1097/01.yco.0000214346.44625.57. [DOI] [PubMed] [Google Scholar]
- Tsigos C, Chrousos G. Hypothalamic-pituitary-adrenal axis, neuroendocrine factors and stress. Journal of Psychosomatic Research. 2002;53:865–871. doi: 10.1016/s0022-3999(02)00429-4. [DOI] [PubMed] [Google Scholar]
- Von Kanel R, Dimsdale JE, Mills PJ, Ancoli-Israel S, Patterson TL, Mausbach BT, Grant I. Effect of Alzheimer Caregiving Stress and Age on Frailty Markers Interleukin-6, C-Reactive Protein, and D-Dimer. Journal of Gerontology. 2006;61A(9):963–969. doi: 10.1093/gerona/61.9.963. [DOI] [PubMed] [Google Scholar]
- Vrijmoet-Wiersma CM, van Klink JM, Kolk AM, Koopman HM, Ball LM, Maarten Egeler R. Assessment of parental psychological stress in pediatric cancer: a review. J Pediatr Psychol. 2008;33(7):694–706. doi: 10.1093/jpepsy/jsn007. [DOI] [PubMed] [Google Scholar]
- Werba BE, Hobbie W, Kazak AE, Ittenbach RF, Reilly AF, Meadows AT. Classifying the intensity of pediatric cancer treatment protocols: The intensity of treatment rating scale 2.0 (ITR‐2) Pediatric blood & cancer. 2007;48(7):673–677. doi: 10.1002/pbc.21184. [DOI] [PubMed] [Google Scholar]
Associated Data
This section collects any data citations, data availability statements, or supplementary materials included in this article.