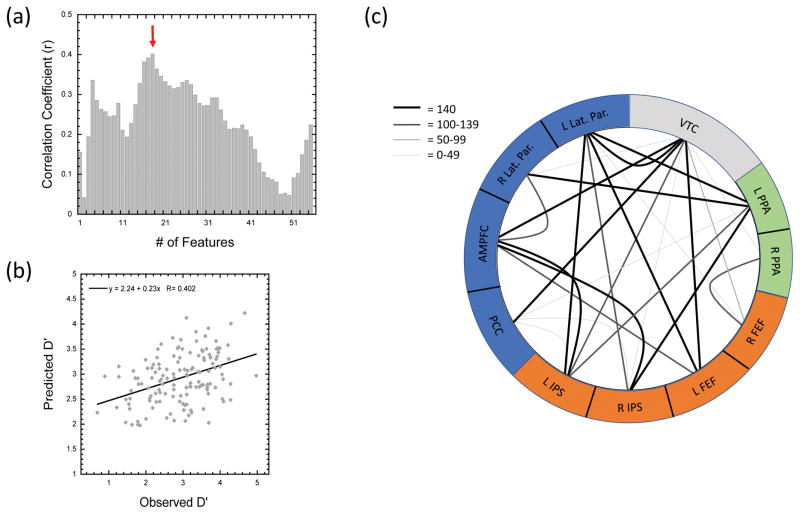
Figure 9. Predicting Individual Differences in Performance.
Results of the leave-one-subject-out multiple linear regression analysis. (a) Pearson’s r correlation coefficient between the measured and predicted d′ score as a function of the number of features (connections) used in the model. (b) Scatterplot showing the relationship between the measured and predicted d′ scores for all 140 participants in the 18-feature regression model. (c). Figure showing the 25 connections selected at least once between the 10 nodes of the PPA, DMN, and DAN ROIs, and the VTC in the 18-feature regression model. The color and weight of the connection show the number of folds that each of the connections was selected as a feature in the prediction model (max = 140 folds).

