

Abstract
In exocrine acinar cells, Ca2+-activated Cl− channels in the apical membrane are essential for fluid secretion, but it is unclear whether such channels are important for Cl− uptake at the base. Whole-cell current recording, combined with local uncaging of caged Ca2+, was used to reveal the Cl− channel distribution in mouse pancreatic acinar cells, where ≈90% of the current activated by Ca2+ in response to acetylcholine was carried by Cl−. When caged Ca2+ in the cytosol was uncaged locally in the apical pole, the Cl− current was activated, whereas local Ca2+ uncaging in the basal or lateral areas of the cell had no effect. Even when Ca2+ was uncaged along the whole inner surface of the basolateral membrane, no Cl− current was elicited. There was little current deactivation at a high cytosolic Ca2+ concentration ([Ca2+]c), but at a low [Ca2+]c there was clear voltage-dependent deactivation, which increased with hyperpolarization. Functional Ca2+-activated Cl− channels are expressed exclusively in the apical membrane and channel opening is strictly regulated by [Ca2+]c and membrane potential. Ca2+-activated Cl− channels do not mediate Cl− uptake at the base, but acetylcholine-elicited local [Ca2+]c spiking in the apical pole can regulate fluid secretion by controlling the opening of these channels in the apical membrane.
Fluid secretion in secretory epithelial cells requires polarized distribution of ion channels and transporters. These cells possess Cl− channels localized in the luminal (apical) plasma membrane, which are essential for the secretion of the Cl− rich fluid (1–7). In many exocrine acinar cells the main stimulus for fluid secretion is an elevation of cytosolic Ca2+ concentration ([Ca2+]c), and the Cl− channels belong to the class of Ca2+-activated pores (8, 9). In most exocrine glands, but not in the mouse and rat pancreatic acinar cells, there are also Ca2+-activated K+ channels (10), which provide the route for the agonist-elicited cellular K+ release, originally demonstrated in the salivary glands (11). These channels are useful for Cl− secretion, as the negative cell interior is a major part of the electrochemical driving force for Cl− exit through the luminal membrane (5, 10). Some of the Ca2+-activated K+ channels are located in the luminal membrane (12, 13).
Cl− channels are essential for the release of cellular Cl− into the exocrine acinar lumen (14, 15), but it is unclear how the equally important Cl− uptake across the basolateral membrane occurs. One hypothesis is based on uptake by means of Ca2+-dependent Cl− channels in the basal membrane (3, 16–18), whereas others have proposed uptake by means of Na+,K+,2Cl− co-transport and a combination of Na+/H+ and Cl−/HCO exchangers (5, 10, 14, 15). Kasai and his collaborators (17, 18) proposed a model for Cl− secretion based on differential regulation of luminal and basal Cl− channels. They showed that the cytosolic Ca2+ wave in pancreatic acinar cells, elicited by supramaximal acetylcholine (ACh) stimulation, always starts in the apical (granular) pole and then spreads to the base. The initial [Ca2+]c rise in the apical pole opens Cl− channels in the apical plasma membrane allowing Cl− movement into the acinar lumen. These Cl− channels would rapidly deactivate and the subsequent rise of [Ca2+]c in the basal part of the cell would result in the opening of basal Cl− channels. This would occur together with activation of Ca2+-dependent nonselective cation channels in the basal membrane (19). The opening of these cation channels would depolarize the cell membrane beyond the Cl− equilibrium potential and therefore reverse the electrochemical gradient for Cl− so that it would now favor Cl− movement into the cell. This two-phase “push-pull” model, based on repetitive propagating cytosolic Ca2+ waves, could in principle explain acinar fluid secretion (17, 18).
The Marty–Kasai model for exocrine fluid secretion (3, 16–18) depends critically on two factors: (i) the presence of Ca2+-activated Cl− channels in the basal membrane and (ii) rapid deactivation of the Ca2+-activated Cl− channels in the luminal membrane. We have tested both of these points. By using a technology by which caged Ca2+ in the cytosol can be uncaged locally in specific predetermined parts of a cell, the distribution of Ca2+-activated Cl− channels was assessed by patch-clamp whole-cell current recording. Most of the Ca2+-activated current was carried by Cl−, and there was relatively little activation of the Ca2+-dependent nonselective cation current. Local uncaging of Ca2+ caged by nitrophenyl-EGTA (NP-EGTA) in various parts of the cell revealed that the Ca2+-activated Cl− channels were exclusively localized in the apical membrane. Furthermore, these Cl− channels were tightly regulated by [Ca2+]c as well as by the membrane potential. A high [Ca2+]c kept the channels open without deactivation, but a low [Ca2+]c prompted channel closure. Depolarization inhibited the deactivation of the channel, whereas hyperpolarization enhanced the deactivation. These results are incompatible with the push–pull model. The absence of Ca2+-activated Cl− channels in the basal membrane indicates that Cl− uptake must occur by means of cotransporters and/or exchangers. The activation and deactivation characteristics of the Cl− channels indicate that the Cl− channels do not close as long as [Ca2+]c is high and the cell is depolarized.
Materials and Methods
Cell Preparation and Solutions.
Single isolated mouse pancreatic acinar cells were prepared by using collagenase (Worthington, Lorne Laboratories, Reading, U.K.) digestion as described (20). The extracellular bathing solution contained 140 mM NaCl, 4.7 mM KCl, 1.13 mM MgCl2, 1 mM CaCl2, 10 mM glucose, and 10 mM Hepes. The pH was 7.3, adjusted by NaOH. In some experiments Na+ or Cl− was replaced by the same concentrations of N-methyl-d-glucamine (NMDG+) or aspartate−. The intracellular pipette solution contained 135 mM KCl, 1.13 mM MgCl2, 20 mM NaCl, 10 mM Hepes, 2 mM Na2ATP, and 0.1 mM EGTA (pH 7.2, adjusted by KOH). In experiments requiring a low K+ concentration, we used 140 mM NMDG-Cl, 1.13 mM MgCl2, 10 mM Hepes, 2 mM Na2ATP, and 0.1 mM EGTA (pH 7.2, adjusted by Tris). In Cl−-free solution, we replaced Cl− with equimolar aspartate− (all chemicals from Sigma). The cells, placed on a glass coverslip attached to an open perifusion chamber, were continuously perifused from a gravity-fed system. All experiments were performed at room temperature (20–24°C).
Cytosolic Ca2+ Measurements.
[Ca2+]c was measured as described (21). Fura-2 (Sigma) was included in the pipette solution (80–100 μM). Fluorescence images were captured by using a Nikon Diaphot inverted microscope (Nikon; 40× oil-immersion objective), equipped with an intensified charge-coupled device camera (Photonic Science, Robertsbridge, U.K.) and recorded on a QuantiCell station (Applied Imaging, Gateshead, U.K.). Alternate excitation wavelengths of 340 and 380 nm from a xenon light source were used, and the emission fluorescence was collected through a long-pass filter of 430 nm. The ratio (340:380) of fluorescence intensities was used to calculate [Ca2+]c. The fura-2 fluorescence ratio was calibrated by using exposure to 10 or 15 μM ionomycin (Sigma) and 10 mM Ca2+ or 10 mM EGTA.
Local Uncaging of Ca2+ from the Caged Compound, NP-EGTA, and Confocal Ca2+ Measurements.
To increase local [Ca2+]c within a single cell, the local bleaching function of the Zeiss 510 confocal microscope was used. In this case, the patch pipette contained 1.0–1.5 mM NP-EGTA and 80 μM Fluo-4 (Molecular Probes). For [Ca2+]c measurements, the 488-nm laser line and a long-pass emission filter of 505 nm were used. To uncage NP-EGTA, the 351-nm UV laser line was used. We used the Zeiss C-apochromat lens (63×, numerical aperture = 1.2, water immersion) and scanzoom (special Zeiss zooming function) = 3.9 or 3.5. The electrical signal was synchronized by using a trigger pulse generated from the Zeiss confocal microscope.
Patch-Clamp Whole-Cell Current Recording.
Standard patch-clamp whole-cell current recording was used (22). The electrophysiological recording of Ca2+-sensitive Cl− and nonselective cation current was made by using the EPC-8 patch clamp amplifier (List Electronics, Darmstadt, Germany). The pipette resistance was 2–3 MΩ. A seal resistance of >10 GΩ was produced on the membrane and kept at a value of at least 3 GΩ throughout the experiment. For the Cl−-free pipette solution, the special pipette holder described by Snyder et al. (23) was used. The detailed procedure has previously been described (21).
Results
Ca2+-Activated Currents in Pancreatic Acinar Cells.
ACh elevates [Ca2+]c in pancreatic acinar cells through activation of inositol 1,4,5-trisphosphate receptors (9, 24, 25). The increased [Ca2+]c can open two types of channels, which are permeable to Cl− and monovalent cations, respectively (26). Fig. 1 shows the Ca2+-activated Cl− current recorded with extracellular (bath) and intracellular (pipette) solutions in which Na+ and K+ were replaced by NMDG+. ACh elicited a large inward Cl− current at the holding potential of −30 mV (Fig. 1 A and B), which slowly decreased. As previously reported, this finding results from slow depletion of the endoplasmic reticulum (ER) Ca2+ store and the consequent decrease of [Ca2+]c (21). When extracellular NMDG+ was replaced by Na+ there was hardly any change in the inward current (Fig. 1A) (n = 6), indicating that nonselective cation channels play a minor role under these conditions. This observation agrees with data showing that the carbachol-evoked depolarization in rat pancreatic acinar cells was hardly affected by replacing external Na+ with NMDG+ (27). In other experiments, step voltage pulses were applied at various times and the resulting currents were recorded (Fig. 1B). The I–V relationships are shown in Fig. 1C. At the initial ACh-elicited current peak, the I–V relationship was linear (Fig. 1Ba), but several minutes after application of ACh the current became outwardly rectified (Fig. 1Bb). Similar results were obtained in six separate cells.
Figure 1.
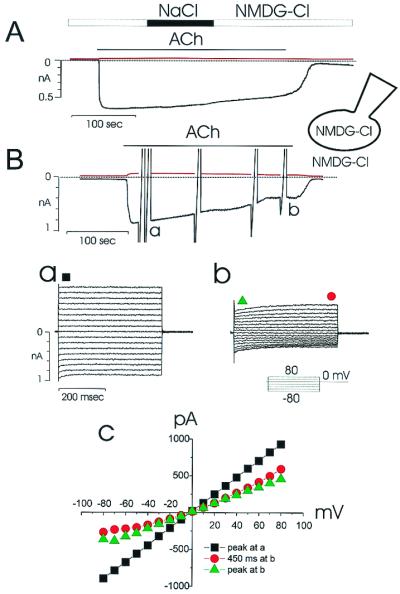
ACh activation of Ca2+-dependent Cl− current in a single pancreatic acinar cell. Small monovalent cations (Na+ and K+) were replaced by NMDG+ in both the bath and pipette solutions, as shown in the cartoon representing the recording configuration. (A) Repetitive depolarizing voltage pulses to 0 from the holding potential of −30 mV were applied, so that two quasisimultaneous current recordings, at −30 mV (black trace) and 0 mV (red trace) were obtained. The equilibrium potential for both NMDG+ and Cl− was 0 and whereas a clear inward current is elicited by ACh (10 μM) at −30 mV, there is virtually no current response to be seen at 0 mV. During ACh stimulation, in the period indicated, extracellular NMDG+ was replaced by Na+, but this had no effect on the inward current, indicating that all of the inward current is carried by Cl− outflow. (B) During ACh (10 μM) stimulation, step voltage pulses from the holding potential of 0 up to −80 or 80 mV were applied, at the peak (a) and later in the response (b). The I–V relationships are plotted in C. The black squares are from Ba, whereas the green triangles and red circles are from the beginning and end, respectively, of the pulses shown in Bb. Note the different time-dependent patterns of the currents and the different shapes of the I–V relations (C) at the peak (Ba) and later (Bb) in the ACh response.
To evaluate the cationic current elicited by ACh, recordings were made under Cl−-free conditions. All Cl− in both the patch pipette and bathing solutions was replaced by equimolar aspartate−. The current activated by ACh (10 μM) under this Cl−-free condition (Fig. 2) was much smaller (<10%) than the Cl− current response shown in Fig. 1. Replacing extracellular Na+ by NMDG+ caused a sharp and reversible decrease in the inward current (Fig. 2), suggesting that the dominant channel operating in this abnormal condition is permeable to small cations (26).
Figure 2.

ACh (10 μM) activation of Ca2+-dependent cation current (at a membrane potential of −30 mV). (A) All Cl− in the bath and pipette solutions was replaced by aspartate−. During the ACh stimulation all extracellular Na+ was replaced by NMDG+, which caused a marked and fully reversible reduction in the inward current. (B) Comparison of the ACh-elicited inward current under different ionic conditions. The first column represents data from 18 experiments with a NaCl-rich solution in the bath and a KCl-rich solution in the pipette. The second column represents data obtained from 7 experiments with NMDG-Cl solutions in both the pipette and the bath, whereas the last column represents data from 10 experiments of the kind shown in A with sodium aspartate in the bath and potassium aspartate in the pipette. There was no statistical difference between the first two groups (Student's t test, P > 0.05). The mean current in the third group was statistically different from the currents in the first two groups (P < 0.05).
To determine the relative sizes of the Ca2+-activated Cl− and cation currents, the peak current was determined under different ionic conditions. The results are summarized in Fig. 2B. When the patch pipette contained a KCl-rich solution, the current amplitude was 29.7 ± 1.9 pA/pF (n = 18). In the case of a cation-free solution (NMDG-Cl), the current was 29.6 ± 1.8 pA/pF (n = 7). This difference is not statistically significant (P < 0.05). These results confirm that there is very little Na+ inward current evoked even by a supramaximal ACh concentration. When the Cl−-free solutions are used, the peak current was only 3.5 ± 1.0 pA/pF (n = 10).
Voltage- and Ca2+-Dependent Modulation of Ca2+-Activated Cl− Current.
As shown in Fig. 1, the ACh-elicited inward Cl− current declines slowly with time. This decline could be explained by a gradual reduction in [Ca2+]c, because the amplitude of the peak current is inversely correlated with [Ca2+]c below a certain value (Fig. 3) (n = 4). This finding is in agreement with a detailed study of the Ca2+ control of Cl− channels in the excised oocyte membrane, in which it was shown that the Ca2+-dependent Cl− current provides a reliable measure of the submembraneous Ca2+ concentration (28). There is almost no rapid deactivation of the Cl− current in the initial period of ACh stimulation (Fig. 1Ba), but the rapid deactivation at the negative potentials is noticeable several minutes later (Fig. 1Bb).
Figure 3.

Simultaneous recordings of [Ca2+]c and the Ca2+-activated Cl− current. The patch pipette contained 80 μM fura-2. Step voltage pulses to −80 mV were applied every 10 sec from the holding potential of 0 mV, and the peak current was plotted. As soon as 10 μM ACh was applied, [Ca2+]c increased markedly and the Cl− current was activated. Thereafter, [Ca2+]c decreased, and below a certain threshold the Cl− current also declined. Below this threshold, the peak current reflected [Ca2+]c reasonably well.
To demonstrate the voltage-dependent relaxation kinetics of the current, step pulses to −80 mV from various holding potentials (−90 to +30 mV) were applied (Fig. 4A). The relaxation kinetics calculated from Fig. 4A are plotted in Fig. 4B. The deactivation started near +20 mV, and the current was maximally deactivated at −70 mV. However, about 50% of the current did not deactivate, even at a membrane potential of −70 mV. Membrane-potential changes in the range −50 to 0 mV occur in this cell type (29). The deactivation process is similar to what has been reported for Ca2+-activated Cl− channels in Xenopus oocytes (30).
Figure 4.

Deactivation kinetics of Ca2+-activated Cl− current. The current was recorded 2–4 min after application of 10 μM ACh. (A) Step pulses to −80 mV (voltage protocol shown at the top) were applied from various potentials held for 9.5 sec and the resulting currents were recorded. (B) Relative deactivation curve was calculated from five cells (mean value ± SE). The current amplitude at +30 mV was regarded as 100%. Maximal deactivation was observed at −70 mV, but only about 50% of the current was deactivated. There was no deactivation at potentials more positive than +20 mV.
These data show that the opening of the Ca2+-activated Cl− channel is regulated by both [Ca2+]c and voltage. Maximal ACh stimulation elicits a membrane depolarization of about 20–30 mV from the resting potential of about −50 mV in these cells (5, 29). Such a depolarization would tend to reduce the time-dependent deactivation of the Ca2+-activated Cl− current (Fig. 4). A high [Ca2+]c keeps the Cl− channel open and depolarization of the membrane further helps to maintain a high Cl− conductance. These data do not agree with the push–pull model, in which Cl− channels in the luminal membrane must deactivate rapidly at a time when [Ca2+]c is still rising and the membrane therefore is depolarized (18). However, as soon as [Ca2+]c falls, the channels begin to close (Fig. 3) and repolarization occurs. The more negative membrane potential will now further deactivate the Cl− channels (Fig. 4), contributing to a more rapid cessation of the response.
Localization of Ca2+-Activated Cl− Channels.
In earlier work, Cl− channel localization was assessed by cell-attached patch pipettes (31). However, because these channels have a very low unit conductance (a few picosiemens; ref. 3), there is a risk of both false positive and false negative results. The earlier results indicated that the luminal plasma membrane contains low-conductance Cl− channels, which could be activated by cholinergic stimulation, but no evidence was presented demonstrating that these were Ca2+-activated pores (31). The results from the basal membrane were unclear. In the majority of the membrane patches there were no Cl− channels, but a minority showed some apparent Cl− channel activity (31). In the present study, the localization of the Ca2+-activated Cl− channels was investigated directly by a combination of local uncaging of caged Ca2+, by using a confocal microscope, and patch-clamp whole-cell current recording. The current and [Ca2+]c responses to local Ca2+ uncaging in the basal and apical poles of single acinar cells were tested. Fig. 5 shows one of the representative data sets (n = 8) from an experiment in which the patch pipette contained 80 μM Ca2+-sensitive fluorescent probe Fluo-4 and 1.5 mM of the Ca2+ caging compound NP-EGTA. By using the local bleaching function of the Zeiss confocal microscope, it was possible to uncage caged calcium in specific preselected parts of the cytosol. These specific (color-coded) areas of local uncaging are shown in Fig. 5B. At first, Ca2+ was uncaged in a small part of the basal region (Fig. 5C). The resulting increase in [Ca2+]c was confined to the basal area and was not propagated into the lateral or apical parts of the cell. In this condition, no current was activated (Fig. 5C). Thereafter, Ca2+ was uncaged in one part of the lateral area of the cell, but again no Ca2+-activated current was detected (Fig. 5D). However, when Ca2+ was uncaged in the apical part of the cell, a clear inward current was observed in response to each uncaging event (Fig. 5E). Similar results were obtained in eight separate cells. When Ca2+ was uncaged along the entire inner surface of the basolateral membrane, no significant current activation was observed (Fig. 5F). These results show that the Ca2+-activated channels are localized exclusively in the luminal membrane.
Figure 5.

Local uncaging of caged Ca2+ (NP-EGTA) and recording of Ca2+-activated Cl− current. The patch pipette contained 80 μM Fluo-4 and 1.2 mM NP-EGTA. To increase [Ca2+]c locally, we used the local uncaging function of the confocal microscope to uncage Ca2+ specifically in the subcellular regions outlined in different colors in B and at the same time recorded [Ca2+]c (traces color-coded according to the region of interest) and the Cl− current at a holding potential of −30 mV (black traces). The colored traces represent Fluo-4 intensity changes (F/F0) in the various areas of uncaging. To the left are shown the Fluo-4 ratio images (F/F0 images), providing a map of [Ca2+]c across the cell (the “cold” colors, blue–green, representing low [Ca2+]c, whereas the “warm” colors, yellow–red, indicate higher levels of [Ca2+]c). (A) [Ca2+]c map showing relatively uniform [Ca2+]c throughout the cell before Ca2+ uncaging. (B) Transmitted light image showing the granular area at the top. The four areas selected for Ca2+ uncaging are shown in different colors. The patch pipette (whole-cell configuration) is seen in the lower right corner. (C) Ca2+ uncaging in small basal area (≈35 μm2; red in B). Highly localized rises in [Ca2+]c are seen at the base after each uncaging event, but there is no Cl− current activation. (D) Repetitive Ca2+ uncaging in small lateral area (≈35 μm2) causes highly localized [Ca2+]c rises, but no current activation. (E) Ca2+ uncagings in the apical granular pole (≈30 μm2) cause highly localized [Ca2+]c rises and clear Cl− current activations. (F) Repetitive Ca2+ uncagings in a larger area (≈80 μm2), adjacent to the whole of the basolateral membrane, cause [Ca2+]c rises in that part of the cell, but fail to activate the Cl− current.
Local uncaging of Ca2+ was also carried out in small acinar cell clusters (four or five cells) to localize the channels in cells with a more normal shape in a more physiological environment (Fig. 6). One of the cells, showing a clear demarcation between lateral and apical membranes, was patched (whole-cell configuration). Therefore only one of the cells in the cluster contained the Ca2+-sensitive reporter dye and the caged calcium compound. In this condition, uncaging of Ca2+, specifically in a region close to the lateral membrane (Fig. 6A, black oval), did not elicit any current response (Fig. 6D). However, when Ca2+ was uncaged specifically in the apical pole (Fig. 6A, red circle), clear activation of the Ca2+-dependent current was observed (Fig. 6E).
Figure 6.

Local uncaging of caged Ca2+ (NP-EGTA) and recording of Ca2+-activated Cl− current in a pancreatic acinar cell cluster. (A) Confocal fluorescence image showing the uniform [Ca2+]c throughout the cell in the resting situation and the two selected areas of interest (red and black). (B) Transmitted light image of the cell cluster with the cell under investigation marked red. The dark granular areas in the apical parts of each of the cells are seen. The patch pipette is seen to the right. (C) Cartoon showing the recording configuration. (D) Repetitive Ca2+ uncagings in the lateral area (≈15 μm2; marked black in A) elicit repetitive increases in [Ca2+]c in that same area, but no Cl− current activation. (E) Repetitive Ca2+ uncagings in the apical granular pole (≈15 μm2) evoke [Ca2+]c rises in that part of the cell and clear Cl− current activations.
The reversal potential of the current activated by uncaging Ca2+ in the apical pole was determined. In these experiments, the Cl− equilibrium potential was −47 mV, clearly different from the potential (0) at which there would be no net current flow through open nonselective cation channels. When Ca2+ was uncaged at the various membrane potentials, the Ca2+-dependent current was repetitively activated (Fig. 7). To detect the variability in the [Ca2+]c change during repetitive uncaging in the same experiment, the current was recorded simultaneously at the test potential and at 0 mV. The recordings proceeded orderly, step by step, from −50 to + 30 mV. As seen in Fig. 7A, the current amplitude at 0 mV decreased from bottom to top, most likely because of a gradual reduction in the amount of available NP-EGTA in the cell, as it was gradually “consumed,” combined with a relatively slow diffusion of new NP-EGTA into the cell from the pipette solution. Nonetheless, a clear reversal potential at about −40 mV was detected, which is close to the calculated Cl− equilibrium potential (Fig. 7A). In Fig. 7B, the I–V relationship is plotted after normalization, taking into account the peak values at 0 mV. These data indicate that the major current carrier in these experiments is Cl−.
Figure 7.

I–V relationship and equilibrium potential determination for the current activated by Ca2+ uncaging in the granular apical pole. The patch pipette contained 22 mM Cl− and the calculated Cl− equilibrium potential was −47 mV. (A) Voltage pulses from 0 mV to the test potential were repetitively applied, and for each Ca2+ uncaging event the current response was recorded both at the test potential (+30 mV to −50 mV) and at the holding potential (0 mV). As seen in both A and B, the reversal potential for the current elicited by Ca2+ uncaging was about −40 mV. The consistent decrease of the current amplitude measured at 0 mV from the bottom trace to the top is because of gradual decrease of the available amount of NP-EGTA within the cell. (B) I–V relationship of the current elicited by Ca2+ uncaging. Current amplitudes resulting from four separate uncagings were averaged and normalized, taking into account the changes in the current amplitudes measured at 0 mV.
Discussion
Our results indicate that in pancreatic acinar cells, the Ca2+-activated Cl− channels are localized exclusively in the apical part of the plasma membrane. The pancreatic acinar cell provides the classic example for vectorial protein secretion, because the exocytotic events occur exclusively through the luminal plasma membrane (32, 33). Cytosolic Ca2+ signaling is also polarized. Low (physiological) levels of secretagogues elicit repetitive cytosolic Ca2+ spikes, which most of the time are confined to the apical pole of the cell (24, 34, 35). The specific and exclusive localization of Ca2+-activated Cl− channels in the apical plasma membrane, demonstrated in the present work, ensures that fluid secretion can proceed only in the direction of the acinar lumen. This neutral Cl−- and enzyme-rich fluid is produced in response to ACh or cholecystokinin stimulation (36), and this process is Ca2+-dependent (15).
Our findings do not agree with the push–pull model for acinar fluid secretion (3, 16–18). We have tested two critical aspects of the model: (i) rapid deactivation of Cl− channels in the luminal membrane and (ii) the presence of Ca2+-activated Cl− channels in the basolateral membrane. The absence of Ca2+-activated Cl− channels in the basolateral membranes (Figs. 5 and 6) is our most crucial finding, but it is also clear that the rapid deactivation of the Cl− channels in the luminal membrane that, according to the push–pull model, must occur at a time when [Ca2+]c is still rising and the cell still further depolarizing (see figure 6 in ref. 18) could not be observed (Figs. 1, 3, and 4).
The physiological role of the Ca2+-dependent nonselective cation channel in pancreatic acinar cells (19) remains unclear (5). Opening channels that would mediate a run down of the transmembrane Na+ and K+ gradients, which are produced by the Na+/K+ pump under expenditure of much energy, seems undesirable, but these channels can nevertheless be activated by both ACh and cholecystokinin stimulation in intact cells (19, 26). However, the data presented here indicate that the nonselective cation channels mediate only a very small fraction of the total current activated by even supramaximal ACh stimulation (Figs. 1 and 2).
ACh-elicited fluid secretion should be regulated by repetitive cytosolic Ca2+ spiking in the apical granular pole (34), exactly as the exocytotic enzyme secretion (33, 37). This concept is in contrast to the requirement for repetitive cytosolic Ca2+ waves propagating throughout the cell in the push–pull model (17, 18). Because there are no Ca2+-activated Cl− channels in the basolateral membranes, there is, from the perspective of fluid secretion, no need to spread the Ca2+ signal to this part of the cell. The decrease in the intracellular Cl− concentration, resulting from the initial loss across the luminal membrane, would stimulate Cl− uptake across the basal membrane by means of the Na+,K+,2Cl− cotransporter (38).
Activation of Ca2+-dependent K+ channels has been demonstrated in most exocrine glands, including all salivary and lacrimal glands investigated (5, 6, 10). The K+ channel is physiologically important because increased intracellular negativity provides a major part of the electrochemical driving force for Cl− exit into the lumen (5). Mouse and rat pancreatic acinar cells are peculiar because of the absence of Ca2+-dependent K+ channels (10). Therefore, the maximal rate of pancreatic fluid secretion stimulated by ACh or cholecystokinin is several orders of magnitude less (per unit of gland weight) than that achieved by, for example, the salivary glands (5). The difference becomes even more significant when one considers that part of the ACh-elicited pancreatic fluid secretion comes from the duct cells (39). The pancreatic acinar fluid secretion is nevertheless important for the washout into the duct system of the secreted acinar enzymes.
Exocrine glands are marvelous pieces of secretory machinery (40), and recent findings provide fresh evidence showing how well adapted the acinar cells are to their task. Local cytosolic Ca2+ spiking in the critical apical granule-containing pole can occur by release from tiny apical extensions of the basolateral ER. These small localized Ca2+ release events, drawn from the large and continuous ER Ca2+ pool, hardly reduce the overall high Ca2+ concentration in the ER that is necessary for proper protein processing (41, 42). Ca2+ released locally into the cytosol remains in the apical pole because of an efficient mitochondrial buffer barrier completely surrounding the granular part (43, 44). For many granules to get access to the small acinar lumen, there is a replenishment mechanism, by which one granule fuses with the luminal cell membrane and subsequently becomes a target for sequential fusion of granules that are located deeper in the apical pole (33).
Everything needed for activation of the fluid and enzyme secretory machinery is located apically, and it is helpful that the physiologically relevant Ca2+ signals mostly are confined to this region (24, 34), thereby preventing undesirable activation of other Ca2+-dependent processes elsewhere in the cell, for example in the nucleus. Our new results, in contrast to earlier studies (16, 18), indicate that fluid secretion could be controlled exclusively by local Ca2+ signals in the apical pole. This is useful because global Ca2+ signaling can be toxic. Even a small sustained global cytosolic Ca2+ elevation is dangerous because it can cause intracellular activation of proteases in the pancreatic acinar cells (45, 46).
Acknowledgments
We thank Mike Ashby for advice on local uncaging and Nina Burdakova and Mark Houghton for technical support. This work was supported by a Medical Research Council program grant. O.H.P. is a Medical Research Council Research Professor.
Abbreviations
- [Ca2+]c
cytosolic Ca2+ concentration
- ACh
acetylcholine
- NP-EGTA
nitrophenyl-EGTA
- NMDG
N-methyl-d-glucamine
- ER
endoplasmic reticulum
References
- 1.Berridge M J, Lindley B D, Prince W T. J Physiol. 1975;244:549–567. doi: 10.1113/jphysiol.1975.sp010812. [DOI] [PMC free article] [PubMed] [Google Scholar]
- 2.Silva P, Stoff J, Field M, Fine L, Forrest J N, Epstein F H. Am J Physiol. 1977;233:F298–F306. doi: 10.1152/ajprenal.1977.233.4.F298. [DOI] [PubMed] [Google Scholar]
- 3.Marty A, Tan Y P, Trautmann A. J Physiol. 1984;357:293–325. doi: 10.1113/jphysiol.1984.sp015501. [DOI] [PMC free article] [PubMed] [Google Scholar]
- 4.Findlay I, Petersen O H. Pflügers Arch. 1985;403:328–330. doi: 10.1007/BF00583609. [DOI] [PubMed] [Google Scholar]
- 5.Petersen O H. J Physiol. 1992;448:1–51. doi: 10.1113/jphysiol.1992.sp019028. [DOI] [PMC free article] [PubMed] [Google Scholar]
- 6.Tan Y P, Marty A, Trautmann A. Proc Natl Acad Sci USA. 1992;89:11229–11233. doi: 10.1073/pnas.89.23.11229. [DOI] [PMC free article] [PubMed] [Google Scholar]
- 7.Sørensen J B, Larsen E H. J Gen Physiol. 1998;112:19–31. doi: 10.1085/jgp.112.1.19. [DOI] [PMC free article] [PubMed] [Google Scholar]
- 8.Fuller C M, Benos D J. News Physiol Sci. 2000;15:165–171. [PubMed] [Google Scholar]
- 9.Kidd J F, Thorn P. Annu Rev Physiol. 2000;62:493–513. doi: 10.1146/annurev.physiol.62.1.493. [DOI] [PubMed] [Google Scholar]
- 10.Petersen O H, Maruyama Y. Nature (London) 1984;307:693–696. doi: 10.1038/307693a0. [DOI] [PubMed] [Google Scholar]
- 11.Burgen A S V. J Physiol. 1956;132:20–39. doi: 10.1113/jphysiol.1956.sp005500. [DOI] [PMC free article] [PubMed] [Google Scholar]
- 12.Cook D I, Young J A. J Membr Biol. 1989;110:139–146. doi: 10.1007/BF01869469. [DOI] [PubMed] [Google Scholar]
- 13.Sørensen J B, Nielsen M S, Gudme C N, Larsen E H, Nielsen R. Pflügers Arch. 2001;442:1–11. doi: 10.1007/s004240000493. [DOI] [PubMed] [Google Scholar]
- 14.Cook D I, Young J A. In: Handbook of Physiology. Schultz S G, editor. Washington, DC: Am. Physiol. Soc.; 1989. pp. 1–23. [Google Scholar]
- 15.Case R M, Argent B E. In: Handbook of Physiology. Schultz S G, editor. Washington, DC: Am. Physiol. Soc.; 1989. pp. 383–417. [Google Scholar]
- 16.Marty A. Trends Neurosci. 1987;10:373–377. [Google Scholar]
- 17.Kasai H, Augustine G J. Nature (London) 1990;348:735–738. doi: 10.1038/348735a0. [DOI] [PubMed] [Google Scholar]
- 18.Ito K, Miyashita Y, Kasai H. EMBO J. 1997;16:242–251. doi: 10.1093/emboj/16.2.242. [DOI] [PMC free article] [PubMed] [Google Scholar]
- 19.Maruyama Y, Petersen O H. Nature (London) 1982;300:61–63. doi: 10.1038/300061a0. [DOI] [PubMed] [Google Scholar]
- 20.Osipchuk Y V, Wakui M, Yule D I, Gallacher D V, Petersen O H. EMBO J. 1990;9:697–704. doi: 10.1002/j.1460-2075.1990.tb08162.x. [DOI] [PMC free article] [PubMed] [Google Scholar]
- 21.Park M K, Tepikin A V, Petersen O H. Pflügers Arch. 1999;438:760–765. doi: 10.1007/s004249900128. [DOI] [PubMed] [Google Scholar]
- 22.Hamill O P, Marty A, Neher E, Sakmann B, Sigworth F J. Pflügers Arch. 1981;391:85–100. doi: 10.1007/BF00656997. [DOI] [PubMed] [Google Scholar]
- 23.Snyder K V, Kriegstein A M, Sachs F. Pflügers Arch. 1999;438:405–411. doi: 10.1007/s004240050928. [DOI] [PubMed] [Google Scholar]
- 24.Petersen O H, Petersen C C H, Kasai H. Annu Rev Physiol. 1994;56:297–319. doi: 10.1146/annurev.ph.56.030194.001501. [DOI] [PubMed] [Google Scholar]
- 25.Cancela J M. Annu Rev Physiol. 2001;63:99–117. doi: 10.1146/annurev.physiol.63.1.99. [DOI] [PubMed] [Google Scholar]
- 26.Thorn P, Petersen O H. J Gen Physiol. 1992;100:11–25. doi: 10.1085/jgp.100.1.11. [DOI] [PMC free article] [PubMed] [Google Scholar]
- 27.Slawik M, Zdebik A, Hug M J, Kerstan D, Leipziger J, Greger R. Pflügers Arch. 1996;432:112–120. doi: 10.1007/s004240050112. [DOI] [PubMed] [Google Scholar]
- 28.Gomez-Hernandez J-M, Stuhmer W, Parekh A B. J Physiol. 1997;502:569–574. doi: 10.1111/j.1469-7793.1997.569bj.x. [DOI] [PMC free article] [PubMed] [Google Scholar]
- 29.Kim S J, Greger R. Pflügers Arch. 1999;438:604–611. doi: 10.1007/s004249900071. [DOI] [PubMed] [Google Scholar]
- 30.Kuruma A, Hartzell H C. J Gen Physiol. 2000;115:59–80. doi: 10.1085/jgp.115.1.59. [DOI] [PMC free article] [PubMed] [Google Scholar]
- 31.Zdebik A, Hug M J, Greger R. Pflügers Arch. 1997;434:188–194. doi: 10.1007/s004240050382. [DOI] [PubMed] [Google Scholar]
- 32.Palade G E. Science. 1975;189:347–358. doi: 10.1126/science.1096303. [DOI] [PubMed] [Google Scholar]
- 33.Nemoto T, Kimura R, Ito K, Tachikawa A, Miyashita Y, Iino M, Kasai H. Nat Cell Biol. 2001;3:253–258. doi: 10.1038/35060042. [DOI] [PubMed] [Google Scholar]
- 34.Thorn P, Lawrie A M, Smith P M, Gallacher D V, Petersen O H. Cell. 1993;74:661–668. doi: 10.1016/0092-8674(93)90513-p. [DOI] [PubMed] [Google Scholar]
- 35.Kasai H, Li Y X, Miyashita Y. Cell. 1993;74:669–677. doi: 10.1016/0092-8674(93)90514-q. [DOI] [PubMed] [Google Scholar]
- 36.Sewell W A, Young J A. J Physiol. 1975;252:379–396. doi: 10.1113/jphysiol.1975.sp011149. [DOI] [PMC free article] [PubMed] [Google Scholar]
- 37.Maruyama Y, Petersen O H. Cell Calcium. 1994;16:419–430. doi: 10.1016/0143-4160(94)90035-3. [DOI] [PubMed] [Google Scholar]
- 38.Haas M, Forbush B. Annu Rev Physiol. 2000;62:515–534. doi: 10.1146/annurev.physiol.62.1.515. [DOI] [PubMed] [Google Scholar]
- 39.Ashton N, Evens R L, Elliott A C, Green R, Argent B E. J Physiol. 1993;471:549–562. doi: 10.1113/jphysiol.1993.sp019915. [DOI] [PMC free article] [PubMed] [Google Scholar]
- 40.Burgen A S V, Emmelin N G. Physiology of the Salivary Glands, Monographs of The Physiological Society. London: Arnold; 1961. , No. 8. [Google Scholar]
- 41.Park M K, Petersen O H, Tepikin A V. EMBO J. 2000;19:5729–5739. doi: 10.1093/emboj/19.21.5729. [DOI] [PMC free article] [PubMed] [Google Scholar]
- 42.Petersen O H, Tepikin A, Park M K. Trends Neurosci. 2001;24:271–276. doi: 10.1016/s0166-2236(00)01787-2. [DOI] [PubMed] [Google Scholar]
- 43.Tinel H, Cancela J M, Mogami H, Gerasimenko J V, Gerasimenko O V, Tepikin A V, Petersen O H. EMBO J. 1999;18:4999–5008. doi: 10.1093/emboj/18.18.4999. [DOI] [PMC free article] [PubMed] [Google Scholar]
- 44.Park M K, Ashby M C, Erdemli G, Petersen O H, Tepikin A V. EMBO J. 2001;20:1863–1874. doi: 10.1093/emboj/20.8.1863. [DOI] [PMC free article] [PubMed] [Google Scholar]
- 45.Raraty M, Ward J, Erdemli G, Vaillant C, Neoptolemos J P, Sutton R, Petersen O H. Proc Natl Acad Sci USA. 2000;97:13126–13131. doi: 10.1073/pnas.97.24.13126. [DOI] [PMC free article] [PubMed] [Google Scholar]
- 46.Parekh A B. Proc Natl Acad Sci USA. 2000;97:12933–12934. doi: 10.1073/pnas.97.24.12933. [DOI] [PMC free article] [PubMed] [Google Scholar]