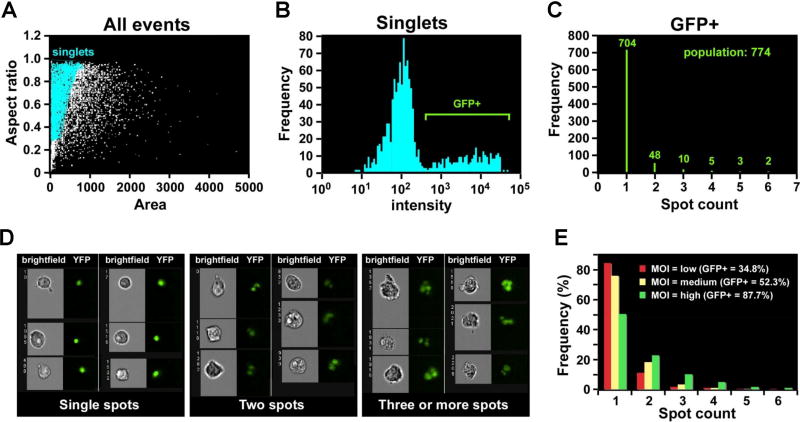
Figure 2. Quantification of internalized GFP-labeled T.gondii using Spot feature of Imagestream (reprinted from [2] with permission from Bentham Science Publishers).
2A: Single-cell population defined by Area/Aspect ratio dotplot;
2B: Histogram of fluorescent intensity (GFP), gated on GFP+ cells;
2C: Histogram of Spot feature (IDEAS™, Amnis-Merck, USA) applied to GFP+, single, focused cells. Represents a quantitative distribution of cells with T.gondii-inclusions (distribution of GFP+-spots inside T.gondii-infected cells).
2D: Representative image galleries of cells, infected with T.gondii (cells with only one, two and three or more inclusions (spots)).
2E: Histogram of Spot Feature distribution (IDEAS™, Amnis-Merck, USA) representing GFP+ T.gondii inclusions in the infected cells after different multiplicity of infection (MOI).

