Abstract
Overactivated hepatic gluconeogenesis contributes to the pathogenesis of metabolic disorders, including type 2 diabetes. Precise control of hepatic gluconeogenesis is thus critical for maintaining whole-body metabolic homeostasis. Long non-coding RNAs (lncRNAs) have been shown to play key roles in diseases by regulating diverse biological processes, but the function of lncRNAs in maintaining normal physiology, particularly glucose homeostasis in the liver, remains largely unexplored. We identified a novel liver-enriched long non-coding RNA, Gm10768, and examined its expression patterns under pathophysiological conditions. We further adopted gain- and loss-of-function strategies to explore the effect of Gm10768 on hepatic glucose metabolism and the possible molecular mechanism involved. Our results showed that the expression of Gm10768 was significantly increased in the liver of fasted mice and was induced by gluconeogenic hormonal stimuli. Functionally, overexpression of Gm10768 activated hepatic gluconeogenesis in a cell-autonomous manner. In contrast, depletion of Gm10768 suppressed hepatic glucose production both in vitro and in vivo. Adenovirus-mediated hepatic knockdown of Gm10768 improved glucose tolerance and hyperglycemia of diabetic db/db mice. Mechanistically, Gm10768 sequestrated microRNA-214 (miR-214) to relieve its suppression on activating transcription factor 4 (ATF4), a positive regulator of hepatic gluconeogenesis. Taken together, we identified Gm10768 as a new lncRNA activating hepatic gluconeogenesis through antagonizing miR-214 in mice.
Keywords: diabetes; gluconeogenesis; liver; long noncoding RNA (long ncRNA, lncRNA); microRNA (miRNA)
Introduction
As a central metabolic organ, the liver plays a critical role in maintaining glucose homeostasis. When nutrients are sufficiently available, the liver increases glucose uptake and glycogen synthesis (1). During fasting, hepatic gluconeogenesis is triggered to keep normal blood glucose levels. Under pathological conditions, hepatic gluconeogenesis is abnormally overactivated, which results in hyperglycemia and contributes importantly to the pathogenesis of various metabolic disorders, such as type 2 diabetes (T2D)4 (2, 3). Previous studies have demonstrated that hepatic gluconeogenesis, rather than glycogenolysis, is increased in patients with T2D (2). Hepatic gluconeogenesis is largely controlled through key rate-limiting enzymes in the gluconeogenic pathway, specifically phosphoenolpyruvate carboxykinase (PEPCK) and glucose-6-phosphatase (G6Pase) (4). Therefore, exploring new regulatory factors of gluconeogenic enzymes to inhibit overactivated hepatic gluconeogenesis is a feasible therapeutic strategy to treat T2D.
Long non-coding RNAs (lncRNAs) are transcripts larger than 200 nt in length and have no coding potential (5). Although historically misunderstood as junk transcripts, lncRNAs have now been realized to play key roles in disease occurrence through regulating diverse biological processes (6, 7). Recently, studies suggest that lncRNAs may serve as critical regulators of glucose homeostasis in human diseases such as diabetes (8, 9). For example, lncRNA Meg3 overexpression increases hepatic glucose production. In contrast, liver-specific knockdown of Meg3 reverses the impairment of glucose homeostasis in diabetic mice (10). Another lncRNA, lncLGR, which is induced by fasting, has been shown to suppress glucokinase expression and glycogen storage by binding to heterogeneous nuclear ribonucleoprotein L (11). In general, the physiological function of lncRNAs in maintaining glucose homeostasis in liver remains largely unexplored.
In this study, we characterized a long non-coding RNA, Gm10768, as a positive regulator involved in hepatic gluconeogenesis both in vitro and in vivo. Adenovirus-mediated knockdown of Gm10768 in the liver improved hyperglycemia and insulin resistance in diabetic db/db mice. Mechanistically, Gm10768 sequestered miR-214 and recovered the expression and function of activating transcription factor 4 (ATF4), which is a miR-214 target gene and is an activator of hepatic gluconeogenesis.
Results
Identification of Gm10768 as an inducible lncRNA during hepatic gluconeogenesis
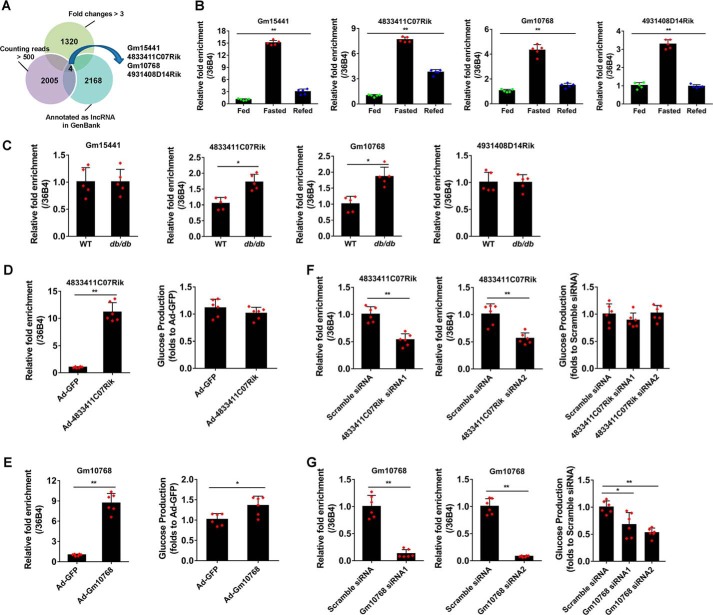
To identify lncRNAs potentially involved in hepatic gluconeogenesis, we compared the expression levels of lncRNAs in the liver of mice under fasting–refeeding cycles using high-throughput RNA sequencing. An average of 67.6 million high-quality, paired-end sequencing reads was obtained from each sample (range: 65.5–69.8 million). Thus, an average of 95.3% in the total reads (range: 94.8–95.5%) could be mapped to the mouse genome, of which 89.2% reads (range: 88.9–89.4%) could be aligned to proper pairs. As a result, a total of 59,892 genes (25,732 protein-coding transcripts and 34,160 annotated lncRNAs) with sufficiently high expression levels were identified (summarized reads information was shown in Table S1). Specifically, we found that there were 1320 lncRNAs with induction folds of >3 in response to a 16-h fasting (Table S2). We next performed a cluster analysis by setting another two criteria to further screen these lncRNAs: annotation as authentic lncRNAs in GenBankTM and relatively high abundance in the mouse liver (counting reads >500). Our results showed that four lncRNAs, namely Gm15441, 4833411C07Rik, Gm10768, and 4931408D14Rik, met all the given criteria (Fig. 1A). To confirm these results, an independent reverse transcription-quantitative PCR (RT-qPCR) assay was performed, and the results were consistent with RNA-sequence analysis (Fig. 1B). We further validated these lncRNAs in the liver of diabetic db/db mice with overactivated hepatic gluconeogenesis and found that only two lncRNAs (4833411C07Rik and Gm10768) were increased (Fig. 1C). Finally, we used gain- and loss-of-function methods in vitro to screen out functional lncRNAs affecting gluconeogenesis. Our data indicated that Gm10768, but not 4833411C07Rik, was positively correlated with the glucose production in mouse primary hepatocytes (Fig. 1, D–G). These findings helped us to quickly narrow down our research target and select Gm10768 as a promising regulator involved in hepatic gluconeogenesis.
Figure 1.
Identification of Gm10768 as an inducible lncRNA during hepatic gluconeogenesis. A, cluster analysis was performed to screen out candidate lncRNAs potentially involved in hepatic gluconeogenesis in mice. The lncRNAs were selected based on three criteria: induction folds >3 during 16-h fasting, already annotated as authentic lncRNAs, and relatively high abundance in the mouse liver (counting reads >500). B, validation of four selected lncRNAs by RT-qPCR in the liver dissected from mice subjected to ad libitum feeding, 16-h fasting, or 16-h fasting followed by 8-h refeeding (n = 5 per group). **, p < 0.01, one-way ANOVA analysis. C, RT-qPCR analysis of four selected lncRNAs in the liver of WT or db/db mice (n = 5 per group). *, p < 0.05, and **, p < 0.01 versus WT, unpaired t test. WT, wildtype. D, RNA expression levels of 4833411C07Rik (left panel) and glucose output assay (right panel) in mouse primary hepatocytes infected with adenoviruses encoding 4833411C07Rik or GFP (m.o.i. = 50). **, p < 0.01 versus Ad-GFP, unpaired t tests. E, RNA expression levels of Gm10768 (left panel) and glucose output assay (right panel) in mouse primary hepatocytes infected with adenoviruses encoding Gm10768 or GFP (m.o.i. = 50). *, p < 0.05, and **, p < 0.01 versus Ad-GFP, unpaired t tests. F, RNA expression levels of 4833411C07Rik (left panel) and glucose output assay (right panel) in mouse primary hepatocytes transfected with siRNAs targeting 4833411C07Rik or Scramble siRNA. **, p < 0.01 versus Scramble siRNA, unpaired t test. G, RNA expression levels of 4833411C07Rik (left panel) and glucose output assay (right panel) in mouse primary hepatocytes transfected with siRNAs targeting Gm10768 or Scramble siRNA. *, p < 0.05, and **, p < 0.01 versus Scramble siRNA, unpaired t test. For D–G, mouse primary hepatocytes were isolated from six mice to perform one batch of experiments, and the cells were transduced with indicated adenoviruses or siRNAs for 48 h. Three batches of experiments were performed in total. Data were presented as mean ± S.D. Error bars represent the S.D. from the mean of three independent experiments.
Gluconeogenic signals induce hepatic Gm10768 expression
Gm10768 is a predicted gene deposited in the GenBankTM with an accession number of NR_033472. It is an intergenic lncRNA located on chromosome 19qc3 in the mouse genome (Fig. S1A). Although Gm10768 is a gene highly expressed in the mouse carotid body (12), its physiological function remains largely unknown. According to the overlapping region identified by rapid amplification of cDNA ends (RACE) analysis, we spliced 5′-end (1009 bp) and 3′-end (418 bp) sequences forming the full-length cDNA (3470 bp) of Gm10768 (Figs. S1B and S2). We performed two widely employed algorithms to analyze the protein-coding potential of Gm10768, and the results indicated that the coding potential of Gm10768 was very low (Fig. S3A). Furthermore, a Gm10768 expression vector failed to produce any protein product when using an in vitro transcription/translation assay (Fig. S3B).
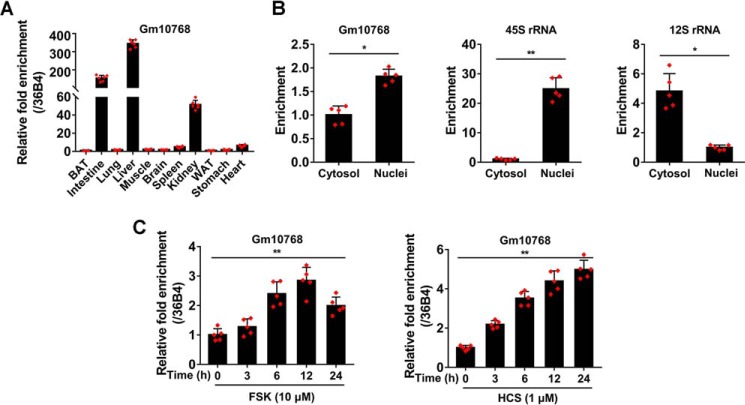
As shown in Fig. 2A, RT-qPCR analysis indicated that Gm10768 was specifically enriched in the liver, although it was ubiquitously expressed in all examined tissues. In addition, Gm10768 was distributed both in the cytosol and nuclei, with a moderate abundance in the nuclear compartment (Fig. 2B). Next, we performed in vitro experiments and treated mouse primary hepatocytes with forskolin (FSK) or hydrocortisone (HCS) to mimic hepatic gluconeogenesis, and we found that Gm10768 was induced in a time-dependent manner upon these treatments (Fig. 2C).
Figure 2.
Gluconeogenic signals induce hepatic Gm10768 expression. A, relative RNA expression levels of Gm10768 in various tissues dissected from C57BL/6J mice (n = 5 per group). Tissues were harvested, and RT-qPCR analysis was performed to quantify Gm10768 expression levels. BAT, brown adipose tissue; WAT, white adipose tissue. The expression abundance in brown adipose tissue was set as 1. B, subcellular localization of Gm10768. Cytosol and nuclei were separated by using PARIS kit, and RT-qPCR was performed to calculate the ratio of subcellular distribution of Gm10768. 45S rRNA and 12S rRNA were used as markers of nuclei and cytosol, respectively. *, p < 0.05, and **, p < 0.01 versus cytosol, unpaired t test. C, regulation of Gm10768 expression by gluconeogenic hormones in vitro. Mouse primary hepatocytes were treated with 10 μm FSK or 1 μm HCS for an indicated time period. Gm10768 expression levels were quantified by RT-qPCR analysis. **, p < 0.01, one-way ANOVA analysis. Mouse primary hepatocytes used in all experiments were isolated from five mice to do one batch of experiments, and three batches of experiments were performed. Data were presented as mean ± S.D. Error bars represent the S.D. from the mean of three independent experiments.
Overexpression of Gm10768 activates hepatic gluconeogenesis
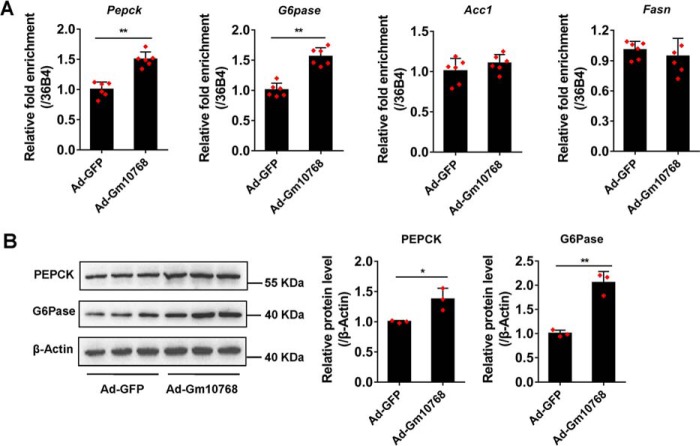
In our preliminary study, Gm10768 has already been shown to functionally increase the glucose production in mouse primary hepatocytes (Fig. 1E). It is therefore interesting to investigate the causal relationship between Gm10768 and hepatic gluconeogenesis. Overexpression of Gm10768 remarkably increased the mRNA expression levels of Pepck and G6pase in mouse primary hepatocytes (Fig. 3A), whereas the lipogenic genes such as acetyl-CoA carboxylase 1 (Acc1) and fatty-acid synthase (Fasn) remained unchanged, suggesting that the impact of Gm10768 is specific to the regulation of gluconeogenesis and is not a general disturbance of the hepatic metabolism. Consistently, protein levels of PEPCK and G6Pase were also up-regulated (Fig. 3B).
Figure 3.
Overexpression of Gm10768 increases gluconeogenic gene expression in vitro. Mouse primary hepatocytes were isolated from six mice to do one batch of experiments and transduced with adenoviruses expressing Gm10768 (Ad-Gm10768) or GFP (Ad-GFP, as control) for 48 h, and three batches of experiments were performed. RT-qPCR (A) and Western blot analysis (B) were performed to check gluconeogenic gene expression. *, p < 0.05, and **, p < 0.01 versus Ad-GFP, unpaired t test. Data were presented as mean ± S.D. Error bars represent the S.D. from the mean of three independent experiments.
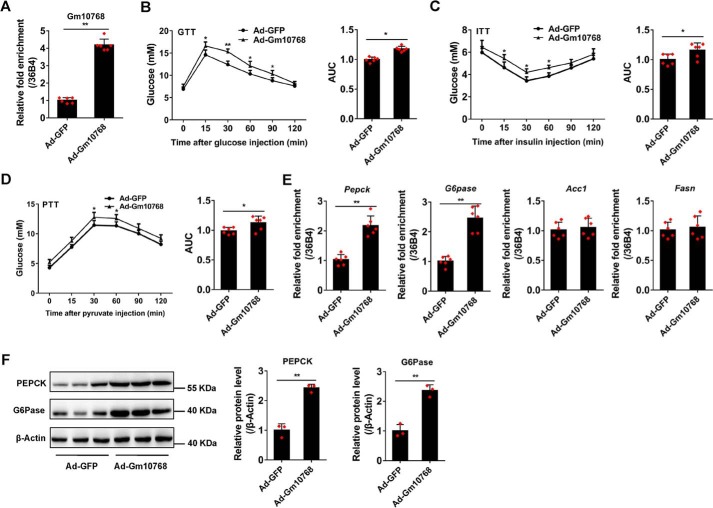
In vivo studies indicated that the expression of Gm10768 was elevated to 4.3-fold in the liver of mice injected with recombinant adenoviruses expressing Gm10768 (Fig. 4A). Gm10768 overexpression in vivo did not markedly affect the body weight, food intake, or liver weight (Fig. S4A), nor the liver damage biomarkers, including alanine aminotransferase (ALT) and aspartate aminotransaminase (AST) (Table 1). Interestingly, these mice showed a moderate increase in the serum levels of glucose and insulin both under fed and fasted conditions as compared with the control mice (Table 1). Glucose tolerance test (GTT), insulin tolerance test (ITT), and pyruvate tolerance test (PTT) indicated that forced expression of Gm10768 in mice exhibited an impairment of glucose disposal, insulin sensitivity, and pyruvate tolerance (Fig. 4, B–D). At the molecular level, a significant increase in the expression levels of PEPCK and G6Pase was observed (Fig. 4, E and F), whereas the mRNA levels of Acc1 and Fasn did not show any change in Ad-Gm10768-infected mice (Fig. 4E).
Figure 4.
Overexpression of Gm10768 promotes hepatic gluconeogenesis in vivo. C57BL/6J mice were transduced with adenoviruses encoding GFP or Gm10768 through tail-vein injection (1 × 10⁹ PFU per mouse). Four days later, animal experiments were performed (n = 6 per group). A, infection efficiency of Ad-Gm10768 in the liver of normal C57BL/6J mice. B–D, GTT, ITT, and PTT. Mice were fasted for 6 h (for GTT and ITT) or overnight (for PTT), and the assays were performed. Area under curve (AUC) for these tests were calculated and shown simultaneously. E and F, gluconeogenic gene expression in the liver. RT-qPCR (E) and Western blot analysis (F) were performed in the liver of mice treated as in A–D. *, p < 0.05, and **, p < 0.01 versus Ad-GFP, unpaired t tests. Data were presented as mean ± S.D. Error bars represent the S.D. from the mean of three independent experiments.
Table 1.
Serum parameters of mice transduced with adenoviruses expressing either GFP or Gm10768
Data are presented as mean ± S.D.
| Ad-GFP | Ad-Gm10768 | |
|---|---|---|
| Fed glucose (mm) | 7.96 ± 1.24 | 8.84 ± 1.38a |
| Fasted glucose (mm) | 4.23 ± 0.47 | 5.06 ± 0.53a |
| Fed insulin (ng/ml) | 1.19 ± 0.041 | 1.44 ± 0.051a |
| Fasted insulin (ng/ml) | 0.32 ± 0.027 | 0.36 ± 0.021a |
| Alanine aminotransferase (units/liter) | 21.68 ± 6.53 | 23.19 ± 5.20 |
| Aspartate aminotransferase (units/liter) | 35.26 ± 12.81 | 36.35 ± 11.83 |
a p ≤ 0.05 versus Ad-GFP group, unpaired t tests, n = 6 per group.
Knockdown of Gm10768 suppresses hepatic gluconeogenesis
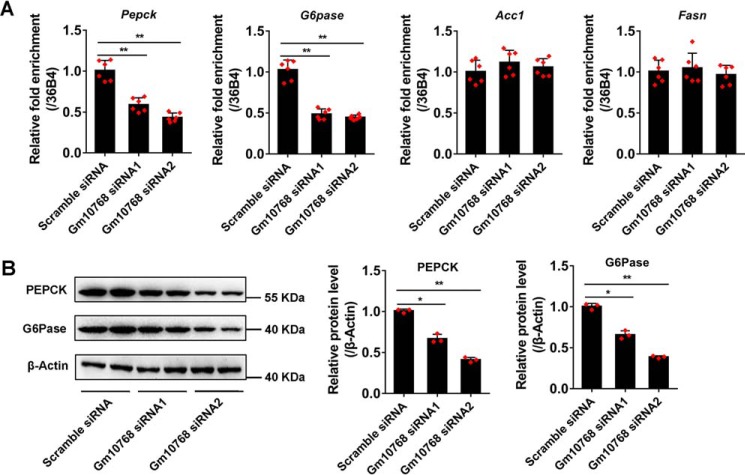
In accordance with the results shown in Fig. 1G, knockdown of Gm10768 led to a remarkable decrease in the mRNA and protein expression levels of PEPCK and G6Pase, whereas left the lipogenic gene Acc1 and Fasn unchanged (Fig. 5, A and B).
Figure 5.
Knockdown of Gm10768 reduces gluconeogenic gene expression in vitro. Mouse primary hepatocytes were transduced with two siRNAs targeting Gm10768 for 48 h. Scramble siRNA was used as control. RT-qPCR (A) and Western blot analysis (B) were performed to check gluconeogenic gene expression. *, p < 0.05, and **, p < 0.01 versus Scramble siRNA, unpaired t tests. Mouse primary hepatocytes used in all experiments were isolated from five to six mice to do one batch of experiments, and three batches of experiments were performed. Data were presented as mean ± S.D. Error bars represent the S.D. from the mean of three independent experiments.
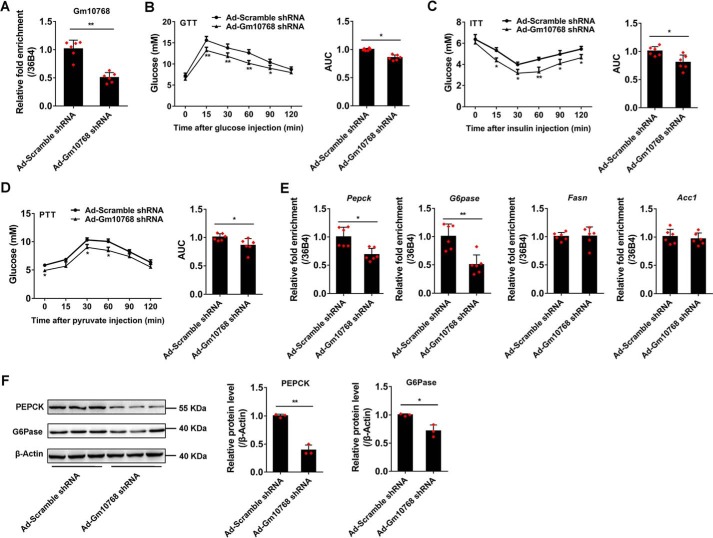
We then specifically knocked down Gm10768 expression in the liver of normal C57BL/6J mice. Tail-vein injection of adenoviruses encoding the short hairpin RNA (shRNA) against Gm10768 (Ad-Gm10768 shRNA) suppressed Gm10768 expression levels by more than 50% in the mouse liver when compared with control adenoviruses (Ad-Scramble shRNA) (Fig. 6A). No significant difference was observed in the body weight, food intake, liver weight, and serum levels of ALT and AST between these two groups of mice (Table 2 and Fig. S4B). Of note, serum levels of glucose and insulin were significantly reduced in mice with liver-specific Gm10768 knockdown, both under fed and fasted conditions (Table 2). These mice also showed improved glucose and insulin tolerance (Fig. 6, B and C). Consistently, Gm10768 knockdown inhibited de novo hepatic synthesis of glucose (Fig. 6D). The mRNA and protein expression levels of gluconeogenic genes (Pepck and G6pase), but not lipogenic genes (Acc1 and Fasn), were consistently decreased (Fig. 6, E and F).
Figure 6.
Knockdown of Gm10768 suppresses hepatic gluconeogenesis in vivo. C57BL/6J mice were transduced with adenoviruses encoding Scramble shRNA or shRNA against Gm10768 through tail-vein injection (1 × 10⁹ PFU per mouse). Four days later, animal experiments were performed (n = 6 per group). A, knockdown efficiency of Ad-Gm10768 shRNA in the livers of normal C57BL/6J mice when administered through tail-vein injection. B–D, GTT, ITT, and PTT. Mice were fasted for 6 h (for GTT and ITT) or overnight (for PTT), and the assays were performed. Area under curve (AUC) for these tests was also shown. E and F, gluconeogenic gene expression in the liver. RT-qPCR (E) and Western blot analysis (F) were performed in the liver of mice treated as in A–D. *, p < 0.05, and **, p < 0.01 versus Ad-Scramble shRNA, unpaired t tests. Data were presented as mean ± S.D. Error bars represent the S.D. from the mean of three independent experiments.
Table 2.
Serum parameters of C57BL/6J mice transduced with adenoviruses expressing either scramble shRNA or Gm10768 shRNA
Data are presented as mean ± S.D.
| Ad-Scramble shRNA | Ad-Gm10768 shRNA | |
|---|---|---|
| Fed glucose (mm) | 8.19 ± 0.98 | 6.76 ± 0.88a |
| Fasted glucose (mm) | 5.36 ± 0.33 | 4.47 ± 0.42a |
| Fed insulin (ng/ml) | 0.93 ± 0.070 | 0.74 ± 0.056a |
| Fasted insulin (ng/ml) | 0.37 ± 0.024 | 0.31 ± 0.031a |
| Alanine aminotransferase (units/liter) | 24.93 ± 5.21 | 25.67 ± 4.62 |
| Aspartate aminotransferase (units/liter) | 36.46 ± 7.28 | 37.6 ± 6.15 |
a p < 0.05 versus Ad-Scramble shRNA group, unpaired t tests, n = 6 per group.
Liver-specific knockdown of Gm10768 relieves hyperglycemia in diabetic db/db mice
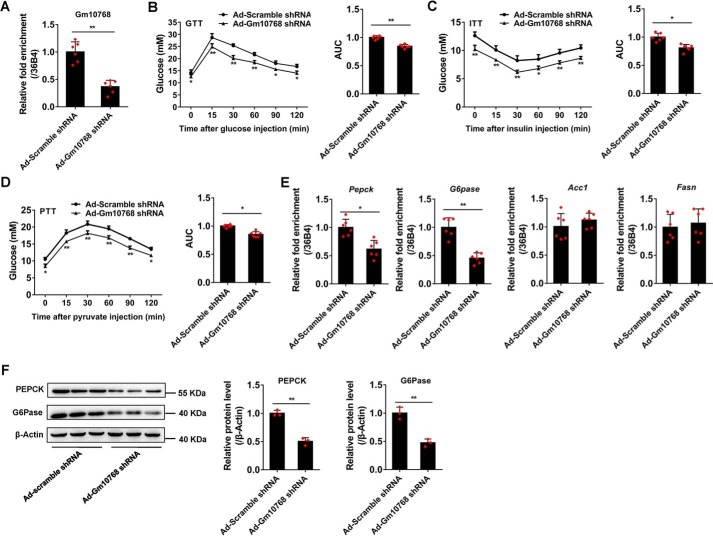
We further evaluated the effects of Gm10768 on hyperglycemia in a pathophysiological setting by using diabetic db/db mice. The RT-qPCR results indicated that tail-vein injection of Ad-Gm10768 shRNA could effectively silence the expression of endogenous Gm10768 in the liver of db/db mice (Fig. 7A). Loss of Gm10768 function did not significantly affect body weight, food intake, liver weight, and ALT/AST, when compared with control db/db mice (infected with Ad-Scramble shRNA) (Table 3 and Fig. S4C). However, serological analyses indicated that serum levels of glucose and insulin were reduced in response to Gm10768 knockdown both under fed and fasted conditions (Table 3). Gm10768 knockdown also relieved glucose intolerance and insulin resistance in these animals (Fig. 7, B–D). Accordingly, the hepatic expression levels of PEPCK and G6Pase were suppressed by Gm10768 knockdown (Fig. 7, E and F).
Figure 7.
Liver-specific knockdown relieves hyperglycemia in diabetic db/db mice. The db/db mice were treated as described in Fig. 6 (n = 6 per group). A, knockdown efficiency of Ad-Gm10768 shRNA in the livers of db/db mice when administered through tail-vein injection. B–D, GTT, ITT, and PTT. Mice were fasted for 6 h (for GTT and ITT) or overnight (for PTT), and the assays were performed. Area under curve (AUC) for these tests was also shown. E and F, gluconeogenic gene expression in the liver. RT-qPCR (E) and Western blot analysis (F) were performed in the liver of db/db mice treated as in A–D. *, p < 0.05, and **, p < 0.01 versus Ad-Scramble shRNA, unpaired t tests. Data were presented as mean ± S.D. Error bars represent the S.D. from the mean of three independent experiments.
Table 3.
Serum parameters of db/db mice transduced with adenoviruses expressing either scramble shRNA or Gm10768 shRNA
Data are presented as mean ± S.D.
| Ad-Scramble shRNA | Ad-Gm10768 shRNA | |
|---|---|---|
| Fed glucose (mm) | 21.19 ± 2.30 | 18.76 ± 1.74a |
| Fasted glucose (mm) | 10.34 ± 0.71 | 8.15 ± 0.68a |
| Fed insulin (ng/ml) | 10.93 ± 0.83 | 8.84 ± 0.66a |
| Fasted insulin (ng/ml) | 4.51 ± 0.37 | 3.67 ± 0.29a |
| Alanine aminotransferase (units/liter) | 26.36 ± 6.41 | 24.76 ± 7.36 |
| Aspartate aminotransferase (units/liter) | 37.41 ± 8.53 | 38.83 ± 8.61 |
a p < 0.05 versus. Ad-Scramble shRNA group, unpaired t tests, n = 6 per group.
Gm10768 activates hepatic gluconeogenesis through sequestering miR-214
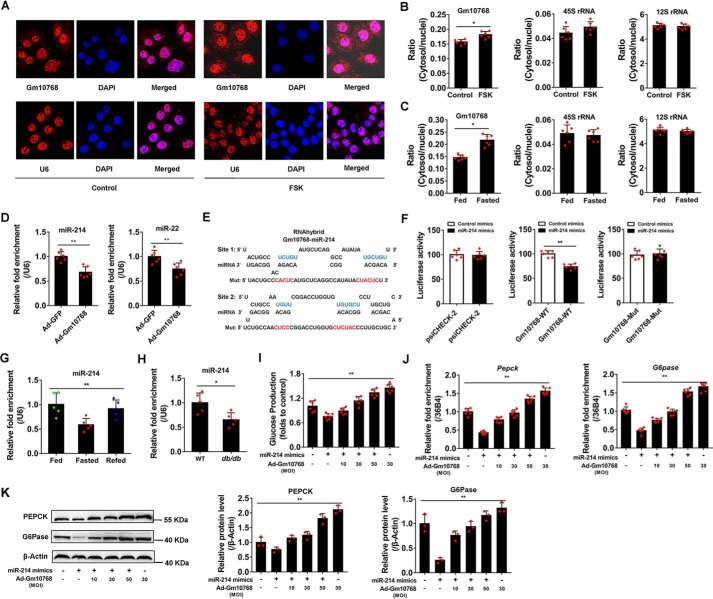
Previous studies indicate that lncRNAs can regulate genes in cis that are positioned in the vicinity of their transcription sites in nuclei. However, we found that Gm10768 overexpression did not alter the expression levels of its upstream gene Abcc2 (ATP-binding cassette, sub-family C) (Fig. S5A), suggesting that Gm10768 may also function in the cytosol. To precisely examine the subcellular localization of Gm10768 in response to gluconeogenic stimuli, we performed fluorescence in situ hybridization (FISH) analysis in mouse primary hepatocytes treated with FSK. As shown in Fig. 8A, FSK increased the contents of Gm10768 both in nuclei and in cytosol (as evidenced by stronger red signals), and the cytosolic Gm10768 was more robustly up-regulated. RT-qPCR analysis in subcellular fractions isolated from FSK-treated mouse hepatocytes and fasted mouse liver samples showed similar trends (Fig. 8, B and C).
Figure 8.
Gm10768 activates hepatic gluconeogenesis through sequestering miR-214. A, FISH analysis in mouse primary hepatocytes treated with FSK for 6 h. Gm10768 subcellular localization was assessed by laser confocal microscopy. Red, Gm10768 or snRNA U6 (as a positive control); blue, 4′,6-diamidino-2-phenylindole staining. Magnification: ×1000. B, subcellular distribution of Gm10768 in mouse primary hepatocytes treated as in A. RT-qPCR analysis was performed to calculate the ratio of cytosolic and nuclear Gm10768. *, p < 0.05 versus control group, unpaired t test. C, subcellular distribution of Gm10768 in the liver of mice subjected to fasting/refeeding cycles (n = 5 per group). *, p < 0.05 versus fed mice, unpaired t test. 45S rRNA and 12S rRNA were used as markers of nuclei and cytosol, respectively. D, expression of miRNA-214 and miRNA-22 in mouse primary hepatocytes infected with adenoviruses expressing GFP or Gm10768 for 48 h. **, p < 0.01 versus Ad-GFP, unpaired t test. E, high-affinity–binding sites of miR-214 in Gm10768 cDNA predicted by RNA hybrid software. Mutations in the sequence complementary to the seed region were also shown (original sequences are marked in blue, and the non-functional mutation sequences are marked in red. F, relative luciferase activity of Gm10768 reporter vectors regulated by miR-214. Mut, mutant. **, p < 0.01 versus control mimics, unpaired t tests. G, expression of miR-214 in the liver of mice (n = 5 per group) subjected to fasting/refeeding cycles. **, p < 0.01, one-way ANOVA analysis. H, expression of miR-214 in the liver of WT or db/db mice (n = 5 per group). **, p < 0.01 versus WT, unpaired t tests. I, glucose output assay. Mouse primary hepatocytes were infected by different doses of adenoviruses expressing GFP or Gm10768 for 12 h and then transfected with miR-214 mimics or control mimics for another 36 h. **, p < 0.01, one-way ANOVA analysis. J and K, RT-qPCR and Western blot analyses of PEPCK and G6Pase expression in mouse primary hepatocytes treated as I. **, p < 0.01, one-way ANOVA analysis. Mouse primary hepatocytes used in all experiments were isolated from five to six mice for one batch of experiments, and three batches of experiments were performed. Data are presented as mean ± S.D. Error bars represent the S.D. from the mean of three independent experiments.
Given that lncRNAs are able to sequester microRNAs (miRNAs), modulating their expression and biological functions (13, 14), we hypothesized that Gm10768 may exert its effects via binding to miRNAs targeting hepatic gluconeogenesis. We then analyzed the expression levels of several miRNAs, which were already known as gluconeogenic regulators (15–21), in mouse hepatocytes infected by Ad-Gm10768 to screen the potential target of Gm10768. Among all these miRNAs, only miR-214 and miR-22 were significantly decreased in response to Gm10768 overexpression (Fig. 8D and Fig. S5B). Therefore, we focused on these two miRNAs in our following study.
Bioinformatics analysis of miRNA recognition sequences using RNA hybrid (https://bibiserv.cebitec.uni-bielefeld.de/rnahybrid/)5 (33) indicated that two high-affinity binding sites of miR-22 and miR-214 were presented in Gm10768 cDNA (Fig. 8E and Fig. S5C). To verify true functional binding between Gm10768 and its target miRNAs, we respectively constructed two luciferase reporter plasmids by inserting the sequence of Gm10768 containing the above predicted binding sites targeting miR-22 or miR-214 into psiCHECK-2 vector. Reporter gene assays revealed that transfection of miR-214 mimics into mouse hepatocytes markedly inhibited the activity of the luciferase reporter harboring the Gm10768 sequence with miR-214–binding sites (Fig. 8, E and F), whereas miR-22 mimics did not showed any apparent effect on its corresponding vector (Fig. S5D). To further confirm the importance of miR-214–binding sites on Gm10768, we mutated these regions to non-functional sequences (disruption of the complementary base-pairing) (Fig. 8, E and F). As expected, mutations almost completely abolished the repressive effect of miR-214 mimics (Fig. 8F), indicating that these binding sites are essential for the function of miR-214. Besides, RT-qPCR analysis indicated that miR-214 was significantly decreased in the livers of 16-h fasted mice and db/db mice (Fig. 8, G and H).
To dissect the physiological significance of interaction between Gm10768 and miR-214, we transduced miR-214 mimics into mouse hepatocytes along with different doses of Ad-Gm10768. Functional studies indicated that miR-214-inhibited glucose production in these cells was recovered by Ad-Gm10768 in a dose-dependent manner (Fig. 8I and Fig. S5G). At the molecular level, Ad-Gm10768 relieved miR-214-induced suppression of gluconeogenic gene expression (Fig. 8, J and K). Conversely, to investigate whether miR-214 reverses Gm10768's effects, thus forming a negative feedback loop between Gm10768 and miR-214, we transfected miR-214 mimics into Gm10768-overexpressed mouse primary hepatocytes and found that miR-214 dose-dependently attenuated the stimulative effect of Gm10768 on glucose production (Fig. S5, H and I).
miR-214–ATF4 axis mediates the activation of hepatic gluconeogenesis by Gm10768
miRNAs are initially transcribed as long primary transcripts, which are then processed into ∼65-nt hairpin-shaped precursor miRNAs by the “Microprocessor” complex. Because Gm10768 reduces miR-214 levels, we want to explore the effects of Gm10768 on the different stages during miR-214 formation. First, we examined the transcription levels of pri-miR-214 in mouse primary hepatocytes by RT-qPCR analysis, and we found that they were not influenced by Gm10768 overexpression (Fig. S5E), suggesting that the regulation of miR-214 by Gm10768 does not occur at the transcriptional level. Second, we transfected a pcDNA 3.1 vector expressing pri-miR-214 into mouse primary hepatocytes for 12 h and then infected these cells with adenoviruses expressing Gm10768 or GFP for 36 h. As shown in Fig. S5F, overexpression of pri-miR-214 remarkably increased the expression levels of pre-miR-214, and this process was not affected by Gm10768 overexpression. Based on these findings, we conclude that Gm10768 does not affect both the transcription and maturation of miR-214. Instead, Gm10768 possibly attenuates the function of miR-214.
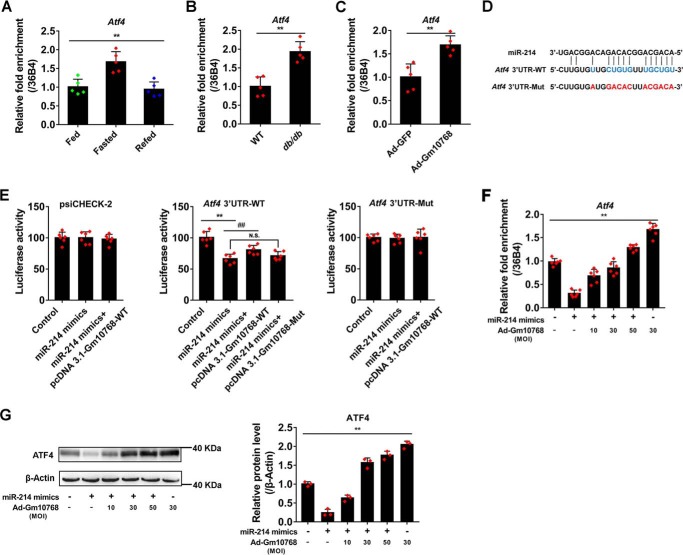
Previous studies have indicated that miR-214 acts as a gluconeogenic suppressor by down-regulating ATF4 (18, 22). Therefore, it is of particular interest to evaluate the physiological significance of interaction between Gm10768 and miR-214 on the expression of ATF4. As shown in Fig. 9, A and B, the hepatic mRNA expression of Atf4 was significantly increased in the liver of mice subjected to 16 h fasting and of db/db mice. Additionally, overexpression of Gm10768 further increased the Atf4 mRNA expression (Fig. 9C). To explore whether Gm10768 antagonizes the inhibitory effect of miR-214 on the activity of the Atf4 3′-UTR region, we constructed a luciferase reporter vector containing this region with miR-214–binding sites (Fig. 9D) (23). As shown in Fig. 9E, luciferase reporter assays indicated that transfection of miR-214 mimics indeed suppressed the activity of the Atf4 3′-UTR region by 34%, whereas overexpression of Gm10768 partially restored it by 14%. However, mutation of the miR-214–binding sites in Gm10768 led to a failure of Gm10768-induced restoration. To further confirm the importance of miR-214 targeting sites in mediating the effect of Gm10768, we mutated these regions to non-functional sequences (Fig. 9D). Our findings showed that the mutations of these regions abolished the actions of both miR-214 and Gm10768 (Fig. 9E). Furthermore, the mRNA and protein expression levels of ATF4 were significantly decreased upon transfection of miR-214 mimics and were recovered in response to Gm10768 overexpression (Fig. 9, F and G). It should be noted that ATF4 is an ER stress-responsive gene, and ER stress is tightly linked to gluconeogenesis. We thus examined the regulation of Atf4 by Gm10768 during tunicamycin (TM)-induced ER stress. As expected, TM significantly induced the mRNA expression levels of Atf4 to ∼5-fold, whereas adenoviral shRNA-mediated knockdown of Gm10768 antagonized the effect of TM and decreased Atf4 expression by 30% (Fig. S5J). These results suggested that Gm10768 positively regulates ATF4 in a universal manner.
Figure 9.
miR-214–ATF4 axis mediates the activation of hepatic gluconeogenesis by Gm10768. A, RT-qPCR analysis of Atf4 mRNA in the liver of mice (n = 5 per group) subjected to fasting/refeeding cycles. **, p < 0.01, one-way ANOVA analysis. B, RT-qPCR analysis of Atf4 mRNA in the liver from WT or db/db mice (n = 5 per group). **, p < 0.01 versus WT, unpaired t test. C, RNA expression levels of Atf4 in mouse primary hepatocytes infected with adenoviruses expressing GFP or Gm10768 for 48 h. **, p < 0.01 versus Ad-GFP, unpaired t tests. D, graphical representation of the miR-214–binding sites in Atf4 3′-UTR region. The original sequences (marked in blue) were mutated to non-functional sequences (marked in red). UTR, untranslated region. E, reporter gene assays in HEK293T cells transfected with miR-214 mimics or with control mimics, together with plasmids encoding Gm10768 and Atf4 3′ UTR region (WT), or their respective mutations for 48 h. **, p < 0.01 versus control mimics. ##, p < 0.01 versus miR-214 mimics, unpaired t tests. N.S., no significance. F and G, RT-qPCR and Western blot analyses of ATF4 expression in vitro. Mouse primary hepatocytes were infected by different doses of adenoviruses expressing GFP or Gm10768 for 12 h and then transfected with miR-214 mimics or control mimics for another 36 h. **, p < 0.01, one-way ANOVA analysis. Cells were isolated from six mice to perform one batch of experiments, and three batches of experiments were performed. Data were presented as mean ± S.D. Error bars represent the S.D. from the mean of three independent experiments.
Discussion
It is generally accepted that aberrant regulation of hepatic gluconeogenesis contributes to hyperglycemia observed in patients with T2D. Therefore, exploring the metabolic regulators participating in hepatic gluconeogenesis might help us to better understand the pathogenesis of T2D. In this study, we showed that the expression levels of Gm10768 were increased in the liver of fasted and db/db mice, suggesting that Gm10768 might contribute to the disruption of glucose homeostasis. We next adopted gain- and loss-of-function strategies in vitro and in vivo to unmask the impact of Gm10768 on hepatic gluconeogenesis and confirmed the positive role of Gm10768 in the regulation of this metabolic process. We finally explored the underlying mechanisms by which the Gm10768 conferred its functions.
In recent years, a growing number of lncRNAs have been identified at an unprecedented pace, and their physiological significance received a remarkable level of attention (7–9). A striking characteristic of lncRNAs is that they are expressed in a more tissue-specific fashion than protein-coding RNAs (6). As a key metabolic organ, liver plays an important role in the maintenance of metabolic homeostasis, but the regulation of liver metabolism by lncRNAs has so far been poorly addressed. One of the well-studied lncRNAs enriched in the liver with a role in triglyceride regulation was lncLSTR (24). Similar to lncLSTR, we found Gm10768 was specifically enriched in the liver. The abundance of Gm10768 in the small intestine and kidney was also relatively high. Given that gluconeogenesis occurs dominantly in the liver, but also takes place in the small intestine and kidney, Gm10768 may consistently function in all these tissues to trigger gluconeogenesis.
Hepatic glucose production is regulated by nutritional and hormonal signals (1). Among these signals, fasting is one of the most potent stimuli to trigger gluconeogenesis. The expression level of Gm10768 was sensitively increased in the mouse liver during fasting. Gm10768 was also robustly induced by gluconeogenic hormones in hepatocytes, consistent with the notion that expression of lncRNAs is stringently governed by nutritional signals to meet the metabolic needs of the animals. These findings also strongly suggest that Gm10768 might be able to promote gluconeogenesis. Indeed, overexpression or knockdown of Gm10768 by adenoviruses disturbs hepatic glucose production. As known, dysregulation of hepatic gluconeogenesis has been implicated in the pathogenesis of metabolic disorders, such as hyperglycemia. We showed that Gm10768 was markedly increased in the liver of the diabetic animal model. Liver-specific inhibition of endogenous Gm10768 improved glucose tolerance and insulin sensitivity, indicating that manipulating Gm10768 may provide an additional choice for diabetes treatment.
The mechanism of most lncRNAs is still far from being understood. Current evidence indicates that lncRNAs localize in the nuclei, cytosol, or both. The functions of lncRNAs are in general associated with their subcellular localization. In cytosol, lncRNAs are believed to competitively bind to their target miRNAs, thus exerting their functions via promoting or decreasing miRNA expression levels. In contrast, nuclear lncRNAs can act as transcriptional coactivators, repressors, or regulators of chromatin structures via cis and/or trans mechanisms (6). For cis-acting lncRNAs, their regulatory functions are restricted within nearby genes on the same chromosome, whereas trans-acting lncRNAs can either activate or repress gene transcription at independent loci. In our study, Gm10768 was distributed both in cytosol and in nuclei. Of note, the Gm10768 transcription site is very close to its upstream gene Abcc2, suggesting that Gm10768 may serve as a cis-acting lncRNA. However, no change in Abcc2 expression was found in response to Gm10768 overexpression. Thus, the possibility that Gm10768 is a cis-acting lncRNA can be excluded. Further investigation is required to elucidate whether Gm10768 functions in a trans manner.
Various miRNAs actively regulate hepatic gluconeogenesis (25). For example, miR-29a–c decreases hepatic glucose production in primary hepatocytes, and adenovirus-mediated overexpression of miR-29a–c in the liver improves glucose tolerance and insulin resistance of both db/db diabetic and diet-induced obese mice (17). Furthermore, miR-802, miR-214, miR-23a, miR-22, miR-378, and miR-451a have substantial effects on hepatic glucose production (15, 16, 18–21). Specifically, the expression levels of miR-214 were suppressed in the starvation or in diabetic conditions (18), and Gm10768 expression levels were elevated in these two settings. Thus, Gm10768 and miR-214 are negatively correlated and show an inverse expression pattern in the mouse liver. Indeed, overexpression of Gm10768 inhibited the expression levels of miR-214. Therefore, we hypothesized that Gm10768 may function by targeting miR-214. Coinciding with our hypothesis, forced expression of miR-214 significantly suppressed glucose production in mouse primary hepatocytes, and Gm10768 abrogated the negative effect of miR-214 on glucose production and gluconeogenic gene expression. These findings confirmed our hypothesis and suggested that Gm10768 interacts with miR-214 in the regulation of hepatic gluconeogenesis. In contrast, lncRNA can indirectly enhance downstream protein expression by sequestering miRNAs in the cytosol (14). Here, we showed that the cytosolic fraction of Gm10768 was increased in response to nutrient signals. However, we still do not know whether the translocation of Gm10768 from nuclei to cytosol is required for the regulation of miR-214, because the abundance of Gm17608 was increased in both compartments in our system. To thoroughly answer this question, further experiments should be performed to address the following two concerns. 1) Which part of Gm10768 is responsible for its translocation? 2) How to avoid unpredictable dysfunction of Gm10768 when artificially manipulating this part?
Previous studies have demonstrated miR-214 regulates hepatic gluconeogenesis by inhibiting ATF4 (18). ATF4 is a positive regulator involved in hepatic gluconeogenesis, and glucose production rate was significantly reduced in the liver of ATF4−/− mice (26–28). Considering the negative relationship between miR-214 and ATF4, inhibition of miR-214 by Gm10768 may help to relieve the detainment of ATF4, thus accelerating the gluconeogenic process. We found that overexpression of miR-214 results in a significant decrease of ATF4 expression, whereas forced expression of Gm10768 rescued ATF4 expression in the presence of miR-214 in mouse primary hepatocytes. Thus, relieving ATF4 from miR-214's suppression may be one of the critical steps in Gm10768-orchestrated hepatic gluconeogenesis.
In summary, we identified Gm10768 as a new lncRNA actively regulating mouse hepatic gluconeogenesis. The positive effects of Gm10768 on gluconeogenesis are achieved at least partially through inhibiting miR-214. Although Gm10768 is only found in mice and Drosophila, our findings will shed some light on the further understanding of lncRNAs' regulation in metabolic processes.
Experimental procedures
Animal experiments
All the animal experiments conformed to guidelines for the Care and Use of Animals published by Institutional Animal Ethical Committee. The 6–8-week-old C57BL/6J and db/db mice were purchased from the Model Animal Research Center of Nanjing University (Nanjing, China) and maintained on a 12-h light/dark cycle with free access to food and water. For the fasting experiment, animals were fed with the standard chow ad libitum or fasted for 16 h or a 16-h fasting followed by 8-h refeeding. For Gm10768 overexpression in vivo, the full-length cDNA encoding mouse Gm10768 was cloned into an adenoviral vector. For long-term gene silencing, an oligonucleotide containing the number 2 siRNA sequence targeting Gm10768 was constructed into the adenoviral vector to endogenously express shRNA. The adenoviruses used for the overexpression (Ad-Gm10768) or knockdown (Ad-Gm10768 shRNA) of Gm10768 were amplified in HEK293A cells (ATCC) and subsequently purified by CsCl gradient centrifugation. Adenoviruses expressing green fluorescent proteins (Ad-GFP) and scramble shRNAs were used as controls. Mice were injected intravenously through the tail vein with adenoviruses at a dose of 1 × 10⁹ plaque-forming units (PFU) per mouse. After 4–8 days, animal experiments were performed, and serum and liver samples were collected for further analyses.
Primary hepatocyte culture and treatments
Primary hepatocytes were isolated from 6- to 8-week-old C57BL/6J mice by collagenase perfusion and maintained with DMEM/F-12 medium (Gibco) in six-well plates as described previously (29). To investigate the effects of gluconeogenic signals on Gm10768 expression, primary hepatocytes were treated with 10 μm FSK (Sigma) or 1 μm HCS (Sigma) for 3–24 h, respectively. For overexpression experiments, primary hepatocytes were infected with adenoviruses encoding the full-length of mouse Gm10768 or 4833411C07Rik cDNAs (HANBIO, Shanghai, China). However, to knock down endogenous lncRNA expression, two siRNAs targeting either Gm10768 or 4833411C07Rik (Thermo Fisher Scientific, Waltham, MA) were designed, synthesized, and transfected into primary mouse hepatocytes individually, to avoid an off-target effect. For miRNA overexpression experiments, primary hepatocytes were transfected with miR-214 or miR-22 mimics (Thermo Fisher Scientific) at the indicated concentrations. Cells treated with mock adenoviruses or scramble siRNA served as controls. Primers for Gm10768 and pri-miR-214 full-length amplification, and sequences of siRNA oligonucleotides are listed in Table S3.
Glucose production assay
Mouse primary hepatocytes were incubated in glucose-free DMEM supplemented with 20 mm lactate and 2 mm pyruvate after washing twice with PBS. After 6 h of incubation, the culture medium was collected, and the glucose concentration was measured using a glucose assay kit (GAGO-20, Sigma). The values were then normalized to the total protein levels.
RACE
5′- and 3′-RACE were performed using a SMARTer RACE kit (Clontech) according to the manufacturer's instructions. The resulting PCR products were separated on a 1% agarose gel and cloned into a pMD-19T vector. The transcription start and end sites of Gm10768 were determined by sequencing. The gene-specific primers used for 5′- and 3′-RACE are provided in Table S2.
Subcellular fractionation
Nuclear and cytoplasmic fractions of 107 primary hepatocytes or 75-mg liver tissues were partitioned as described previously (30, 31). In brief, cells or liver homogenates were collected and lysed for 10 min in 500 μl of ice-cold cell fractionation buffer from the PARIS kit (Thermo Fisher Scientific). Samples were centrifuged at 500 × g for 5 min, and then the cytoplasmic lysate was carefully aspirated away from the nuclear pellets. RNA extraction, reverse transcription, and RT-qPCR were performed as described above. 45S rRNA and 12S rRNA were used as markers of nuclei and cytosol, respectively.
GTT, ITT, and PTT
For GTT, mice fasted for 6 h were injected intraperitoneally with d-glucose at a dose of 2 g/kg. The dose of glucose used for GTT assays performed in db/db mice was decreased to 1 g/kg per mouse. For PTT, mice fasted overnight were injected intraperitoneally with pyruvate at a dose of 2 g/kg. For ITT, mice were injected with insulin intraperitoneally at a dose of 0.75 units/kg after 6 h of fasting. The dose of insulin used for ITT assays performed in db/db mice was increased to 2 units/kg per mouse. Blood glucose levels were measured at the indicated times after injection using a glucometer (Roche Applied Science, Basel, Switzerland).
Blood biochemical analysis
The serum insulin levels were measured by a commercial ELISA kit (Millipore, Billerica, MA). Serum concentrations of ALT and AST were measured using an automated Monarch device (Nanjing Maternal and Child Health Hospital, Nanjing, China).
Gene expression and Western blot analyses
Total RNA of cells or tissues were extracted using TRIzol reagent (Invitrogen), according to the manufacturer's protocol. Normalized RNA was reverse-transcribed using a high-capacity cDNA kit (Takara, Tokyo, Japan), and the expression levels of genes were analyzed by RT-qPCR using the SYBR Green method (Life Technologies, Inc.). For lncRNAs and mRNAs, 36B4 was taken as the internal control. Specific primers used for RT-qPCR are shown in Table S3. Melting curve analysis was used to validate the primers and is provided in Fig. S6. Relative expression levels of miRNAs were quantified using commercial miRNA probes (TaqMan, Applied Biosystems, Foster City, CA) and normalized to snRNA U6. Relative fold changes of mRNA or miRNA were further calculated using the 2−ΔΔCtt method.
For protein analysis, cell and tissue samples were lysed in RIPA buffer containing protease inhibitors (Beyotime, Beijing, China). Protein concentration was determined with a BCA protein assay kit (Thermo Fisher Scientific, Rockford, IL). Equal amounts of protein were loaded and separated by SDS-PAGE and then transferred onto a nitrocellulose membrane (Millipore, Bedford, MA). The membrane was probed overnight with the anti-G6Pase (ab83690, Abcam), anti-PEPCK (sc-271029, Santa Cruz Biotechnology), or anti-ATF4 antibody (ab1371, Abcam), and then was visualized using horseradish peroxidase-conjugated secondary antibodies. β-Actin was taken as a loading control. Immunopositive bands were detected and quantified using the FluorChem M system (Proteinsimple, San Jose, CA).
Bioinformatics prediction and luciferase reporter assay
The potential miR-22- and miR-214–binding sites of Gm10768 were predicted by RNA hybrid (32). To confirm the physical interaction between Gm10768 and its target miRNAs, two putative miRNA-binding sites were synthesized and cloned into the NotI and XhoI sites of psiCHECK-2 vector (Promega, Madison, WI). A non-functional mutant was generated in parallel to disrupt the complementary base-pairing. To evaluate the functions of Gm10768 and miR-214 in regulating Atf expression, the 3′-UTR region of mouse Atf4 cDNA containing 14 putative target sites for miR-214 was synthesized and was inserted between NotI and XhoI restriction enzyme cutting sites, immediately downstream of the luciferase gene in the psiCHECK-2 vector. Also, a mutant version of these sites was generated. All WT and mutation inserts were confirmed by sequencing. For the luciferase reporter assays, HEK293T cells (ATCC) were seeded into 24-well plates in triplicate and transfected with miR-214 mimics or control mimics, together with plasmids encoding Gm10768 and Atf4 3′ UTR region, or their respective mutations for 48 h. Relative luciferase activities (ratios of Renilla luciferase signal normalized to firefly luciferase) were determined 48 h after transfection. Equal amounts of DNA and mimics or adenoviruses were used for all the experiments by adding appropriate vectors. All the luciferase reporter experiments were performed in triplicate.
Statistical analysis
All data are presented as mean ± S.D. and analyzed by unpaired Student's t tests or one-way ANOVA analysis when indicated. Statistical analyses were performed using the IBM SPSS 20 software (IBM, Armonk, NY). p values less than 0.05 were considered to be statistically significant.
Author contributions
X. C. designed the study, performed the experiments, analyzed the data, and wrote the manuscript. J. T., Y. S., C. S., Y. L., J. W., and Z. Z. performed the experiments. C. J., Z. Z., and S. C. analyzed the data and wrote the manuscript. S. C., X. G., and C. L. designed, conceived, supervised the study, and wrote the manuscript.
Supplementary Material
This work was supported by National Natural Science Foundation of China Grants 31771298, 31422028, 81670773, 81770837, and 81301616, National Science Foundation of Jiangsu Province of China Grant BK20161057, the Collaborative Innovation Center for Cardiovascular Disease Translational Medicine (Nanjing Medical University), and the Priority Academic Program Development of Jiangsu Higher Education Institutions. The authors declare that they have no conflicts of interest with the contents of this article.
This article contains Figs. S1–S6, Tables S1–S3, supporting Experiment procedures, and supporting Refs. 1–4.
Please note that the JBC is not responsible for the long-term archiving and maintenance of this site or any other third party hosted site.
- T2D
- type 2 diabetes
- PEPCK
- phosphoenolpyruvate carboxykinase
- G6Pase
- glucose-6-phosphatase
- lncRNAs
- long non-coding RNA
- RACE
- rapid amplification of cDNA ends
- FISH
- fluorescence in situ hybridization
- RT-qPCR
- reverse transcription-quantitative PCR
- FSK
- forskolin
- HCS
- hydrocortisone
- Fasn
- fatty-acid synthase
- ALT
- alanine aminotransferase
- AST
- aspartate aminotransaminase
- GTT
- glucose tolerance test
- ITT
- insulin tolerance test
- PTT
- pyruvate tolerance test
- shRNA
- short hairpin RNA
- TM
- tunicamycin
- m.o.i.
- multiplicity of infection
- ANOVA
- analysis of variance
- miRNA
- microRNA
- snRNA
- small nuclear RNA
- PFU
- plaque-forming unit
- nt
- nucleotide
- ER
- endoplasmic reticulum.
References
- 1. Rui L. (2014) Energy metabolism in the liver. Compr. Physiol. 4, 177–197 [DOI] [PMC free article] [PubMed] [Google Scholar]
- 2. Rines A. K., Sharabi K., Tavares C. D., and Puigserver P. (2016) Targeting hepatic glucose metabolism in the treatment of type 2 diabetes. Nat. Rev. Drug Discov. 15, 786–804 10.1038/nrd.2016.151 [DOI] [PMC free article] [PubMed] [Google Scholar]
- 3. Basu R., Chandramouli V., Dicke B., Landau B., and Rizza R. (2005) Obesity and type 2 diabetes impair insulin-induced suppression of glycogenolysis as well as gluconeogenesis. Diabetes 54, 1942–1948 10.2337/diabetes.54.7.1942 [DOI] [PubMed] [Google Scholar]
- 4. Sharabi K., Tavares C. D., Rines A. K., and Puigserver P. (2015) Molecular pathophysiology of hepatic glucose production. Mol. Aspects Med. 46, 21–33 10.1016/j.mam.2015.09.003 [DOI] [PMC free article] [PubMed] [Google Scholar]
- 5. Ponting C. P., Oliver P. L., and Reik W. (2009) Evolution and functions of long noncoding RNAs. Cell 136, 629–641 10.1016/j.cell.2009.02.006 [DOI] [PubMed] [Google Scholar]
- 6. Fatica A., and Bozzoni I. (2014) Long non-coding RNAs: new players in cell differentiation and development. Nat. Rev. Genet. 15, 7–21 10.1038/nrg3606 [DOI] [PubMed] [Google Scholar]
- 7. Batista P. J., and Chang H. Y. (2013) Long noncoding RNAs: cellular address codes in development and disease. Cell 152, 1298–1307 10.1016/j.cell.2013.02.012 [DOI] [PMC free article] [PubMed] [Google Scholar]
- 8. Knoll M., Lodish H. F., and Sun L. (2015) Long non-coding RNAs as regulators of the endocrine system. Nat. Rev. Endocrinol. 11, 151–160 10.1038/nrendo.2014.229 [DOI] [PMC free article] [PubMed] [Google Scholar]
- 9. Zhao X. Y., and Lin J. D. (2015) Long noncoding RNAs: a new regulatory code in metabolic control. Trends Biochem. Sci. 40, 586–596 10.1016/j.tibs.2015.08.002 [DOI] [PMC free article] [PubMed] [Google Scholar]
- 10. Zhu X., Wu Y. B., Zhou J., and Kang D. M. (2016) Upregulation of lncRNA MEG3 promotes hepatic insulin resistance via increasing FoxO1 expression. Biochem. Biophys. Res. Commun. 469, 319–325 10.1016/j.bbrc.2015.11.048 [DOI] [PubMed] [Google Scholar]
- 11. Ruan X., Li P., Cangelosi A., Yang L., and Cao H. (2016) A long non-coding RNA, lncLGR, regulates hepatic glucokinase expression and glycogen storage during fasting. Cell Rep. 14, 1867–1875 10.1016/j.celrep.2016.01.062 [DOI] [PMC free article] [PubMed] [Google Scholar]
- 12. Chang A. J., Ortega F. E., Riegler J., Madison D. V., and Krasnow M. A. (2015) Oxygen regulation of breathing through an olfactory receptor activated by lactate. Nature 527, 240–244 10.1038/nature15721 [DOI] [PMC free article] [PubMed] [Google Scholar]
- 13. Li M., Sun X., Cai H., Sun Y., Plath M., Li C., Lan X., Lei C., Lin F., Bai Y., and Chen H. (2016) Long non-coding RNA ADNCR suppresses adipogenic differentiation by targeting miR-204. Biochim. Biophys. Acta 1859, 871–882 10.1016/j.bbagrm.2016.05.003 [DOI] [PubMed] [Google Scholar]
- 14. Salmena L., Poliseno L., Tay Y., Kats L., and Pandolfi P. P. (2011) A ceRNA hypothesis: the Rosetta Stone of a hidden RNA language? Cell 146, 353–358 10.1016/j.cell.2011.07.014 [DOI] [PMC free article] [PubMed] [Google Scholar]
- 15. Kaur K., Vig S., Srivastava R., Mishra A., Singh V. P., Srivastava A. K., and Datta M. (2015) Elevated hepatic miR-22–3p expression impairs gluconeogenesis by silencing the Wnt-responsive transcription factor Tcf7. Diabetes 64, 3659–3669 10.2337/db14-1924 [DOI] [PubMed] [Google Scholar]
- 16. Liu W., Cao H., Ye C., Chang C., Lu M., Jing Y., Zhang D., Yao X., Duan Z., Xia H., Wang Y. C., Jiang J., Liu M. F., Yan J., and Ying H. (2014) Hepatic miR-378 targets p110α and controls glucose and lipid homeostasis by modulating hepatic insulin signalling. Nat. Commun. 5, 5684 10.1038/ncomms6684 [DOI] [PubMed] [Google Scholar]
- 17. Liang J., Liu C., Qiao A., Cui Y., Zhang H., Cui A., Zhang S., Yang Y., Xiao X., Chen Y., Fang F., and Chang Y. (2013) MicroRNA-29a-c decrease fasting blood glucose levels by negatively regulating hepatic gluconeogenesis. J. Hepatol. 58, 535–542 10.1016/j.jhep.2012.10.024 [DOI] [PubMed] [Google Scholar]
- 18. Li K., Zhang J., Yu J., Liu B., Guo Y., Deng J., Chen S., Wang C., and Guo F. (2015) MicroRNA-214 suppresses gluconeogenesis by targeting activating transcriptional factor 4. J. Biol. Chem. 290, 8185–8195 10.1074/jbc.M114.633990 [DOI] [PMC free article] [PubMed] [Google Scholar]
- 19. Zhuo S., Yang M., Zhao Y., Chen X., Zhang F., Li N., Yao P., Zhu T., Mei H., Wang S., Li Y., Chen S., and Le Y. (2016) MicroRNA-451 negatively regulates hepatic glucose production and glucose homeostasis by targeting glycerol kinase-mediated gluconeogenesis. Diabetes 65, 3276–3288 10.2337/db16-0166 [DOI] [PubMed] [Google Scholar]
- 20. Kornfeld J. W., Baitzel C., Könner A. C., Nicholls H. T., Vogt M. C., Herrmanns K., Scheja L., Haumaitre C., Wolf A. M., Knippschild U., Seibler J., Cereghini S., Heeren J., Stoffel M., and Brüning J. C. (2013) Obesity-induced overexpression of miR-802 impairs glucose metabolism through silencing of Hnf1b. Nature 494, 111–115 10.1038/nature11793 [DOI] [PubMed] [Google Scholar]
- 21. Wang B., Hsu S. H., Frankel W., Ghoshal K., and Jacob S. T. (2012) Stat3-mediated activation of microRNA-23a suppresses gluconeogenesis in hepatocellular carcinoma by down-regulating glucose-6-phosphatase and peroxisome proliferator-activated receptor γ, coactivator 1 α. Hepatology 56, 186–197 10.1002/hep.25632 [DOI] [PMC free article] [PubMed] [Google Scholar]
- 22. Thiel G., Al Sarraj J., and Stefano L. (2005) cAMP response element binding protein (CREB) activates transcription via two distinct genetic elements of the human glucose-6-phosphatase gene. BMC Mol. Biol. 6, 2 10.1186/1471-2199-6-2 [DOI] [PMC free article] [PubMed] [Google Scholar]
- 23. Wang X., Guo B., Li Q., Peng J., Yang Z., Wang A., Li D., Hou Z., Lv K., Kan G., Cao H., Wu H., Song J., Pan X., Sun Q., et al. (2013) miR-214 targets ATF4 to inhibit bone formation. Nat. Med. 19, 93–100 10.1038/nm.3026 [DOI] [PubMed] [Google Scholar]
- 24. Li P., Ruan X., Yang L., Kiesewetter K., Zhao Y., Luo H., Chen Y., Gucek M., Zhu J., and Cao H. (2015) A liver-enriched long non-coding RNA, lncLSTR, regulates systemic lipid metabolism in mice. Cell Metab. 21, 455–467 10.1016/j.cmet.2015.02.004 [DOI] [PMC free article] [PubMed] [Google Scholar]
- 25. Reyes R. K., Motiwala T., and Jacob S. T. (2014) Regulation of glucose metabolism in hepatocarcinogenesis by microRNAs. Gene Expr. 16, 85–92 10.3727/105221614X13919976902093 [DOI] [PMC free article] [PubMed] [Google Scholar]
- 26. Seo J., Fortuno E. S. 3rd., Suh J. M., Stenesen D., Tang W., Parks E. J., Adams C. M., Townes T., and Graff J. M. (2009) Atf4 regulates obesity, glucose homeostasis, and energy expenditure. Diabetes 58, 2565–2573 10.2337/db09-0335 [DOI] [PMC free article] [PubMed] [Google Scholar]
- 27. Li W., and Miller R. A. (2015) Elevated ATF4 function in fibroblasts and liver of slow-aging mutant mice. J. Gerontol. A Biol. Sci. Med. Sci. 70, 263–272 10.1093/gerona/glu040 [DOI] [PMC free article] [PubMed] [Google Scholar]
- 28. Yoshizawa T., Hinoi E., Jung D. Y., Kajimura D., Ferron M., Seo J., Graff J. M., Kim J. K., and Karsenty G. (2009) The transcription factor ATF4 regulates glucose metabolism in mice through its expression in osteoblasts. J. Clin. Invest. 119, 2807–2817 10.1172/JCI39366 [DOI] [PMC free article] [PubMed] [Google Scholar]
- 29. Bantubungi K., Hannou S. A., Caron-Houde S., Vallez E., Baron M., Lucas A., Bouchaert E., Paumelle R., Tailleux A., and Staels B. (2014) Cdkn2a/p16Ink4a regulates fasting-induced hepatic gluconeogenesis through the PKA-CREB-PGC1a pathway. Diabetes 63, 3199–3209 10.2337/db13-1921 [DOI] [PubMed] [Google Scholar]
- 30. Zhao X. Y., Li S., Wang G. X., Yu Q., and Lin J. D. (2014) A long noncoding RNA transcriptional regulatory circuit drives thermogenic adipocyte differentiation. Mol. Cell 55, 372–382 10.1016/j.molcel.2014.06.004 [DOI] [PMC free article] [PubMed] [Google Scholar]
- 31. Cui X., You L., Li Y., Zhu L., Zhang F., Xie K., Cao Y., Ji C., and Guo X. (2016) A transcribed ultraconserved noncoding RNA, uc.417, serves as a negative regulator of brown adipose tissue thermogenesis. FASEB J. 30, 4301–4312 10.1096/fj.201600694R [DOI] [PubMed] [Google Scholar]
- 32. Krüger J., and Rehmsmeier M. (2006) RNAhybrid: microRNA target prediction easy, fast and flexible. Nucleic Acids Res. 34, W451–W454 10.1093/nar/gkl243 [DOI] [PMC free article] [PubMed] [Google Scholar]
- 33. Rehmsmeier M., Steffen P., Hoechsmann M., and Giegerich R. (2004) Fast and effective prediction of microRNA/target duplexes. RNA 10, 1507–1517 10.1261/rna.5248604 [DOI] [PMC free article] [PubMed] [Google Scholar]
Associated Data
This section collects any data citations, data availability statements, or supplementary materials included in this article.


