Abstract
Phosphoglycerate mutase 1 (PGAM1) is upregulated in many cancer types and involved in cell proliferation, migration, invasion, and apoptosis. However, the relationship between PGAM1 and prostate cancer is poorly understood. The present study investigated the changes in PGAM1 expression in prostate cancer tissues compared with normal prostate tissues and examined the cellular function of PGAM1 and its relationship with clinicopathological variables. Immunohistochemistry and Western blotting revealed that PGAM1 expression was upregulated in prostate cancer tissues and cell lines. PGAM1 expression was associated with Gleason score (P = 0.01) and T-stage (P = 0.009). Knockdown of PGAM1 by siRNA in PC-3 and 22Rv1 prostate cancer cell lines inhibited cell proliferation, migration, and invasion and enhanced cancer cell apoptosis. In a nude mouse xenograft model, PGAM1 knockdown markedly suppressed tumor growth. Deletion of PGAM1 resulted in decreased expression of Bcl-2, enhanced expression of Bax, caspases-3 and inhibition of MMP-2 and MMP-9 expression. Our results indicate that PGAM1 may play an important role in prostate cancer progression and aggressiveness, and that it might be a valuable marker of poor prognosis and a potential therapeutic target for prostate cancer.
Keywords: apoptosis, invasion, migration, phosphoglycerate mutase 1, proliferation, prostate cancer
INTRODUCTION
Prostate cancer (PCa) is the second most common cancer diagnosed in men and the fifth leading cause of male cancer deaths worldwide.1 Despite the availability of various treatment strategies, including surgery, radiotherapy, chemotherapy, and endocrine and targeted therapies, prognosis remains very poor especially for patients with castration-resistant PCa (CRPC).2,3 Current diagnostic and prognostic indicators, such as prostate-specific antigen (PSA) and Gleason score, have highly variable, which can lead to failed diagnosis and prognosis.4,5 Additionally, the pathogenesis of PCa development and metastasis is not completely understood. Hence, there is an urgent need for better understanding of the molecular mechanisms underlying PCa carcinogenesis and progression to facilitate identification of novel molecular targets for diagnosis and therapy.
Phosphoglycerate mutase 1 (PGAM1) is an important enzyme in glycolysis, which catalyzes the conversion of 3-phosphoglycerate (3-PG) to 2-phosphoglycerate (2-PG).6 In a study that used chemistry-based proteome reactivity profiling to identify drug targets in breast cancer, PGAM1 was identified as a potential metabolic enzyme related to breast carcinogenesis.7 Several subsequent studies have demonstrated that PGAM1 is usually upregulated in a range of human cancers, such as hepatocellular carcinoma, lung cancer, breast cancer, colorectal cancer, and renal clear cell carcinoma, and that its enzymatic activity was increased in cancerous tissues compared with adjacent normal tissues.8,9,10,11 Moreover, knocking down PGAM1 attenuated lung and breast cancer cell growth in nude mouse xenograft models.10,12 However, the relationship between PGAM1 and PCa has not been extensively investigated.
In this study, we investigated changes in PGAM1 expression in PCa tissues compared with normal prostate tissues, and examined the relationship of PGAM1 with clinicopathological variables and its cellular function in relation to tumorigenesis, to evaluate its potential value as a biomarker and for use in targeted therapy for PCa.
MATERIALS AND METHODS
Tissue microarray and cell culture
A human prostate tissue microarray (TMA; PR1921) was purchased from US Biomax, Inc. (Rockville, MD, USA). The TMA contained both normal prostate tissues and PCa tissues along with each patient's age, clinical stage, Gleason score, and metastasis status.
Four human PCa cell lines, PC-3, 22Rv1, DU145, and LNCap (ATCC, Manassas, VA, USA), and a human prostate epithelial cell line, RWPE1 (ATCC), were used in this study. The cell lines were identified by short tandem repeat genotype analysis and cultured in RPMI-1640 (Gibco, Grand Island, NY, USA) medium with 10% bovine serum at 37°C in an atmosphere containing 5% CO2.
Immunohistochemistry
Immunohistochemistry was performed on the TMA according to the manufacturer's recommended protocols.13,14 Briefly, the TMA slides were deparaffinized and rehydrated, and then endogenous tissue peroxides were quenched by incubation with 0.3% H2O2 for 30 min. For antigen retrieval, the slides were boiled in sodium citrate buffer (10 mmol l−1, pH 6.0) in a pressure cooker for 7 min. Subsequently, nonspecific binding was blocked with 5% normal goat serum, and then the slides were incubated with primary rabbit anti-human PGAM1 polyclonal antibody (1:200, Abcam Inc., Cambridge, MA, USA) overnight at 4°C, then with anti-rabbit secondary antibody (Zhongshan Biotech, Zhongshan, China). Diaminobenzidine was visualized as a chromogen substrate. The slides were counterstained with hematoxylin, then dehydrated and mounted with glass coverslips according to standard laboratory protocol.
The positive staining intensity of PGAM1 was scored into four categories: 0, negative; 1, weakly positive; 2, intermediately positive; and 3, strongly positive. The percentage of PGAM1 positive cells was scored as four categories: 0, no staining; 1: <25% cells; 2: 25%–75% cells; and 3: >75% cells. The total protein expression score (ranging from 0 to 9) of a sample was obtained by the multiplication of the intensity and percentage scores, as previously described.15 The staining pattern of TMA was scored based on the total protein expression scores as follows: total protein expression score 0, −; 1–3, +; 4–6, ++; and 6–9, +++. We subsequently divided our cases into two groups using total protein expression scores: cases with total expression score 0–3 (−/+) were assigned to the low expression group, and cases with total expression score 4–9 (++/+++) were assigned to the high expression group.
Western blotting
Total protein was extracted from cell lysates using radioimmunoprecipitation assay buffer (Beyotime Biotechnology, Shanghai, China). Equal amounts of total protein samples were separated by SDS-polyacrylamide gel electrophoresis and electrotransferred from the gel to polyvinylidene fluoride membranes (Millipore Corporation, Billerica, MA, USA). The membranes were blocked with 5% fat-free milk or bovine serum albumin, and then immunoblotted using the following primary antibodies: rabbit anti-PGAM1 (1:1000; Abcam), rabbit polyclonal anti-cleaved caspase-3 (1:500, #9664; Cell Signaling Technology, Danvers, MA, USA); and rabbit polyclonal anti-Bcl-2, anti-Bax, anti-matrix metallopeptidase (MMP)-2, and anti-MMP-9 (all 1:500; all Immunoway, Plano, TX, USA). Anti-β-actin staining (1:1000; Bioworld Technology, Louis Park, MN, USA) was used as an internal control. Finally, the membranes were incubated with the appropriate secondary antibodies (1:5000; Boster Ltd., Wuhan, China). Signals were visualized using an enhanced chemiluminescence detection system (Pierce Biotechnology, Rockford, IL, USA) in accordance with the manufacturer's instructions.
Short interfering (si) RNA transfection
Two siRNAs were designed for PGAM1 knockdown. The sequences were as follows: 5′-GUCCUGUCCAAGUGUAUCUTT-3′ and 5′-AGAUACA CUUGGACAGGACTT-3′. The sequences of the negative control (NC) siRNA were as follows: 5′-UUCUUCGAACGUGUCACGUTT-3′ and 5′-ACGUGACACGUUCGGAGAATT-3′. The 22Rv1 and PC-3 cells were seeded (3 × 10⁵ cells per well) in six-well plates (Corning Costar, Corning, NY, USA). When the cells reached 70% confluence, they were transfected with siRNA using Lipofectamine 3000 reagent (Life Technologies, Carlsbad, CA, USA) according to the manufacturer's protocol.
Cell proliferation, migration, and invasion assays
The proliferation of transfected cells was evaluated by a CCK-8 assay (Kit Dojindo, Kumamoto, Japan) according to the manufacturer's protocol. Briefly, cells were seeded (3 × 10³ cells per well) in 96-well plates and cultured for 24, 48, 72, or 96 h. CCK-8 reagent (10 μl) was added to each well and the cells were incubated for 2 h, and then the absorbance at 450 nm was measured with a SpectraMax M5 microplate reader (Molecular Devices, Sunnyvale, CA, USA).
The migration and invasion abilities of siRNA-transfected cells were evaluated using a Transwell assay (Corning Costar, Corning, NY, USA). Briefly, 3 × 10⁴ cells resuspended in 2000 μl of serum-free medium were added to the upper chamber of a Transwell system with an 8-μm pore membrane. The chamber was uncoated (for the migration assay) or coated with Matrigel (BD Biocoat, Bedford, Mass, USA; for the invasion assay). The lower chamber contained 300 μl medium containing 10% fetal bovine serum. Cells were allowed to migrate for 24 h or invade for 48 h, and then the cells that had not penetrated the membrane were removed with a cotton swab. The cells on the lower surface of the membrane were fixed, stained, and counted under a light microscope in five randomly selected fields.
Flow cytometry analysis
Twenty-four hours after transfection, the cells were collected and washed twice with cold phosphate-buffered saline. Cell apoptosis was evaluated using an annexin V FITC apoptosis detection kit I (BD biosciences, Franklin Lakes, NJ, USA) according to the manufacturer's instructions. Apoptotic cells were detected by flow cytometry using a BD FACSVerse system.
Tumor xenograft model in nude mice and shRNA treatment
Lentivirus-mediated PGAM1 knockdown in PC-3 cells was achieved using a lentivirus kit according to the manufacturer's instruction (GeneCopoeia, Carlsbad, CA, USA). Briefly, the cells were infected with a lentivirus bearing short hairpin (sh) RNA targeting PGAM112 (5′-CCGGCAAGAACTTGA AGCCTATCAACTCGAGTT GATAGCTTCAAGTTCTTGTTTTTTG-3′) and a recombinant hnRNP-L lentivirus. The NC groups were infected with the empty lentiviral vector. The infection efficiency was validated by Western blotting analyses.
Female athymic mice (BALB/c-nu/nu; 4–5 weeks old) were purchased from the Animal Center of Southern Medical University and were housed in specific-pathogen-free conditions and bred in accordance with the institutional guidelines. To evaluate PCa tumor growth in vivo, 5 × 10⁶ PC-3 cells stably expressing PGAM1 shRNA via lentiviral infection or NC cells were injected subcutaneously and bilaterally into the flanks of athymic mice (6 mice per group). Tumor dimensions were measured on two perpendicular axes and tumor volume was calculated with the formula: volume = (length × width2)/2. The mice were euthanized by CO2 inhalation after 25 days and the tumors were removed and weighed, then the primary tumors were fixed, paraffin-embedded, and sectioned. The sections were stained with hematoxylin and eosin and observed under a microscope. All of the procedures were approved by the Institutional Animal Care and Use Committee of Southern Medical University.
Statistical analysis
Statistical analyses were performed using SPSS 20.0 software (SPSS Inc., Chicago, IL, USA). Data are expressed as mean ± s.e.m. The Student's t-test was used to analyze continuous data, the Chi-square test was used for categorical data, and factorial analysis of variance was used to analyze differences between groups. P < 0.05 was considered statistically significant.
RESULTS
PGAM1 expression levels in PCa tissues and cells
To detect PGAM1 expression in human PCa, immunohistochemical staining was performed on a total of 96 prostate tissue specimens processed in a TMA, including 16 and 80 PCa tissues. Based on PGAM1 staining levels (Figure 1a-1d), all prostate tissues were divided into two groups: a low expression group (− and +) and a high expression group (++/+++). Among the PCa tissues, 56 cases (70%) were classified as having high expression of PGAM, compared with only 4 cases (25%) among the nonneoplastic (normal or adjacent) tissues. Chi-square analysis revealed that PGAM1 expression levels were higher in PCa tissues than in nonneoplastic (normal or adjacent) tissues (P = 0.001, Table 1). As shown in Figure 1e, PGAM1 localized to the cytoplasm and nucleus in prostate cells. To validate the TMA data, Western blotting was carried out in four PCa cell lines (PC-3, 22Rv1, DU145, and LNCap) and a normal prostate epithelial cell (RWPE1). The results showed that PGAM1 protein expression levels were markedly higher in four PCa cell lines than in the RWPE1 cell line (Figure 1f).
Figure 1.
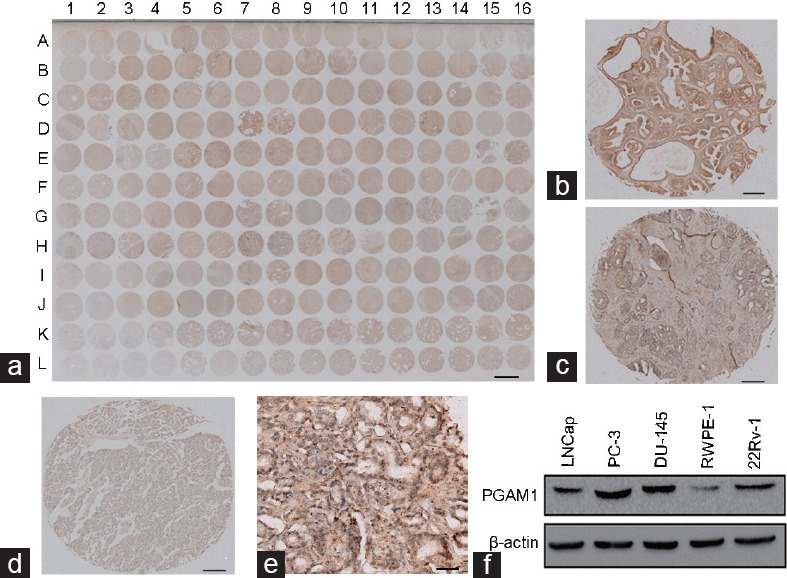
PGAM1 expression in prostate cancer tissues and prostate cancer cell lines. (a) The immunohistochemistry image of the whole TMA (scale bar = 1.5 mm). Representative immunohistochemistry images of PGAM1 protein expression from (a) with high intensity (b) in prostate cancer tissue (D7, scale bar = 0.2 mm), with intermediate intensity (c) in prostate cancer tissue (H7, scale bar = 0.2 mm), and with low intensity (d) in prostate cancer tissue (E4, scale bar = 0.2 mm). The percentage of PGAM1 positive cells in D7 is 90%, in H7 is 70%, and in E4 is 15%. Therefore, the percentage score of the case in D7 is 3 and its total protein expression score is 3 × 3 = 9. The percentage score of the case in H7 is 2 and its total protein expression score is 2 × 2 = 4. The percentage score of the case in E4 is 1 and its total protein expression score is 1 × 1 = 1. (e) Part of C14 from (a) with a magnification of 400× (scale bar = 50 μm). (f) Western blotting of PGAM1 protein expression in prostate cancer cell lines and normal prostate epithelial cell lines. PGAM1: phosphoglycerate mutase 1; TMA: tissue microarray.
Table 1.
Correlation between phosphoglycerate mutase 1 expression and clinicopathological variables of prostate cancer
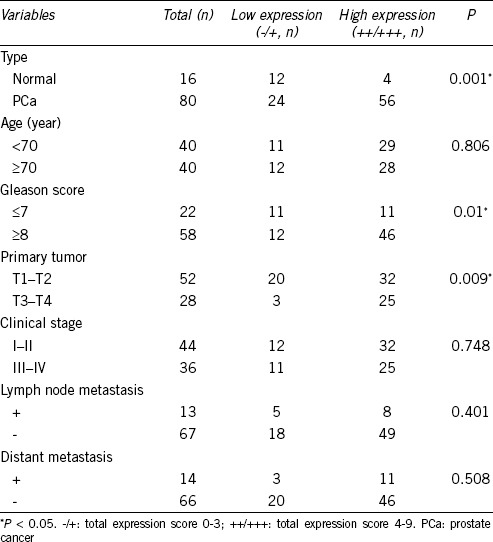
We then analyzed the relationship between PGAM1 expression levels and clinicopathological variables. Chi-square analysis showed that PGAM1 expression was not associated with patient age, clinical stage, or lymph node or distant metastasis status, but was statistically associated with Gleason score (P = 0.01) and T-stage (P = 0.009) (Table 1).
Inhibition of cell proliferation by PGAM1 knockdown
To determine the biological function of PGAM1 in PCa, siRNA targeting PGMA1 (si-PGAM1) was transfected into PC-3 and 22Rv1 cells to inhibit endogenous PGAM1 expression. Western blotting confirmed that the PGAM1 protein level markedly decreased in PC-3 and 22Rv1 cells transfected with si-PGAM1 compared with NC cells (Figure 2a). To determine the influence of PGAM1 knockdown on the proliferation ability of PCa cells in vitro, a CCK-8 assay was performed. Factorial analysis of variance demonstrated that PGAM1 knockdown inhibited proliferation of PC-3 and 22Rv1 cells at 72 h and 96 h, respectively, compared with NC cancer cells (P < 0.001, Figure 2b).
Figure 2.
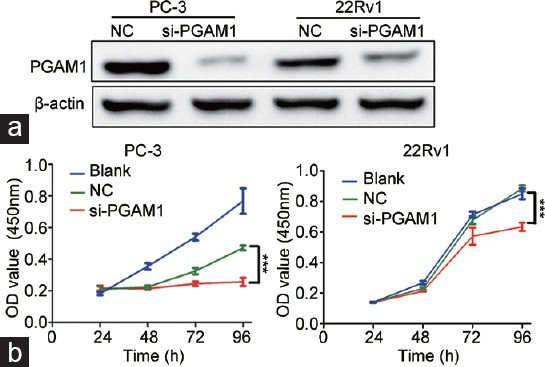
Knockdown of PGAM1 increased prostate cancer cell growth. (a) The effects of PGAM1 knockdown confirmed by Western blotting. (b) In the CCK-8 assay, cell viability was decreased in si-PGAM1 compared with NC and blank (n = 3). ***P < 0.001. NC: negative controls; OD: optical density; PGAM1: phosphoglycerate mutase 1.
PGAM1 knockdown enhanced apoptosis in PCa cells
Next, we used flow cytometry to determine whether the PGAM1 knockdown-induced inhibition of cell proliferation resulted from apoptosis. Twenty-four hours after transfection of PC-3 and 22Rv1 cells with siRNA, the number of both early and later apoptotic cells was markedly increased among cells transfected with si-PGAM1 compared with NC cells (Figure 3a). Student's t-test analysis revealed that the mean total number of apoptotic cells increased from 6.68 ± 0.64 to 20.50 ± 0.94 and from 4.77 ± 0.58 to 16.93 ± 1.55 in response to PGAM1 knockdown in PC-3 cells (P < 0.001) and 22Rv1 cells (P < 0.01), respectively (Figure 3b).
Figure 3.
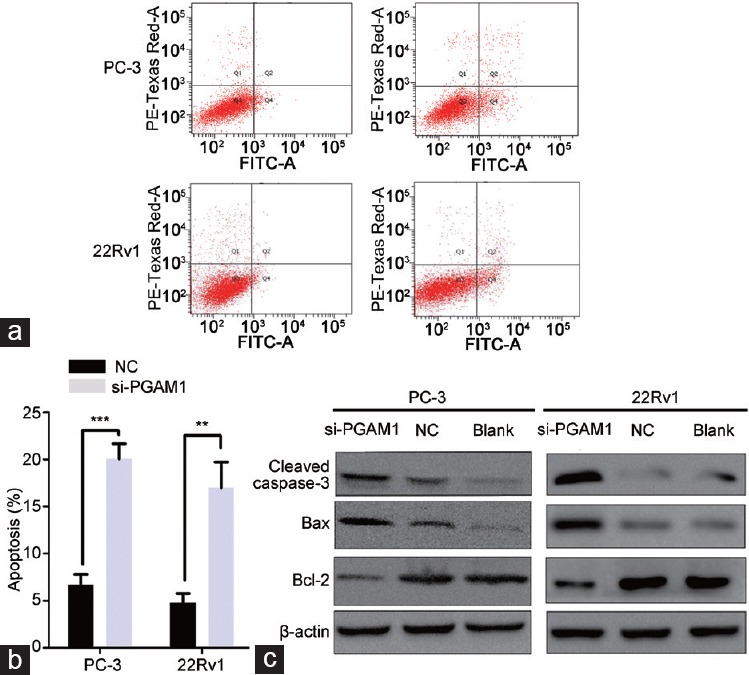
Enhanced cell apoptosis rate by downregulation of PGAM1. (a) PGAM1 knockdown increased the rate of apoptosis by flow cytometry. (b) Statistics analysis of the apoptosis rate in each group (n = 3, Student's t-test). (c) Western blot shown that PGAM1 knockdown increased the expression of cleaved caspase-3 and Bax, whereas the expression of Bcl-2 was decreased. **P < 0.01; ***P < 0.001. NC: negative controls; PGAM1: phosphoglycerate mutase 1; FITC-A: Fluorescein isothiocyanate-Annexin V.
To further analyze the potential mechanism underlying this promotion apoptosis by PGAM1 knockdown, we examined the expression of apoptosis-related proteins (Bcl-2, Bax, and cleaved caspase-3) by Western blotting. As shown in Figure 3c, the protein expression levels of Bax and cleaved caspase-3 significantly increased in response to PGAM1 knockdown compared with NC and blank PC-3 and 22Rv1 cells. Conversely, the expression of Bcl-2 decreased in si-PGAM1-transfected PCa cells.
PGAM1 knockdown inhibited PCa cells migration and invasion
We used Transwell chamber and Matrigel assays to investigate the effect of PGAM1 on PCa cell migration and invasion. The migration and invasion abilities of si-PGAM1-transfected PC-3 and 22Rv1 cells were prominently decreased compared with those of NC cells (Figure 4a). This was confirmed by Student's t-test analysis (P < 0.01, Figure 4b).
Figure 4.
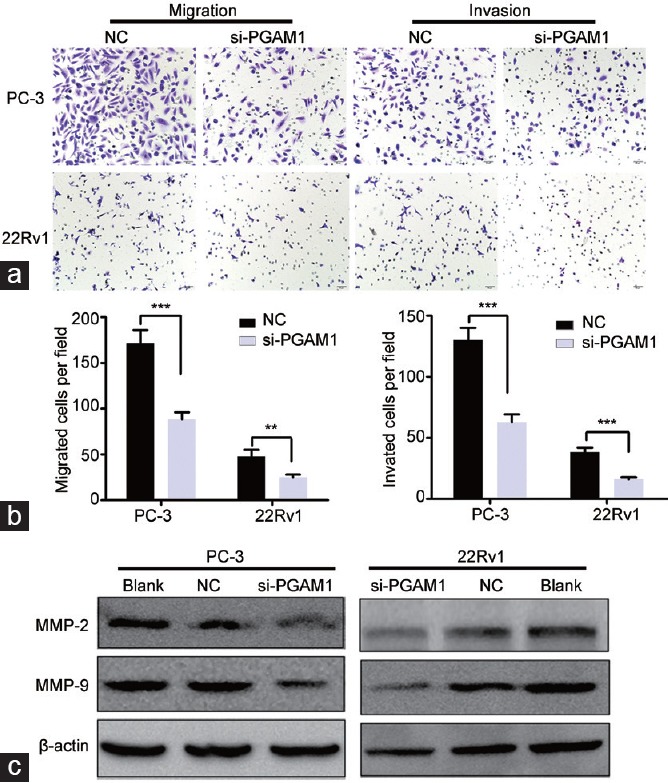
Knockdown of PGAM1 inhibited prostate cancer cell migration and invasion. (a) Transwell migration and transwell invasion assays showed that the cell numbers were markedly decreased in si-PGAM1 transfected cells (scale bars = 50 μm). (b) Statistics analysis of the mean migration and invasion cell numbers as compared with the negative control (n = 3). All experiments were performed three times independently. (c) Western blotting shown that PGAM1 knockdown decreased the expression of MMP-2 and MMP-9. **P < 0.01; ***P < 0.001. NC: negative controls; PGAM1: phosphoglycerate mutase 1. MMP: matrix metallopeptidase.
Because MMP-2 and MMP-9 are crucial for tumor cell migration and invasion, we examined their expression in PCa cells with PGAM1 knocked down. As expected, PGAM1 silencing downregulated MMP-2 and MMP-9 protein levels in PCa cells (Figure 4c).
Knockdown of PGAM1 inhibited xenograft tumor growth in vivo
To evaluate the impact of PGAM1 knockdown on tumor growth in vivo, we established a subcutaneous xenograft tumor model in athymic nude mice by injecting PC-3 cells infected with shRNA targeting PGAM1 or NC PC-3 cells. Results from Western blotting showed an obvious reduction of PGAM1 expression in PC-3 cells transfected with sh-PGAM1 compared with NC cells (Figure 5a). As expected, the cells with PGAM1 knocked down formed slower-growing xenografts compared with NC cells (P < 0.01, Figure 5b-5d). Hematoxylin and eosin staining revealed the histopathological features of the tumor tissues in xenograft tumors (Figure 5e).
Figure 5.
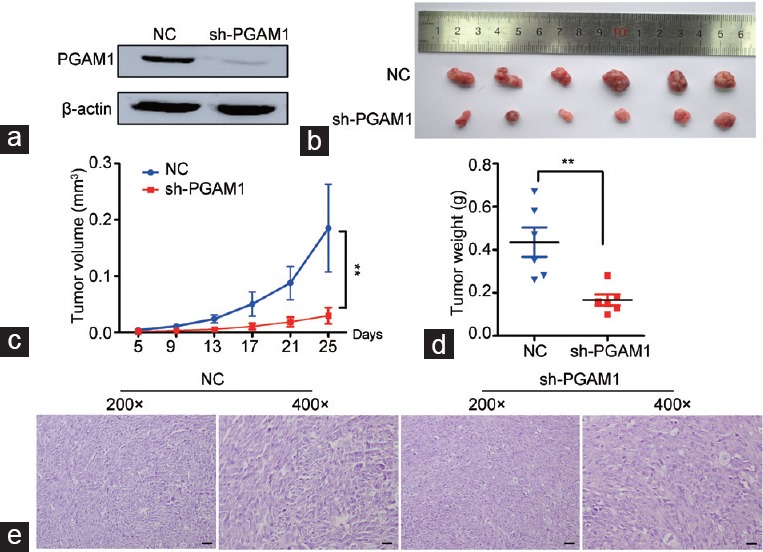
Knockdown of PGAM1 inhibits xenograft tumor growth in vivo. (a) The effects of PGAM1 knockdown by sh-PGAM1 transfected confirmed by Western blotting. (b) Gross observation of xenograft tumor size in NOD/SCID mice. Silencing of PGAM1 inhibited the tumor growth, including tumor (c) volume and (d) weight (n = 6). (e) H and E-stained paraffin-embedded sections obtained from xenografts. **P < 0.01. NC: negative controls; PGAM1: phosphoglycerate mutase 1; NOD: nonobese diabetic; SCID: severe combined immunodeficiency.
DISCUSSION
Tumor cells prefer the glycolysis pathway to make the oxidative phosphorylation more efficient, even under the nonhypoxia conditions. This characteristic of tumor cells is called “Warburg effect” or aerobic glycolysis, and it helps tumor cells produce more energy than normal cells.16 PGAM1 is a key enzyme that catalyzes the conversion of 3-PG and 2-PG in the glycolysis pathway. Hitosugi et al.12 found that PGAM1 knockdown elevated 3-PG levels, whereas it reduced 2-PG levels. By regulating the intracellular 3-PG and 2-PG levels in the glycolysis pathway, PGAM1 plays a specific role in coordinating biosynthesis and glycolysis to promote the cancer cell growth. Many studies have found that PGAM1 is overexpressed in diverse cancers, likely due to loss of TP53,17,18 and is important for tumorigenesis, invasion, and metastasis.19
Narayanan et al.20 used real-time polymerase chain reaction to demonstrate the expression levels of PGAM1mRNA were higher in LNCaP cell than that in the normal cell. Zhang et al.21 used modified serum-guided immunoblotting, two-dimensional gel electrophoresis, and MALDI-TOF mass spectrography in a differential proteomic study and found that PGAM1 expression levels were higher in PCa tissues than that in benign prostatic hyperplasia tissues. These previous studies strongly suggest that PGAM1 may be associated with PCa. However, neither study investigated the relationship between PGAM1 and PCa in depth.
In the present study, we demonstrated upregulated expression of PGAM1 in PCa. These results are consistent with previous reports about PGAM1 protein expression in PCa.20,21 Furthermore, our results revealed that PGAM1 expression was not associated with patients' age, clinical stage, or metastasis status, but that patients with higher Gleason scores and T stages exhibited increased PGAM1 expression, suggesting that PGAM1 might contribute to progression and aggressiveness in PCa to some extent.
We also investigated the function of PGAM1 in PCa. To date, relatively few studies have examined the biological function of PGAM1. Ren et al.11 demonstrated that knocking down PGAM1 expression with shRNA targeting PGAM1 induced liver cancer cell growth arrest and apoptosis in vitro and in vivo. Hitosugi et al.12 found that targeting PGAM1 using shRNA or a small molecule inhibitor resulted in notably decreased glycolysis and biosyntheses, accompanied by inhibited leukemia cell proliferation. They further reported that Y26 phosphorylation could enhance PGAM1 activation by stabilizing the active conformation of PGAM1, which promoted cancer cell proliferation and tumor growth.22 Sanzey et al.23 found that silencing of PGAM1 increased cell death in U87 cells and increased survival in mice with glioblastoma xenografts. A recent study reported that knockdown of PGAM1 by siRNA notably inhibited glioma cell proliferation, migration, and invasion and promoted cancer cell apoptosis.13
Here, we showed that silencing PGAM1 by transfecting cells with siRNA markedly inhibited cell proliferation. Additionally, siRNA knockdown of PGAM1 notably enhanced cell apoptosis in PC-3 and 22Rv1 cells by downregulating Bcl-2 expression, upregulating Bax expression, and activating the caspased-3 signal. Moreover, knockdown of PGAM1 expression inhibited PCa cell migration and invasion. These results suggest that PGAM1 plays an important role in the progression of PCa by regulating MMP-2 and MMP-9.
Some cell lines we used for the study are androgen independent. Thus, our finding may provide new information for further researches of treating CRPC. Our findings strongly indicate that PGAM1 plays an important role in PCa development and progression. Further molecular and functional studies of PGAM1 in PCa, for example to determine the molecular mechanisms underlying the effects observed here, should be conducted.
CONCLUSION
Our data suggest that PGAM1 was upregulated in PCa cells and tissues. Additionally, PGAM1 knockdown efficiently inhibited PCa cell proliferation, migration, and invasion and enhanced cancer cell apotosis in vitro. Moreover, PGAM1 knockdown suppressed xenograft tumor growth in vivo. These results indicate that PGAM1 may play an important role in the progression and aggressiveness of PCa, and that it might be a valuable marker of poor prognosis and a potential therapeutic target for PCa.
AUTHOR CONTRIBUTIONS
YAW, BWZ, and SCZ conceived this study, conducted the searching, and drafted the manuscript. DJL participated in statistical analysis and help draft the manuscript. FPS and XLS contributed to the design of this study. BH and CW participated in experimental work. SCZ checked the design of this study, participated in coordination, and provided proposals for the manuscript. All authors read and approved the final manuscript.
COMPETING INTERESTS
All authors declared no competing interests.
ACKNOWLEDGMENTS
This study was supported by three Science and Technology planning Projects of Guangdong Province (No. 2013B051000050, No. 2014A020212538, and No. 2016A020215175), the Natural Science Foundation of Guangdong Province (No. 2016A030313583), the Medical Scientific Research Foundation of Guangdong Province (No. A2016555), the Outstanding Youths Development Scheme of Nanfang Hospital, Southern Medical University (No. 2015J005), and the Science and Technology planning Project of Guangzhou (No. 201704020070).
REFERENCES
- 1.Center MM, Jemal A, Lortet-Tieulent J, Ward E, Ferlay J, et al. International variation in prostate cancer incidence and mortality rates. Eur Urol. 2012;61:1079–92. doi: 10.1016/j.eururo.2012.02.054. [DOI] [PubMed] [Google Scholar]
- 2.Nakano K, Komatsu K, Kubo T, Natsui S, Nukui A, et al. External validation of risk classification in patients with docetaxel-treated castration-resistant prostate cancer. BMC Urol. 2014;14:31. doi: 10.1186/1471-2490-14-31. [DOI] [PMC free article] [PubMed] [Google Scholar]
- 3.Martin SK, Kyprianou N. Exploitation of the androgen receptor to overcome taxane resistance in advanced prostate cancer. Adv Cancer Res. 2015;127:123–58. doi: 10.1016/bs.acr.2015.03.001. [DOI] [PubMed] [Google Scholar]
- 4.Dimakakos A, Armakolas A, Koutsilieris M. Novel tools for prostate cancer prognosis, diagnosis, and follow-up. Biomed Res Int. 2014;2014:890697. doi: 10.1155/2014/890697. [DOI] [PMC free article] [PubMed] [Google Scholar]
- 5.Hoogland AM, Kweldam CF, van Leenders GJ. Prognostic histopathological and molecular markers on prostate cancer needle-biopsies: a review. Biomed Res Int. 2014;2014:341324. doi: 10.1155/2014/341324. [DOI] [PMC free article] [PubMed] [Google Scholar]
- 6.Chaneton B, Gottlieb E. PGAMgnam style: a glycolytic switch controls biosynthesis. Cancer Cell. 2012;22:565–6. doi: 10.1016/j.ccr.2012.10.014. [DOI] [PubMed] [Google Scholar]
- 7.Evans MJ, Saghatelian A, Sorensen EJ, Cravatt BF. Target discovery in small-molecule cell-based screens by in situ proteome reactivity profiling. Nat Biotechnol. 2005;23:1303–7. doi: 10.1038/nbt1149. [DOI] [PubMed] [Google Scholar]
- 8.Li C, Shu F, Lei B, Lv D, Zhang S, et al. Expression of PGAM1 in renal clear cell carcinoma and its clinical significance. Int J Clin Exp Pathol. 2015;8:9410–5. [PMC free article] [PubMed] [Google Scholar]
- 9.Buhrens RI, Amelung JT, Reymond MA, Beshay M. Protein expression in human non-small cell lung cancer: a systematic database. Pathobiology. 2009;76:277–85. doi: 10.1159/000245893. [DOI] [PubMed] [Google Scholar]
- 10.Cortesi L, Barchetti A, De Matteis E, Rossi E, Della Casa L, et al. Identification of protein clusters predictive of response to chemotherapy in breast cancer patients. J Proteome Res. 2009;8:4916–33. doi: 10.1021/pr900239h. [DOI] [PubMed] [Google Scholar]
- 11.Ren F, Wu H, Lei Y, Zhang H, Liu R, et al. Quantitative proteomics identification of phosphoglycerate mutase 1 as a novel therapeutic target in hepatocellular carcinoma. Mol Cancer. 2010;9:81. doi: 10.1186/1476-4598-9-81. [DOI] [PMC free article] [PubMed] [Google Scholar]
- 12.Hitosugi T, Zhou L, Elf S, Fan J, Kang HB, et al. Phosphoglycerate mutase 1 coordinates glycolysis and biosynthesis to promote tumor growth. Cancer Cell. 2012;22:585–600. doi: 10.1016/j.ccr.2012.09.020. [DOI] [PMC free article] [PubMed] [Google Scholar]
- 13.Xu Z, Gong J, Wang C, Wang Y, Song Y, et al. The diagnostic value and functional roles of phosphoglycerate mutase 1 in glioma. Oncol Rep. 2016;36:2236–44. doi: 10.3892/or.2016.5046. [DOI] [PubMed] [Google Scholar]
- 14.Lei Y, Huang K, Gao C, Lau QC, Pan H, et al. Proteomics identification of ITGB3 as a key regulator in reactive oxygen species-induced migration and invasion of colorectal cancer cells. Mol Cell Proteomics. 2011 doi: 10.1074/mcp.M110.005397. M110.005397. [DOI] [PMC free article] [PubMed] [Google Scholar]
- 15.Xiao Y, Yuan Y, Zhang Y, Li J, Liu Z, et al. CMTM5 is reduced in prostate cancer and inhibits cancer cell growth in vitro and in vivo. Clin Transl Oncol. 2015;17:431–7. doi: 10.1007/s12094-014-1253-z. [DOI] [PubMed] [Google Scholar]
- 16.Racker E. Bioenergetics and the problem of tumor growth. Am Sci. 1972;60:56–63. [PubMed] [Google Scholar]
- 17.Corcoran CA, Huang Y, Sheikh MS. The regulation of energy generating metabolic pathways by p53. Cancer Biol Ther. 2006;5:1610–3. doi: 10.4161/cbt.5.12.3617. [DOI] [PubMed] [Google Scholar]
- 18.Tennant DA, Duran RV, Gottlieb E. Targeting metabolic transformation for cancer therapy. Nat Rev Cancer. 2010;10:267–77. doi: 10.1038/nrc2817. [DOI] [PubMed] [Google Scholar]
- 19.Jiang X, Sun Q, Li H, Li K, Ren X. The role of phosphoglycerate mutase 1 in tumor aerobic glycolysis and its potential therapeutic implications. Int J Cancer. 2014;135:1991–6. doi: 10.1002/ijc.28637. [DOI] [PubMed] [Google Scholar]
- 20.Narayanan NK, Narayanan BA, Nixon DW. Resveratrol-induced cell growth inhibition and apoptosis is associated with modulation of phosphoglycerate mutase B in human prostate cancer cells: two-dimensional sodium dodecyl sulfate-polyacrylamide gel electrophoresis and mass spectrometry evaluation. Cancer Detect Prev. 2004;28:443–52. doi: 10.1016/j.cdp.2004.08.009. [DOI] [PubMed] [Google Scholar]
- 21.Zhang XB, Tang ZY, Zu XB, Qi L, Ruan JD. Modified serum-guided immunoblotting for differential proteomic study of prostate cancer. Zhonghua Nan Ke Xue. 2010;16:438–44. [PubMed] [Google Scholar]
- 22.Hitosugi T, Zhou L, Fan J, Elf S, Zhang L, et al. Tyr26 phosphorylation of PGAM1 provides a metabolic advantage to tumours by stabilizing the active conformation. Nat Commun. 2013;4:1790. doi: 10.1038/ncomms2759. [DOI] [PMC free article] [PubMed] [Google Scholar]
- 23.Sanzey M, Abdul Rahim SA, Oudin A, Dirkse A, Kaoma T, et al. Comprehensive analysis of glycolytic enzymes as therapeutic targets in the treatment of glioblastoma. PLoS One. 2015;10:e0123544. doi: 10.1371/journal.pone.0123544. [DOI] [PMC free article] [PubMed] [Google Scholar]


