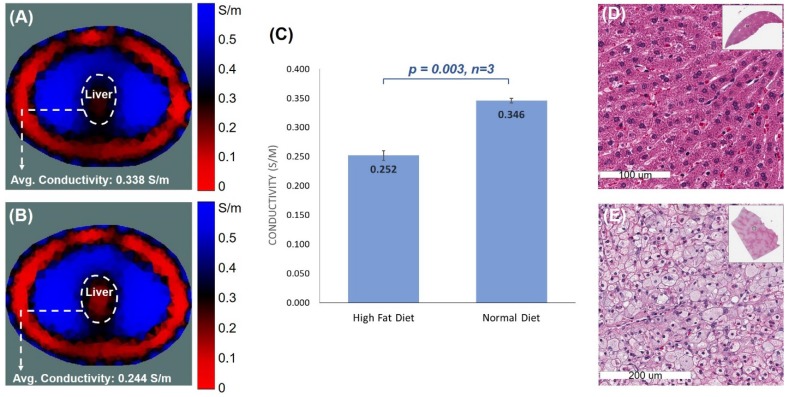
Figure 6.
EIT liver imaging in NZW rabbits. The upper abdomen of the age-matched male NZW rabbits (n=3 for control and n=3 for high-fat diet) was wrapped around with a belt embedded with 32 equally positioned electrodes. (A & B) Comparison between normal and high-fat-fed NZW rabbits showed the distinct EIT output, with higher conductivity in the normal diet-fed rabbits and lower conductivity in the high-fat-fed rabbits. (C) Statistical analysis indicated significant differences in the average conductivities between the normal and high-fat diet rabbits (p < 0.03 vs. normal diet, n=3). (D & E) Gross histology was assessed using H&E staining of the cross-section of liver at which the electrode belt was positioned to acquire the EIT measurement. The normal diet-fed liver revealed healthy hepatocytes, whereas the high-fat diet-fed liver developed prominent intracellular fat droplets.

