Figure 5.
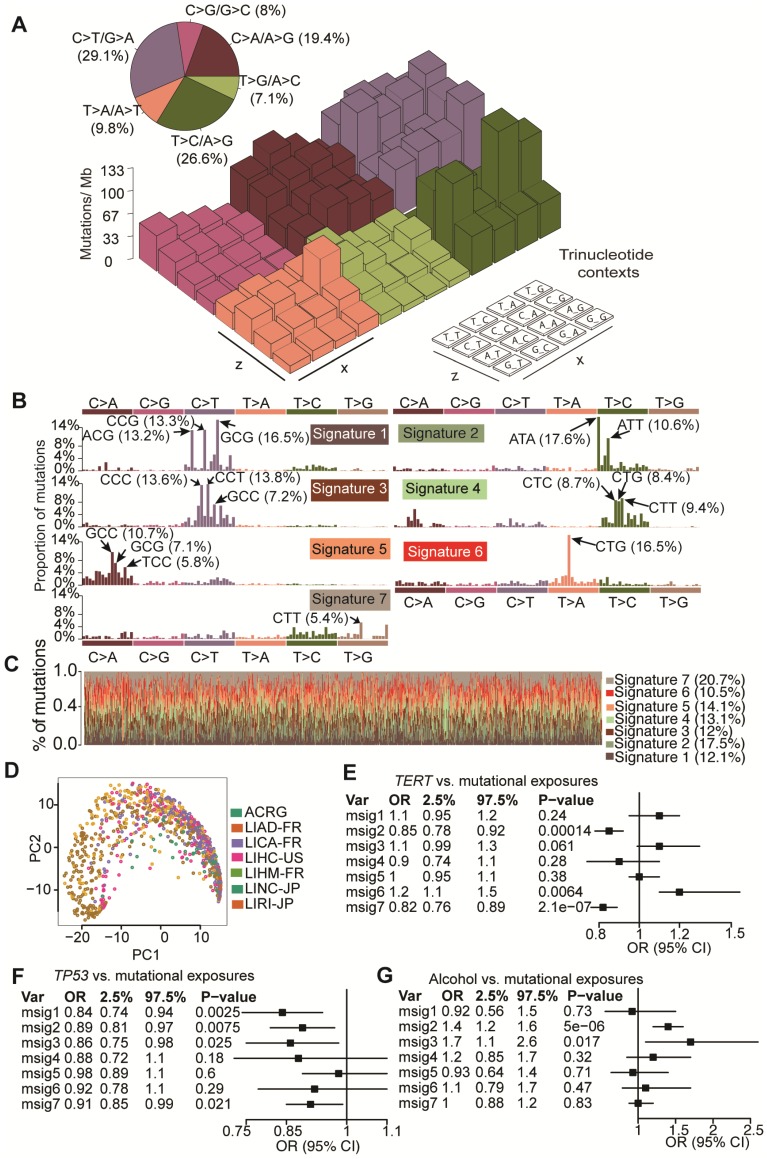
Mutation signatures operative in HCC and their correlation with gene mutations and alcohol consumption. (A) Lego plot of mutation patterns in 1,061 HCC samples. Single-nucleotide substitutions are divided into six categories with 16 surrounding flanking bases. Inset pie chart shows the proportion of 6 categories of mutation patterns. (B) Seven mutational signatures were extracted from HCC. (C) Proportion of 7 mutation signatures in individual HCC samples. (D) Kernel principal component analysis was conducted for mutational signatures with HCC samples from different studies labeled with different colors. (E-G) Significant association of mutation signatures with (E) TERT mutation status, (F) TP53 mutation status and (G) alcohol consumption were identified.

