

Abstract
Introduction
Second-harmonic generation microendoscopy is a minimally invasive technique to image sarcomeres and measure their lengths in humans, but motion artifact and low signal have limited the use of this novel technique.
Methods
We discovered that an excitation wavelength of 960 nm maximized image signal; this enabled an image acquisition rate of 3 frames/s, which decreased motion artifact. We then used microendoscopy to measure sarcomere lengths in the human extensor carpi radialis brevis with the wrist at 45° extension and 45° flexion in 7 subjects. We also measured the variability in sarcomere lengths within single fibers.
Results
Average sarcomere lengths in 45° extension were 2.93±0.29 μm (±SD) and increased to 3.58±0.19 μm in 45° flexion. Within single fibers the standard deviation of sarcomere lengths in series was 0.20 μm.
Conclusions
Microendoscopy can be used to measure sarcomere lengths at different body postures. Lengths of sarcomeres in series within a fiber vary substantially.
Keywords: human wrist biomechanics, in vivo two photon microscopy, muscle architecture, muscle fiber length, sarcomere operating length, second-harmonic generation microendoscopy, sarcomere inhomogeneity, sarcomere length variability, human microendoscopy, clinical microendoscopy, multiphoton imaging, multiphoton microendoscopy, dye-free in vivo imaging, skeletal muscle
Classical experiments in frog muscle showed that isometric tetanic force in muscle fibers depends on sarcomere length.1 Muscles produce maximum active isometric force with the sarcomeres at their optimal length and near zero force at short and long extremes. Muscle fiber and sarcomere lengths change with joint rotation, and thus the force-generating capacity of a muscle can vary dramatically at different body positions. Measurements of sarcomere lengths at different body positions are needed to help understand the microscopic determinants of muscle isometric force-generating capacity.
Measurements of average sarcomere lengths in humans using laser diffraction have yielded valuable insights into muscle force-generating capacities.2–5 This method requires surgery to expose the muscle of interest, which has limited the types of studies that can be performed with laser diffraction. Second-harmonic generation (SHG) microendoscopy is a new technique for measuring individual sarcomere lengths at different body postures using needle-sized microendoscopes inserted into human muscle.6 Technical challenges with SHG microendoscopy, such as motion artifact and low signal have limited systematic analysis of sarcomere lengths at specific joint angles in humans using this technique.
The ability to visualize individual sarcomeres by SHG microendoscopy enables measurement of sarcomere length variability.6 Studies of single fibers in vitro suggest that increased variability in length of sarcomeres in series broadens the force-length curve,7,8 lowers isometric tetanic force,9 slows the rate of force rise, and speeds the rate of force relaxation.10,11 Studies in isolated segments of single myofibrils aim to elucidate the dynamics of in-series sarcomeres12–14 or half-sarcomeres.15,16 However, it is unknown how much variability in sarcomere length is present in vivo when the network of lateral connections between fibrils and fibers is intact and muscle is in its natural anatomical position.
The goals of this study were to overcome the technical challenges associated with SHG microendoscopy and to use this technique to: (1) measure average sarcomere length in the human extensor carpi radialis brevis (ECRB) muscle with the wrist in extension and flexion and (2) measure sarcomere length variability in humans within local regions of ECRB fibers with the muscle at rest. We selected the ECRB because it is a clinically important muscle, and intraoperative laser diffraction measurements2,4,17,18 provide valuable comparisons for our measurements made using micro-endoscopy.
MATERIALS AND METHODS
Seven unimpaired adults (3 women, 4 men) with no history of neuromuscular injury or disease participated in the study. Subjects were aged 33±13 years, and had an average mass of 71.5±6.7 kg and height of 176±6 cm. The Stanford Institutional Review Board approved the experimental protocol, and all subjects gave informed consent.
Sarcomere Imaging System
We imaged sarcomeres using a system comprised of a custom two-photon tabletop microscope adapted for human imaging with gradient refractive index (GRIN) microendoscopes6 (Fig. 1). A Titanium:Sapphire laser (Chameleon, Coherent, Santa Clara, California, USA) provided ultrashort pulses (<140 fs, factory specification) of near-infrared excitation light (960 nm). An intrinsic signal arises from laser interaction with the myosin-containing A-bands within the sarcomere by means of second-harmonic generation.19 We measured the signal intensities in images of fresh muscle samples over a range of near-infrared wavelengths (880–1,060 nm; Supplementary Fig. S1, which is available online). An excitation wavelength of 960 nm produced the highest signal intensity and was nearly double the value measured at 920 nm, the wavelength previously used for SHG imaging in human muscle.6 The improvement in signal enabled the image acquisition rate to be increased to 3.05 frames-per-second, which decreased motion artifact. Each 512 × 512-pixel image frame spanned a field of view of 84 μm × 84 μm, thus the pixel size was 0.164 μm. Average excitation power at the muscle was 70 mW. This power level did not cause discernible tissue damage.
FIGURE 1.
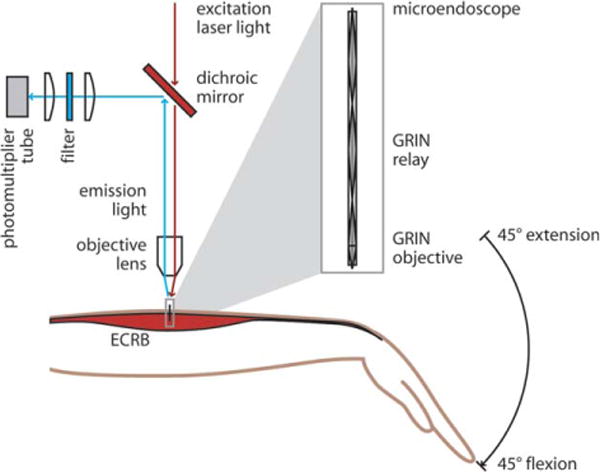
A custom two-photon microendoscopy system was used to measure sarcomere lengths in human subjects in the ECRB muscle, a wrist extensor, with the wrist at 45° extension and 45° flexion. Excitation laser light (960 nm) was focused by an objective lens (10×, 0.25 NA) into a microendoscope (inset). The microendoscope consisted of a GRIN relay (1.25 pitch) and GRIN objective (0.25 pitch) and delivered focused excitation light into the muscle tissue. The emission light was separated from the excitation by a low-pass dichroic mirror, filtered (center wavelength 480 nm, bandwidth 40 nm), and collected in a photomultiplier tube.
The microendoscope consists of a 500-μm-diameter GRIN lens doublet (2 GRIN lenses in series: a relay and an objective) secured inside a stainless steel tube (Fig. 1, inset; Grintech, Jena, Germany). The image depth in the tissue is controlled by altering the focal plane of the laser beam above the microendoscope, which alters the corresponding plane in the tissue at which the beam is refocused by the microendoscope.
The calculated in-plane and depth resolutions of the endoscope were 1.5 μm and 16 μm respectively. The in-plane resolution is the smallest distance at which distinct myosin signal sources can be distinguished in the image. The 1.5 μm resolution is sufficient to measure the distance between myosin-containing A-bands (which are generally separated by a center-to-center distance of 2–4 μm), but it cannot distinguish between neighboring myofibrils. The pixel size is determined by the scan settings (i.e., the 512 × 512-pixel image frame spanning a field of view of 84 μm × 84 μm). We calibrated the pixel size by imaging a pattern with 5 μm line pairs (Ronchi ruling slide, Edmund Optics, Barrington, New Jersey, USA) with the same setup and wavelength that was used in the human experiments. The resolution of the images corresponds to approximately 9 pixels. (See Appendix for additional imaging and microendoscope parameters.)
Subject Positioning and Endoscope Insertion
We minimized subject motion with a bracing system and visual feedback. Subjects sat with the left arm in a custom brace attached to an adjustable chair (Supplementary Fig. S2; Biodex Medical Systems, Shirley, New York, USA). The bracing system controlled wrist flexion angle by aligning the back of the hand (second and third metacarpals) and forearm with a plate that was bent at either 45° wrist extension or 45° wrist flexion. To control for sarcomere length changes with radial deviation angle,20 we aligned the radius and the lateral edge of the head of the second metacarpal to a plate that was normal to the plate that set wrist extension angle. To control for sarcomere length changes with elbow flexion,18 the elbow was held at approximately 135° using the convention that full extension is 180° by strapping the forearm and upper arm into curved plates. The forearm was pronated to avoid slack muscle.20
The bracing system alone was insufficient to eliminate subtle subject motion relative to the rigid endoscope clamp. We provided visual feedback to help the subject minimize motion with a laser pointer attached to the left shoulder and a small target approximately 1 meter away. We instructed the subject to keep the laser pointer spot within the target during image acquisition. This visual feedback enabled the collection of hundreds of consecutive sarcomere images free of detectable motion artifacts.
We inserted the microendoscope into the proximal third of the ECRB muscle belly. The ECRB was located by palpation using a protocol we developed with ultrasound imaging (Supplementary Fig. S3). After cleansing the skin, we inserted a 20-gauge guide tube and sharpened stylet (Supplementary Fig. S4) into the muscle using a spring-loaded injector. The spring-loaded injector ensured penetration of the guide tube through the fascia, achieved a vertical insertion, and minimized subject discomfort. We removed the sharpened stylet and clamped the protruding end of the guide tube to hold it in vertical alignment with the optical axis of the microscope. We placed the microendoscope into the guide tube, which remained in the muscle. The tip of the endoscope rested in the tissue below the guide tube. We sterilized the microendoscope, guide tube, stylet, and injector by autoclave before use.
Image Acquisition and Analysis
We imaged sarcomeres in the ECRB with the wrist at 45° extension and 45° flexion. First, we inserted the endoscope with the subject’s wrist braced in 45° extension and acquired images with the muscle at rest. Next, we removed the endoscope and guide tube to allow unimpeded lengthening of the muscle while flexing the wrist. We then braced the wrist at 45° flexion and reinserted the endoscope and guide tube into the muscle belly 5–10 mm distal to the first insertion point. From ultrasound measurements, we estimated that the muscle belly shifted approximately 5–10 mm distally in the change from extension to flexion. Although it is not possible to image the same fibers between joint angles, the purpose of the shift in insertion point was to image the same portion of the muscle. Finally, we acquired images with the wrist in flexion and the muscle at rest, and we removed the endoscope and guide tube.
We measured average sarcomere length in the first 100 frames (approximately 30 s) of stable images at each joint angle in each subject. Images in which sarcomeres were visible with negligible motion were considered stable. Images were collected at the same focal depth for all 100 frames. We calculated mean sarcomere length within a frame by locating the fundamental spatial frequency of the sarcomere pattern in the two-dimensional discrete Fourier transform (DFT) (MATLAB, The MathWorks, Inc., Natick, Massachusetts, USA). Only frames in which the peak of the sarcomere signal was greater than 8 times the average intensity of the high frequency noise were included. To locate the fundamental spatial frequency, we first plotted the pixel intensities from the two-dimensional DFT of each image frame against the corresponding spatial periods. Pixels with intensities below a noise threshold were omitted. The noise threshold was calculated for each DFT as the mean plus 2 standard deviations of the pixel intensities for frequencies with periods below 2 μm. Using the pixels encompassing the range of periods of 2–5 μm, we binned and summed the pixel intensity values, defining the center of each bin as the spatial period corresponding to each pixel in the DFT. We fit a Gaussian curve to the resulting plot of summed pixel intensities versus spatial period. The mean sarcomere length was defined as the center of the Gaussian curve. This determination has an accuracy of approximately 0.03 μm based on the performance of the algorithm in simulated images of sarcomeres with varying lengths and noise levels spanning the ranges measured in the human images. Values reported are means and standard deviations over each series of 100 frames.
We compared sarcomere lengths between wrist positions using Fisher’s sign test. We used an analysis of covariance to compare our measurements to laser diffraction measurements of ECRB sarcomere length across a range of wrist flexion angles (original data from Lieber et al.2 as reported by Ponten et al.4).
We measured the variability in the lengths of sarcomeres in the same images used to measure average sarcomere length. We selected 1 50 × 200-pixel (equivalent to 8 × 33 μm) region of interest in each frame, with the longer dimension aligned with the fiber direction (Fig. 2a,b). Regions with strong signals and without structural anomalies, such as verniers21 or inclusions,22 were chosen. We then created a 1 × 200-pixel row vector by averaging the 50 pixel intensity values of each column from the region of interest. The locations of the peaks in the averaged vector corresponded to the locations of the bright bands in the image. We bandpass filtered (keeping frequencies corresponding to periods of 2–5 μm), then normalized the averaged vector (Fig. 2c). The length of a myosin thick filament is near the resolution of the endoscope, thus the myosin-containing A-band is expected to produce a nearly Gaussian signal profile. We fit a Gaussian curve to each peak in the filtered vector and calculated the individual sarcomere lengths as the distances between the peaks. This yielded a mean , standard deviation (sroi), and coefficient of variation (CVroi) of sarcomere lengths within each region of interest. We pooled the standard deviations (sroi) and coefficients of variation (CVroi) over all regions of interest from all subjects and calculated their means and standard deviations .
FIGURE 2.
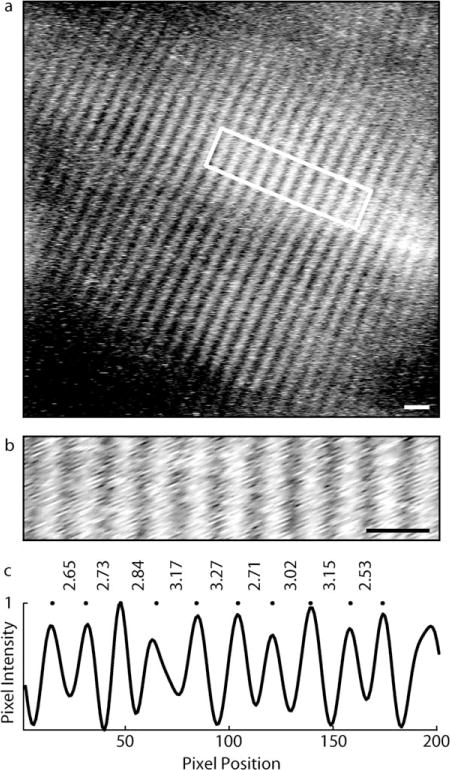
Lengths of sarcomeres in series were measured in a region of interest from each frame. (a) Image of human sarcomeres. Scale bar=5 μm. (b) Region of interest from image shown in (a). Scale bar=5 μm. (c) An averaged vector was calculated by averaging the pixel intensities from the region of interest along the vertical direction. The averaged vector was bandpass filtered and normalized. The locations of signal peaks (dots) were found by fitting Gaussian curves to each peak in the filtered vector, and individual sarcomere lengths were calculated as the distances between peaks (μm).
We tested the sensitivity of our variability measurements to noise using simulated images. The simulated images were Gaussian stripes with an average spacing of 3.0 μm and 1 of 3 levels of variability in spacing (standard deviations of 0 μm, 0.1 μm, or 0.2 μm). For each level of variability in spacing, 100 different simulated images were generated. Random noise was applied to each image; the noise level was set to match the noise level in the human images. We used the same algorithm of fitting Gaussian peaks to the bright bands in the signal to measure the standard deviation for each image frame.
RESULTS
Microendoscopy produced images in which the sarcomeres could be visualized, and sarcomere lengths could be measured in each subject (Fig. 3 and Supplementary Fig. S5). Sarcomeres in the ECRB were longer with the wrist in flexion than with the wrist in extension (P=0.01; n=7 subjects). The average sarcomere length with the wrist in 45° extension was 2.93±0.29 μm; with the wrist in 45° flexion the average length was 3.58±0.19 μm (Fig. 4). The average difference in sarcomere length between 45° extension and 45° flexion was 0.65±0.14 μm. Sarcomere lengths with the wrist in extension encompassed a broad range of the force-length curve that included the ascending, plateau and descending limbs. Sarcomere lengths with the wrist in flexion were all on the descending limb of the force-length curve.
FIGURE 3.
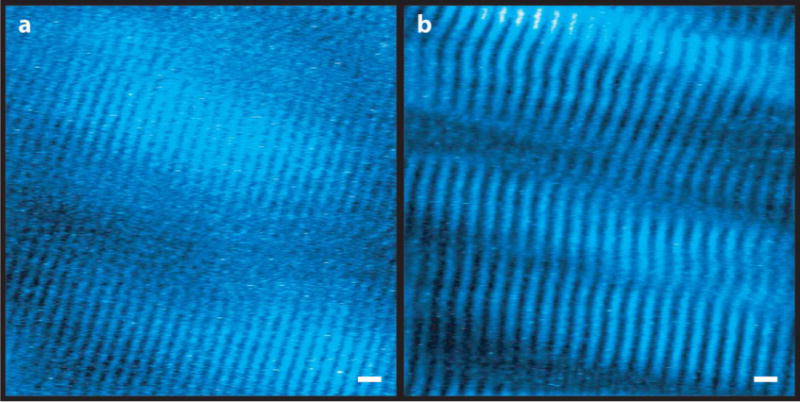
Microendoscopy images of sarcomeres in the wrist extensor muscle ECRB from a subject with the wrist (a) extended (average sarcomere length 2.92 μm) and (b) flexed (average sarcomere length 3.65 μm). Bright regions in the image (pseudocolored blue) are myosin-containing A-bands. Images are band-pass filtered and window-and-level adjusted, which can affect the appearance of the width of the bright bands. Scale bar=5 μm. Additional image pairs from other subjects in supplemental materials (Supplementary Fig. S5).
FIGURE 4.
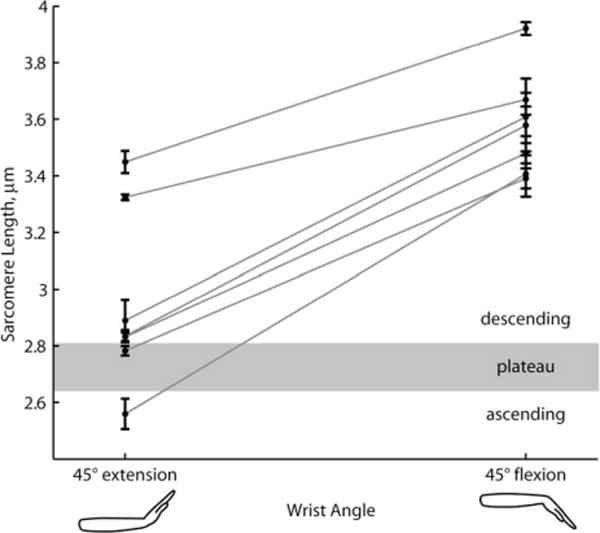
Sarcomeres in the extensor carpi radialis brevis (ECRB) are longer in wrist flexion than wrist extension. Sarcomere lengths measured at 2 wrist angles (45° extension and 45° flexion) in 7 subjects. Each data point is the mean calculated from 100 sequential image frames, representing 30 s of imaging. Error bars are standard deviations over the 100 frames. Lines connect measurements from the same subject. Sarcomere lengths that define the ascending, plateau, and descending regions of the sarcomere force-length relationship taken from Gollapudi and Lin.8
The average change in sarcomere length with 90° of wrist rotation (45° extension to 45° flexion) measured with microendoscopy (0.65 μm) and laser diffraction (0.68 μm)4 differ by only 0.03 μm. These slopes were not significantly different (P=0.87; laser diffraction,4 n=35 measurements; present study, n=14 measurements). The average sarcomere lengths measured with microendoscopy were longer than the best fit line through laser diffraction data4 by 10% in extension and 7% in flexion.
Lengths of sarcomeres in series in a single muscle fiber varied substantially (Fig. 5). For example, regions of interest that had an average sarcomere length of 3.0 μm included sarcomeres with lengths that varied from 2.4 μm to 3.5 μm. Averaged across all frames from all subjects, standard deviations of sarcomere lengths within the regions of interest were 0.20±0.07 μm , and coefficients of variation were 6.5±2.4% . In our simulated images with actual standard deviations of 0 μm, 0.10 μm, and 0.20 μm, the mean measured standard deviations confounded by noise were 0.13 μm, 0.18 μm, and 0.26 μm, respectively. Based on comparison of our measurement of mean standard deviation to the effects of noise, the expected value for the actual mean standard deviation was likely between 0.1 and 0.2 μm.
FIGURE 5.

Lengths of sarcomeres in series from a single region of interest vary substantially. Lengths of individual sarcomeres in a region of interest (vertical axis) plotted against the average sarcomere length of that region of interest (horizontal axis). Sarcomere lengths that define the ascending, plateau, and descending regions of the sarcomere force-length relationship taken from Gollapudi and Lin.8
DISCUSSION
We used microendoscopy to measure individual sarcomere lengths at specific joint angles in humans. The sarcomere length change between joint angles measured with microendoscopy agrees with intraoperative laser diffraction measurements4 despite differences in the physics of the signal generation, the methods used to access the muscle, and the number of sarcomeres included in the measurements. Our measurements are slightly longer (7–10%) than reported laser diffraction measurements,4 which could arise from differences between the studies in the definition of wrist flexion angle,2 or differences in radial deviation angle20 or elbow flexion angle.18 Nonetheless, the relatively small differences provide confidence that the measurements made with SHG microendoscopy provide reliable estimates of sarcomere length at different joint angles.
The lengths of individual sarcomeres in series varied substantially in our human subjects. The range spanning 2 standard deviations above and below the mean can include sarcomeres that differ in length by 0.8 μm. In fibers from the first dorsal interosseus muscle from human cadavers, lengths of sarcomeres in series showed a similar pattern of high local variability.23 In fresh biopsies from vastus lateralis, the coefficient of variation of sarcomere lengths was 9.7%,24 which is higher than reported here; however, the biopsy techniques used do not preserve in vivo lengths, and effects of biopsy and fixation on sarcomere length distributions are unknown. Series sarcomeres observed in isolated myofibrils from animals differed by up to 0.5 μm,12,14 also indicating substantial variability.
Experiments on muscle fibers suggest that sarcomere length variability during muscle activation results in a broader plateau region of the force-length curve than predicted by a standard sliding filament model.7,8 Our observations of substantial sarcomere length variability together with the average sarcomere lengths on the plateau and descending limb of the force-length relationship suggest that muscles may have a functionally broader plateau region caused by in vivo sarcomere length variability. Microendoscopy may be suitable to measure local sarcomere coordination and variability in the context of whole muscle function.
Our measurements of average sarcomere length and variability in sarcomere length were in muscle at rest. Activation at maximum physiological tension is estimated to cause 0.2 μm of sarcomere shortening in the ECRB,25 which would shift the sarcomere operating lengths onto the plateau or ascending limb in some subjects. Experiments on myofibrils suggest that series sarcomere lengths increase in variability with activation16 and maintain their length distributions during activated stretch.14,15 The variability in series sarcomere length that we observed in muscle at rest may similarly persist with activation and stretch.
Misalignment of the image plane and the fiber axis could cause error in the sarcomere length measurements. An image generated by second-harmonic generation represents an optical section through the sample. A simple geometric model of the measurement error due to misalignment of the image plane and the fiber axis is:
where SL is the sarcomere length and θ is the angle between the fiber axis and the image plane. Fascicles in the ECRB are nearly parallel to the skin surface (θ=5.8±3.3°, n=3 subjects, Supplementary Fig. S3). This equation predicts a 0.5% overestimate of sarcomere length for the measured fascicle angle. Thus, errors in sarcomere length measurement due to image plane misalignment are likely to be minimal in this study.
Motion is another potential source of error. Images were acquired at approximately 3 frames/s, and when a subject moved during image acquisition, small-scale distortions were visible in the images. Only images free of motion artifact were included in our analysis, thus we do not expect that subject motion affected the results.
We measured sarcomere lengths at specific body postures with minimally invasive microendoscopy, demonstrating that this technique can be used for examination of sarcomere lengths in healthy muscle. Procedural improvements that enabled these measurements included the optimized laser excitation wavelength, the increased image acquisition rate, the use of a spring-loaded injector, and improved bracing of the subject and the microendoscope. This technique offers the potential to measure in vivo sarcomere length–joint angle relationships which can be compared with predictions from biomechanical models,3,26–28 providing valuable tests of a model’s accuracy. Because sarcomeres can be examined without surgery and in repeated sessions, minimally invasive microendoscopy provides a method to examine how sarcomere lengths vary over time with strength training, stretching, or surgery. The method also points the way toward imaging diagnostics to study how neuromuscular diseases affect sarcomere lengths. Tissue biopsies and laser diffraction studies have suggested that sarcomere structure and lengths are altered in neuromuscular disorders.4,5,24 Direct visualization of sarcomeres by microendoscopy may prove valuable for diagnosing these conditions, monitoring their progression, and assessing treatments.
Supplementary Material
Acknowledgments
The authors acknowledge the assistance of: Kevin McGill, Michael Llewellyn, Bio-X Interdisciplinary Initiatives Program, Berg-Affymetrix Bio-X Stanford Interdisciplinary Graduate Fellowship in Human Health, National Defense Science and Engineering Graduate Fellowship. Portions of this work were presented at the International Society of Biomechanics Congress, Brussels, Belgium, 2011.
Abbreviations
- DFT
discrete Fourier transform
- ECRB
extensor carpi radialis brevis
- GRIN
gradient refractive index
- NA
numerical aperture
- SHG
second-harmonic generation
APPENDIX
IMAGING AND MICROENDOSCOPE PARAMETERS
The excitation laser light had a wavelength of 960 nm with pulse width <140 fs (factory specification) and a pulse repetition rate of 80 MHz to achieve the high instantaneous power necessary to generate the second-harmonic signal. The emission filter had a center wavelength of 480 nm, and a full-width half-maximum of 40 nm (HQ480/40m-2p, Chroma, Bellows Falls, Vermont, USA). The scanning speed was set with a dwell time of 1 μs/pixel. The objective lens had a 10× magnification and numerical aperture (NA) of 0.25 (Olympus America Inc., Center Valley, Pennsylvania, USA).
The relay component of the gradient refractive index (GRIN) microendoscope had a pitch of 1.25 (the light path completed 1.25 sinusoidal periods along the length of the relay). The relay NA was 0.2. The objective component of the microendoscope had a pitch of 0.25 and NA of 0.4. The design working distance of the microendoscope was 100 μm, meaning that a focal spot at the top surface of the microendoscope would create a new focal spot 100 μm into the tissue below the bottom face of the microendoscope.29,30
Footnotes
Additional Supporting Information may be found in the online version of this article.
References
- 1.Gordon AM, Huxley AF, Julian FJ. The variation in isometric tension with sarcomere length in vertebrate muscle fibres. J Physiol. 1966;184:170–192. doi: 10.1113/jphysiol.1966.sp007909. [DOI] [PMC free article] [PubMed] [Google Scholar]
- 2.Lieber RL, Loren GJ, Friden J. In vivo measurement of human wrist extensor muscle sarcomere length changes. J Neurophysiol. 1994;71:874–881. doi: 10.1152/jn.1994.71.3.874. [DOI] [PubMed] [Google Scholar]
- 3.Murray WM, Hentz VR, Friden J, Lieber RL. Variability in surgical technique for brachioradialis tendon transfer. Evidence and implications. J Bone Joint Surg Am. 2006;88:2009–2016. doi: 10.2106/JBJS.E.00973. [DOI] [PubMed] [Google Scholar]
- 4.Ponten E, Gantelius S, Lieber RL. Intraoperative muscle measurements reveal a relationship between contracture formation and muscle remodeling. Muscle Nerve. 2007;36:47–54. doi: 10.1002/mus.20780. [DOI] [PubMed] [Google Scholar]
- 5.Smith LR, Lee KS, Ward SR, Chambers HG, Lieber RL. Hamstring contractures in children with spastic cerebral palsy result from a stiffer extracellular matrix and increased in vivo sarcomere length. J Physiol. 2011;589:2625–2639. doi: 10.1113/jphysiol.2010.203364. [DOI] [PMC free article] [PubMed] [Google Scholar]
- 6.Llewellyn ME, Barretto RP, Delp SL, Schnitzer MJ. Minimally invasive high-speed imaging of sarcomere contractile dynamics in mice and humans. Nature. 2008;454:784–788. doi: 10.1038/nature07104. [DOI] [PMC free article] [PubMed] [Google Scholar]
- 7.Julian FJ, Moss RL. Sarcomere length-tension relations of frog skinned muscle fibres at lengths above the optimum. J Physiol. 1980;304:529–539. doi: 10.1113/jphysiol.1980.sp013341. [DOI] [PMC free article] [PubMed] [Google Scholar]
- 8.Gollapudi SK, Lin DC. Experimental determination of sarcomere force-length relationship in type-I human skeletal muscle fibers. J Biomech. 2009;42:2011–2016. doi: 10.1016/j.jbiomech.2009.06.013. [DOI] [PubMed] [Google Scholar]
- 9.Edman KA, Caputo C, Lou F. Depression of tetanic force induced by loaded shortening of frog muscle fibres. J Physiol. 1993;466:535–552. [PMC free article] [PubMed] [Google Scholar]
- 10.Julian FJ, Morgan DL. Intersarcomere dynamics during fixed-end tetanic contractions of frog muscle fibres. J Physiol. 1979;293:365–378. doi: 10.1113/jphysiol.1979.sp012894. [DOI] [PMC free article] [PubMed] [Google Scholar]
- 11.Huxley AF, Simmons RM. A quick phase in the series-elastic component of striated muscle, demonstrated in isolated fibres from the frog. J Physiol. 1970;208:52P–53P. [PubMed] [Google Scholar]
- 12.Shimamoto Y, Suzuki M, Mikhailenko SV, Yasuda K, Ishiwata S. Intersarcomere coordination in muscle revealed through individual sarcomere response to quick stretch. Proc Natl Acad Sci USA. 2009;106:11954–11959. doi: 10.1073/pnas.0813288106. [DOI] [PMC free article] [PubMed] [Google Scholar]
- 13.Okamura N, Ishiwata S. Spontaneous oscillatory contraction of sarcomeres in skeletal myofibrils. J Muscle Res Cell Motil. 1988;9:111–119. doi: 10.1007/BF01773733. [DOI] [PubMed] [Google Scholar]
- 14.Rassier DE, Herzog W, Pollack GH. Dynamics of individual sarcomeres during and after stretch in activated single myofibrils. Proc Biol Sci. 2003;270:1735–1740. doi: 10.1098/rspb.2003.2418. [DOI] [PMC free article] [PubMed] [Google Scholar]
- 15.Telley IA, Stehle R, Ranatunga KW, Pfitzer G, Stussi E, Denoth J. Dynamic behaviour of half-sarcomeres during and after stretch in activated rabbit psoas myofibrils: Sarcomere asymmetry but no ‘sarcomere popping’. J Physiol. 2006;573:173–185. doi: 10.1113/jphysiol.2006.105809. [DOI] [PMC free article] [PubMed] [Google Scholar]
- 16.Telley IA, Denoth J, Stussi E, Pfitzer G, Stehle R. Half-sarcomere dynamics in myofibrils during activation and relaxation studied by tracking fluorescent markers. Biophys J. 2006;90:514–530. doi: 10.1529/biophysj.105.070334. [DOI] [PMC free article] [PubMed] [Google Scholar]
- 17.Friden J, Lieber RL. Physiologic consequences of surgical lengthening of extensor carpi radialis brevis muscle-tendon junction for tennis elbow. J Hand Surg [Am] 1994;19:269–274. doi: 10.1016/0363-5023(94)90018-3. [DOI] [PubMed] [Google Scholar]
- 18.Lieber RL, Ljung BO, Friden J. Sarcomere length in wrist extensor muscles. Changes may provide insights into the etiology of chronic lateral epicondylitis. Acta Orthop Scand. 1997;68:249–254. doi: 10.3109/17453679708996695. [DOI] [PubMed] [Google Scholar]
- 19.Plotnikov SV, Millard AC, Campagnola PJ, Mohler WA. Characterization of the myosin-based source for second-harmonic generation from muscle sarcomeres. Biophys J. 2006;90:693–703. doi: 10.1529/biophysj.105.071555. [DOI] [PMC free article] [PubMed] [Google Scholar]
- 20.Ljung BO, Friden J, Lieber RL. Sarcomere length varies with wrist ulnar deviation but not forearm pronation in the extensor carpi radialis brevis muscle. J Biomech. 1999;32:199–202. doi: 10.1016/s0021-9290(98)00152-3. [DOI] [PubMed] [Google Scholar]
- 21.Friedrich O, Both M, Weber C, Schurmann S, Teichmann MD, von Wegner F, et al. Microarchitecture is severely compromised but motor protein function is preserved in dystrophic mdx skeletal muscle. Biophys J. 2010;98:606–616. doi: 10.1016/j.bpj.2009.11.005. [DOI] [PMC free article] [PubMed] [Google Scholar]
- 22.Ralston E, Swaim B, Czapiga M, Hwu WL, Chien YH, Pittis MG, et al. Detection and imaging of non-contractile inclusions and sarcomeric anomalies in skeletal muscle by second-harmonic generation combined with two-photon excited fluorescence. J Struct Biol. 2008;162:500–508. doi: 10.1016/j.jsb.2008.03.010. [DOI] [PMC free article] [PubMed] [Google Scholar]
- 23.Infantolino BW, Ellis MJ, Challis JH. Individual sarcomere lengths in whole muscle fibers and optimal fiber length computation. Anat Rec (Hoboken) 2010;293:1913–1919. doi: 10.1002/ar.21239. [DOI] [PubMed] [Google Scholar]
- 24.Plotnikov SV, Kenny AM, Walsh SJ, Zubrowski B, Joseph C, Scranton VL, et al. Measurement of muscle disease by quantitative second-harmonic generation imaging. J Biomed Opt. 2008;13:044018. doi: 10.1117/1.2967536. [DOI] [PubMed] [Google Scholar]
- 25.Loren GJ, Lieber RL. Tendon biomechanical properties enhance human wrist muscle specialization. J Biomech. 1995;28:791–799. doi: 10.1016/0021-9290(94)00137-s. [DOI] [PubMed] [Google Scholar]
- 26.Holzbaur KR, Murray WM, Delp SL. A model of the upper extremity for simulating musculoskeletal surgery and analyzing neuromuscular control. Ann Biomed Eng. 2005;33:829–840. doi: 10.1007/s10439-005-3320-7. [DOI] [PubMed] [Google Scholar]
- 27.Arnold EM, Delp SL. Fibre operating lengths of human lower limb muscles during walking. Philos Trans R Soc Lond B Biol Sci. 2011;366:1530–1539. doi: 10.1098/rstb.2010.0345. [DOI] [PMC free article] [PubMed] [Google Scholar]
- 28.Delp SL, Arnold AS, Speers RA, Moore CA. Hamstrings and psoas lengths during normal and crouch gait: implications for muscle-tendon surgery. J Orthop Res. 1996;14:144–151. doi: 10.1002/jor.1100140123. [DOI] [PubMed] [Google Scholar]
- 29.Jung JC, Mehta AD, Aksay E, Stepnoski R, Schnitzer MJ. In vivo mammalian brain imaging using one- and two-photon fluorescence microendoscopy. J Neurophysiol. 2004;92:3121–3133. doi: 10.1152/jn.00234.2004. [DOI] [PMC free article] [PubMed] [Google Scholar]
- 30.Jung JC, Schnitzer MJ. Multiphoton endoscopy. Opt Lett. 2003;28:902–904. doi: 10.1364/ol.28.000902. [DOI] [PubMed] [Google Scholar]
Associated Data
This section collects any data citations, data availability statements, or supplementary materials included in this article.