

Abstract
Background:
Citri Reticulatae Pericarpium is the dried mature pericarp of Citrus reticulata Blanco which can be divided into “Chenpi” and “Guangchenpi.” “Guangchenpi” is the genuine Chinese medicinal material in Xinhui, Guangdong province; based on the greatest quality and least amount, it is most expensive among others. Hesperidin is used as the marker to identify Citri Reticulatae Pericarpium described in the Chinese Pharmacopoeia 2010. However, both “Chenpi” and “Guangchenpi” contain hesperidin so that it is impossible to differentiate them by measuring hesperidin.
Objective:
Our study aims to develop an efficient and accurate method to separate and identify “Guangchenpi” from other Citri Reticulatae Pericarpium.
Materials and Methods:
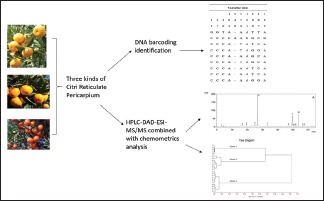
The genomic deoxyribonucleic acid (DNA) of all the materials was extracted and then the internal transcribed spacer 2 was amplified, sequenced, aligned, and analyzed. The secondary structures were created in terms of the database and website established by Jörg Schultz et al. High-performance liquid chromatography-diode array detection-electrospray Ionization/mass spectrometry (HPLC-DAD-ESI-MS)/MS coupled with chemometric analysis was applied to compare the differences in chemical profiles of the three kinds of Citri Reticulatae Pericarpium.
Results:
A total of 22 samples were classified into three groups. The results of DNA barcoding were in accordance with principal component analysis and hierarchical cluster analysis. Eight compounds were deduced from HPLC-DAD-ESI-MS/MS.
Conclusions:
This method is a reliable and effective tool to differentiate the three Citri Reticulatae Pericarpium.
SUMMARY
The internal transcribed spacer 2 regions and the secondary structure among three kinds of Citri Reticulatae Pericarpium varied considerably
All the 22 samples were analyzed by high-performance liquid chromatography (HPLC) to obtain the chemical profiles
Principal component analysis and hierarchical cluster analysis were used in the chemometric analysis
deoxyribonucleic acid barcoding and HPLC-diode array detection-electrospray ionization/mass spectrometry/MS coupled with chemometric analysis provided an accurate and strong proof to identify these three herbs.
Abbreviations used: CTAB: Hexadecyltrimethylammonium bromide, DNA: Deoxyribonucleic acid, ITS2: Internal transcribed spacer 2, PCR: Polymerase chain reaction.
Keywords: Chemometric analysis, Citri Reticulatae Pericarpium, deoxyribonucleic acid barcoding, high-performance liquid chromatography-diode array detection-electrospray Ionization/mass spectrometry/MS
INTRODUCTION
Citri Reticulatae Pericarpium (“Chenpi” in Chinese) is a well-known traditional herbal medicine, which is the dried mature pericarp of Citrus reticulata Blanco, belonging to the family Rutaceae.[1] The Chinese Pharmacopoeia 2010 recorded that Citri Reticulatae Pericarpium can be divided into “Chenpi” and “Guangchenpi.” “Chenpi” is usually referred to the following cultivars, Citrus reticulata “Tangerina,” Citrus reticulata “Dahongpao,” and Citrus reticulata “Unshiu.” “Guangchenpi” is referred to the cultivar Citrus reticulata “Chachi,” which is the geoherb in Xinhui, Guangdong province.[2] Citri Reticulatae Pericarpium is used for dyspepsia, asitia, emesis, and cough clinically. The main components in Citri Reticulatae Pericarpium are essential oil and flavonoids. Zhou et al.[3] reported that the essential oil of Citri Reticulatae Pericarpium can relief asthma, cough, and prevent allergic inflammation. The flavonoids also have a wide range of pharmacological effects. Shan et al.[4] reported that hesperidin had a strong effect on radical scavenging and antioxidant activities. Li et al.[5] found that the polymethoxylated flavonoids can inhibit the growth of a variety of cancer cells. In addition, the flavonoids can prevent cardiovascular diseases such as atherosclerosis and inhibit platelet aggregation. Besides for clinical use, Citri Reticulatae Pericarpium can also be processed as daily food, drinks, and snacks.[6] “Guangchenpi” (Citrus reticulata “Chachi”) from Guangdong province has the best quality, least amount, and is the most expensive among other kinds of Citri Reticulatae Pericarpium. Therefore, we need to find a valid and accurate approach to separate “Guangchenpi” (Citrus reticulata “Chachi”) from other Citri Reticulatae Pericarpium. In this study, we selected three kinds of Citri Reticulatae Pericarpium, i.e., “Chenpi” (Citrus reticulata “Unshiu”), “Guangchenpi” (Citrus reticulata “Chachi”), and “Chenpi” (Citrus reticulata “Dahongpao”) to compare the differences among them using the deoxyribonucleic acid (DNA) barcoding and high-performance liquid chromatography-diode array detection-electrospray Ionization/mass spectrometry (HPLC-DAD-ESI-MS)/MS methods.
DNA barcoding provided a new identification method that uses short and standard DNA sequences for species identification.[7] A desirable DNA barcode is considered to be easily amplified using universal primers. The success of amplification depends on the quality of the DNA extracted from the specimens. As a matter of fact, the DNA degraded during the process of dry and long-term storage of the herbal materials commercially available.[8] As a result, amplifying long DNA regions from some of these materials is very difficult. The internal transcribed spacer 2 (ITS2) is an ideal region as it is part of the eukaryotic nuclear rDNA cistron and lies between the 5.8S and the 28S rRNA.[9] The ITS2 region is fast evolving, containing highly conservative sites, and is dependable for amplification and sequencing, which allows classification of different specimens at species level.[8] Besides, the ITS2 structure is a conserved core which exists widely among diverse species such as animals, plants, and yeast. The secondary structure has a common existence within eukaryotes. There are more than 5000 ITS2 sequences and corresponding secondary structures. The ITS2 secondary structure can be predicted on the homology basis. The ITS2 secondary structure is built on the Needleman–Wunsch algorithm guiding to global optimal alignments between a known sequence and a novel sequence.[9] Start and end positions are inferred from the surrounding 5.8S and 28S regions that are highly conserved.[10,11] Therefore, we selected ITS2 region to establish the DNA barcoding method and predict the secondary structure in this study.
MATERIALS AND METHODS
Apparatus
An electronic balance (KERN ABT 220-5DM, 0.1 mg, Germany), a thermostatic water bath (Shanghai Yarong Biochemical Instrument Factory, China), an SB25-12DTD ultrasound machine (Xinzhi Biotechnical Ltd, Ningbo, China), and an Eppendorf centrifuge 5417R (Eppendorf AG, Hamburg, Germany) were used for sample preparation and DNA extraction. Polymerase chain reaction (PCR) amplification was performed on the K960 thermal cycler (Hangzhou Jingge Scientific Instrument Co., Ltd.). The HPLC-DAD-MS/MS analysis was performed on a Finnigan Liquid Chromatograph with a DAD detector and a TSQ quantum mass spectrometer (Thermo, USA). The mass spectrometer was handled in electrospray ionization (ESI) resource.
Chemicals and reagents
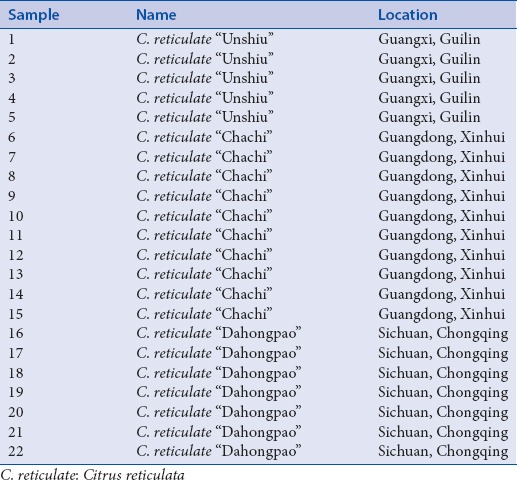
A total of 22 Citri Reticulatae Pericarpium samples were collected from Guangdong, Chongqing, and Guangxi provinces Table 1. They were authenticated by Dr. Lin Jiang, Sun Yat-Sen University, China. Cetyltrimethylammonium bromide (CTAB), NaCl, EDTA, chloroform, isopropanol, isoamyl, mercaptoethanol, and methanol were of analytical grade and manufactured by Tianjin Zhiyuan Chemical Reagent Factory (Tianjin, China). PVP-40, Tris-HCl (pH 8.0), TE buffer, TAE buffer, agarose, Taq PCR Master Mix (2×, blue dye), and SanPrep Column DNA Gel Extraction Kit were purchased from Sangon Biotech (Shanghai). Goldview (MYM Biological Technology Co., Ltd. USA) was used for agarose examination. Acetonitrile was of HPLC grade manufactured by SK Chemicals (Korea). Ultrapure water was obtained from a Milli-QRG purification unit (Millipore, Bedford, MA, USA).
Table 1.
Sample collection
Sample pretreatment for deoxyribonucleic acid extraction
About 100 mg of each sample was grinded with 5% (w/w) PVP-40 and added into a 2 mL tube. The samples were washed by 0.1 mol/L Tris-HCl (pH 8.0) twice and then the supernatant was discarded.
Total deoxyribonucleic acid extraction
Genomic DNA of all the materials was extracted using a modified CTAB method. The 3× CTAB extracting buffer contained 3% (w/v) CTAB, 5 mol/L NaCl, 0.1 mol/L Tris-HCl, 0.5 mol/L EDTA, and 0.2% (v/v) mercaptoethanol.
The prewashed sample was extracted with 1 mL CTAB buffer under 65°C water bath for 1 h. The sample was shaken every 15 min. After the sample was cool to room temperature, 1 mL chloroform-isoamyl (24:1) was added, shaken tenderly, and centrifuged (12,000 rpm/min for 10 min) to collect the supernatant. This procedure was repeated again. 0.6 mL cool isopropanol was added into the collected supernatant and stock under −20°C for 2 h. Sediment was collected after centrifugation (12,000 rpm/min for 10 min). The sediment was washed by 75% cool ethanol twice. The obtained sediment was dissolved in 200 μL TE buffer and stock under −20°C.
Polymerase chain reaction amplification and deoxyribonucleic acid sequencing
DNA barcodes were amplified by PCR using universal primers (S2F: 5'-ATG CGA TAC TTG GTG TGA AT-3’ and S3R: 5'-GAC GCT TCT CCA GAC TAC AAT-3'). Each 25 μL reaction mixture contained 12.5 μL Taq PCR Master Mix, 1 μL Genomic DNA, 1 μL of each 10 μM primer, MgCl2 1 μL, and ddH2O 8.5 μL. The PCR conditions for amplification were as follows: 1 cycle of 94°C for 5 min; 40 cycles of 94°C for 30 s, 56°C for 30 s, 72°C for 45 s; and 1 cycle of 72°C for 10 min, and hold 4°C. To detect successfully amplified products and the possible contamination of negative controls, PCR products were examined on 2% agarose gels stained with Goldview and visualized under ultraviolet light. Amplified products were purified following the manufacturer's protocol for SanPrep Column DNA Gel Extraction.
Sequence alignment and analysis
All the amplified products were sent to Sangon Guangzhou for sequencing. The sequences were analyzed by MEGA 5.0 (Molecular Evolutionary Genetics Analysis). The secondary structures were predicted according to the database and website (http://its2.bioapps. biozentrum. uni-wuerzburg. de/) established by Jörg Schultz et al.[9,10,11]
Preparation of sample solution
Sample solutions were prepared by extracting 0.3 g dried and pulverized herbs with 30 mL methanol under ultrasonic condition at room temperature for 30 min. After cooling, the extracted solution was added with methanol to the original weight. The extracts were filtered through a 0.45-μm filter before used for HPLC analysis.[12]
High-performance liquid chromatography conditions
Chromatographic separation was carried out on a Diamonsil C18 column (250 × 4.6 mm, 5 μm; Dikma, Beijing) along with a guard column (15 × 4.6 mm, 5 μm; Dikma, Beijing). The separation was conducted at 35°C with a flow rate of 1.0 mL/min. The mobile phase consists of acetonitrile (A) and 0.5% formic acid aqueous solution (B). The elution gradient program was as follows: 0–65 min, 10%→75% (A). The detection wavelength was 283 nm.[2]
High-performance liquid chromatography-diode array detection-electrospray ionization/mass spectrometry/MS analysis
The chromatographic conditions are described above. The flow rate was maintained at 0.3 mL/min using a union tee for split-flow. Other instrument parameters were set as follows: positive-ion mode; ESI needle voltage 3500 V; capillary temperature 270°C; sheath gas nitrogen (>99% purity), 40 arbitrary units, and auxiliary gas nitrogen (>99% purity), 20 arbitrary units. The full-scan mode covered the mass range from m/z 100–1000. The MS data were synchronously acquired for the selected precursor ions. Argon was used as the collision gas for the collision-induced decomposition MS/MS experiments; the collision energy was 40 eV. Instrumental control and data acquisition were operated on the Xcalibur 2.0 data system (Thermo Fisher Scientific Inc. USA).
Chemometric analysis
Principal component analysis (PCA) and hierarchical cluster analysis (HCA) were analyzed on the SAS 9.0 software (Statistical Analysis System, USA) to demonstrate the variability among the 22 samples.
RESULTS
Internal transcribed spacer 2 sequence analysis and secondary structure comparison
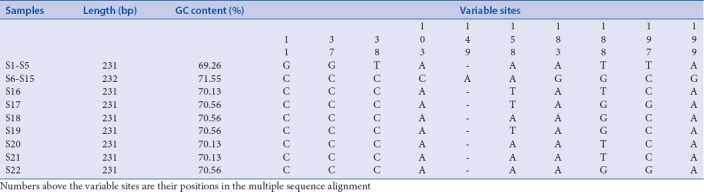
The results of DNA barcoding showed a good differentiation. The ITS2 of all samples was successfully amplified from total DNA and sequenced. Properties of the ITS2 region are summarized in Table 2. The genetic distance was calculated by MEGA 5.0, based on Kimura-2-parameter model. The intraspecies distance (dintra) of Citrus reticulata “Dahongpao” was 0.007 and there were no intraspecies variations for Citrus reticulata “Unshiu” and Citrus reticulata “Chachi.” The interspecies distance (dinter) was 0.035 between Citrus reticulata “Unshiu” and Citrus reticulata “Chachi,” 0.022 between Citrus reticulata “Unshiu” and Citrus reticulata “Dahongpao,” and 0.018 between Citrus reticulata “Chachi” and Citrus reticulata “Dahongpao.”
Table 2.
Properties of the internal transcribed spacer 2 region of the 22 samples
The secondary structure of these three kinds of Citri Reticulatae Pericarpium is shown in Figure 1. The ITS2 secondary structures were significantly different. Helix IV was conservative. The main differences were Helix I, II, and III. Helix I of Citrus reticulata “Unshiu” was shorter in length. Helix II was similar for Citrus reticulata “Chachi” and Citrus reticulata “Dahongpao” but greatly different compared to Citrus reticulata “Unshiu.” Both Citrus reticulata “Unshiu” and Citrus reticulata “Dahongpao” had 6 loops on helix III while Citrus reticulata “Chachi” had only 5 loops. Consequently, it is easy to separate them based on the ITS2 secondary structures.
Figure 1.

The secondary structures of Citrus reticulata “Unshiu”(a), Citrus reticulata “Chachi,” (b) and Citrus reticulata “Dahongpao”(c)
The results showed that it was feasible to use sequence alignment and secondary structure comparison to accurately distinguish Citrus reticulata “Chachi” from Citrus reticulata “Unshiu” and Citrus reticulata “Dahongpao.”
High-performance liquid chromatography analysis
All the 22 samples were analyzed by HPLC to obtain the chemical profiles. 11 peaks were chosen as the characteristic peaks Figure 2.
Figure 2.
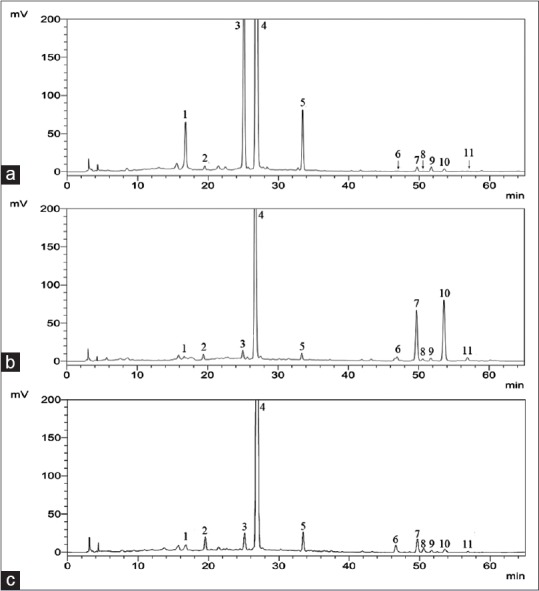
High-performance liquid chromatography chromatogram of the three Citri Reticulatae Pericarpium and the 11 peaks were labeled. Citrus reticulata “Unshiu” (a), Citrus reticulata “Chachi,” (b) and Citrus reticulata “Dahongpao” (c)
Deduction of chromatographic peaks in Citri Reticulatae Pericarpium by high-performance liquid chromatography-diode array detection-electrospray ionization/mass spectrometry/MS
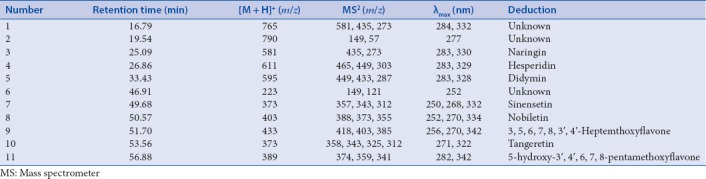
For the sake of obtaining more information about the chemical profiles of Citri Reticulatae Pericarpium, HPLC-DAD-ESI-MS/MS was applied. The MS data of components in Citri Reticulatae Pericarpium are listed in Table 3. The retention time, maximum absorption of ultraviolet spectrum, and mass spectral data of the components are compared to those of available references.[2,13] On the whole, 8 compounds were deduced in Citri Reticulatae Pericarpium from HPLC-DAD-ESI-MS/MS.
Table 3.
High-performance liquid chromatography-diode array detection-electrospray ionization-mass spectrometer/mass spectrometer data of deduced and tentatively characterized compounds from Citri Reticulatae Pericarpium
Principal component analysis
PCA can reduce the multiple dimensions to 2 or 3 dimensions so that we can draw scatter diagram in plane or space rectangular coordinate system for those data samples. It was employed to analyze the differences among these 22 Citri Reticulatae Pericarpium samples by SAS 9.0 software (Statistical Analysis System, USA). Each peak area of 11 characteristic peaks was used as one variable and each sample was used as one observation. PC1 explained 52.6% of the total variance in the data set while PC2 explained 31.7%. The first two PCs reduced the multidimensional space to two dimensions. Figure 3 shows the score diagram and loading diagram from 22 samples. From the loading diagram, PC1 shows a strong correlation with peak 1 (unknown compound), 3 (naringin), 5 (didymin), 7 (sinensetin), 10 (tangeretin), and 11 (5-hydroxy-3′, 4′, 6, 7, 8-pentamethoxyflavone) and PC2 shows a great correlation with peaks 6 (unknown compound) and 8 (nobiletin). As shown in the score diagram, all samples were clearly classified into three groups, i.e., Group 1 (S1, S2, S3, S4, and S5), Group 2 (S6, S7, S8, S9, S10, S11, S12, S13, S14, and S15), and Group 3 (S16, S17, S18, S19, S20, S21, and S22). The result of PCA was in accordance with that of DNA barcode. Therefore, PCA could be a helpful analytic method to distinguish samples which resemble each other in similarity value.
Figure 3.
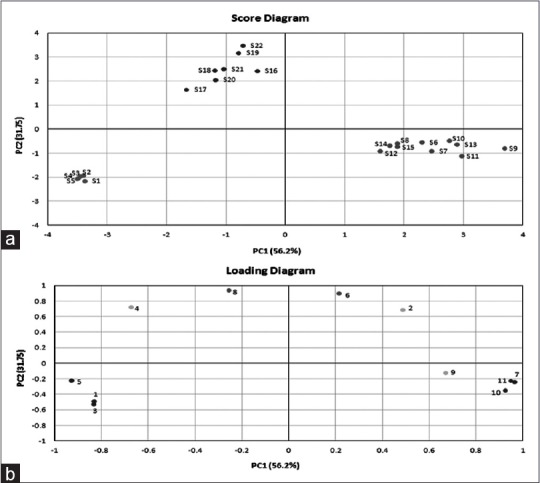
Scores (a) and loading diagrams (b) of principal component analysis. Numbers in the loading diagram represent the peak number depicted in Figure 2
Hierarchical cluster analysis
HCA divides each data sample into small pieces and then combines classes with minimum distance. This process continues until all the samples are classified as a large group. HCA was applied to analyze the Citri Reticulatae Pericarpium sample data using each peak area as variable and each sample as observation. The Ward's method was used as the amalgamation rule and the Euclidean distance was selected to describe the degree of familiarity between different samples. Three well-defined clusters were shown in Figure 4. S1–S5 were categorized into cluster 1, S16–S22 were categorized into cluster 3, and S6–S15 were categorized into cluster 2. The result was in accordance with those of DNA barcode and PCA.
Figure 4.

The dendrogram of 22 samples of Citri Reticulatae Pericarpium by hierarchical cluster analysis
DISCUSSION
Authenticity assurance is crucial for quality control of natural products. It is essential to develop different approaches to authenticate the natural products as each approach has advantages that complements to one another.[14]
It is easy to obtain high-quality DNA from fresh- or silica gel-dried plant samples; however, the conditions are more complicated for the commercial medicinal materials because there are a plenty of varieties of secondary metabolites in the cells, such as polysaccharides, polyphenols, and resin. These compounds will coprecipitate with DNA and form insoluble sticky jelly-like substance, seriously affecting the quantity and quality of DNA, as well as PCR amplification. Therefore, it is important to pretreat the samples before the DNA extraction.[14]
To remove part of the polysaccharides and pigments, we washed the samples by 0.1 M Tris-HCl (pH 8.0) twice before the DNA dissolved. In addition, we raised the CTAB and NaCl concentration to 3% and 5 M, respectively. This can also remove the polysaccharides. As for removing the polyphenols, we added 5% PVP-40 while grinding the samples to chelate the polyphenols. Besides, 0.2% mercaptoethanol was added into the CTAB buffer to prevent oxidation.
A desirable DNA barcode should process high interspecific divergences and low intraspecific variations. The Consortium for the Barcode of Life suggested to compare the inter- and intra-specific distances to estimate the identification effectiveness of the selected barcode. An ideal “barcoding gap” should be interspecific divergences significantly larger than intraspecific divergences. If dinter/dintra is smaller than 1, it may not be a suitable DNA barcode.[15] In this study, dinter/dintra was larger than 1. Therefore, the ITS2 region was an appropriate DNA barcode for identifying Citri Reticulatae Pericarpium.
The Chinese Pharmacopoeia (2010) used hesperidin as the standard chemical marker for Citri Reticulatae Pericarpium. However, all these three kinds of Citri Reticulatae Pericarpium contained hesperidin and therefore hesperidin cannot be used as the sole component to differentiate these three kinds of Citri Reticulatae Pericarpium. HPLC-DAD-ESI-MS/MS was applied to obtain more information about the chemical profiles of Citri Reticulatae Pericarpium. Both PCA and HCA were used for analysis.
CONCLUSIONS
In this study, DNA barcoding and HPLC-DAD-ESI-MS/MS combined with chemometric analysis were successfully applied to separate the three kinds of Citri Reticulatae Pericarpium. The DNA barcoding result was in accordance with those of PCA and HCA analysis. This method is a reliable and effective tool for the differentiation of the three Citri Reticulatae Pericarpium.
Financial support and sponsorship
This work was supported by the Science and Technology Plan Project from Science and Technology Department of Guangzhou City (No: 2014Y2-00216), the Industry-University-Research Cooperation Program from Science and Technology Department of Guangdong Province (No: 2013B090600058 and No: 2013B090500100) and the Innovative Scientific Research Team Introducing Project of Zhongshan City (2015-224).
Conflicts of interest
There are no conflicts of interest.
Acknowledgements
This work was supported by the Science and Technology Plan Project from Science and Technology Department of Guangzhou City (No: 2014Y2-00216), the Industry-University-Research Cooperation Program from Science and Technology Department of Guangdong Province (No: 2013B090600058 and No: 2013B090500100), and the Innovative Scientific Research Team Introducing Project of Zhongshan City (2015-224).
REFERENCES
- 1.Chinese Pharmacopoeia Commission. Appendix. Chinese Pharmacopoeia. 1st ed. Vol. 1. Beijing: China Medical Science Press; 2010. pp. 176–7. [Google Scholar]
- 2.Yang Y, Jiang L, Zheng GD, Lin LW, Chen JL, Zhou W. HPLC fingerprint of Pericarpium Citri Reticulatae from Guangdong Province. Chin Med Mat. 2011;34:191–5. [PubMed] [Google Scholar]
- 3.Cai ZQ, Dai Y, Yuan HY. The pharmacology study of the essential oil in Pericarpium Citri Reticulatae. China Pharm. 2006;15:29–30. [Google Scholar]
- 4.Shan Y, Li GY, Li ZH. In virto antioxidation activity of multimethoxyl flavonoids from citrus peel. Food Sci. 2007;28:100–3. [Google Scholar]
- 5.Li LY, Peng YR. The influence of multimethoxyl flavonoids from Citri Reticulatae Pericarpium on cell proliferation of human liver cancer SMMC-7721 HepG2 cell. Chin Med Mat. 2007;30:324–6. [Google Scholar]
- 6.Jiang L, Du Z. The analysis of national Citri Reticulatae Pericarpium industry and difference between Xinhui Citri Reticulatae Pericarpium and other species. The third China Xinhui Citri Reticulatae Pericarpium industrial development forum. China Xinhui Citri Reticulatae Pericarpium. 2011:24–38. [Google Scholar]
- 7.Techen N, Parveen I, Pan ZQ, Khan AI. DNA barcoding of medicinal plant material for identification. Curr Opin Biotechnol. 2014;25:103–10. doi: 10.1016/j.copbio.2013.09.010. [DOI] [PubMed] [Google Scholar]
- 8.Han JP, Zhu YJ, Chen XC, Liao BS, Yao H, Song JY, et al. The short ITS2 sequence serves as an efficient taxonomic sequence tag in comparison with the full-length ITS. Biomed Res Int. 2013;2013:741476. doi: 10.1155/2013/741476. [DOI] [PMC free article] [PubMed] [Google Scholar]
- 9.Schultz J, Müller T, Achtziger M, Seibel NP, Dandekar T, Wolf M. The internal transcribed spacer 2 database-A web server for (not only) low level phylogenetic analyses. Nucleic Acids Res. 2006;34(Suppl 2):704–7. doi: 10.1093/nar/gkl129. [DOI] [PMC free article] [PubMed] [Google Scholar]
- 10.Selig C, Wolf M, Müller T, Dandekar T, Schultz J. The ITS2 database II: Homology modelling RNA structure for molecular systematics. Nucleic Acids Res. 2008;36:D377–80. doi: 10.1093/nar/gkm827. [DOI] [PMC free article] [PubMed] [Google Scholar]
- 11.Koetschan C, Förster F, Keller A, Schleicher T, Ruderisch B, Schwarz R, et al. The ITS2 database III-Sequences and structures for phylogeny. Nucleic Acids Res. 2010;38(Suppl 1):D275–9. doi: 10.1093/nar/gkp966. [DOI] [PMC free article] [PubMed] [Google Scholar]
- 12.Zheng GD, Yang DP, Wang DM, Zhou F, Yang X, Jiang L. Simultaneous determination of five bioactive flavonoids in Pericarpium Citri Reticulatae from China by high-performance liquid chromatography with dual wavelength detection. J Agric Food Chem. 2009;57:6552–7. doi: 10.1021/jf901225e. [DOI] [PubMed] [Google Scholar]
- 13.Ye XL, Cao D, Zhao X, Song FY, Huang QH, Fan GR, et al. Chemical fingerprint and metabolic profile analysis of Citrus Reticulate ‘Chachi’ decoction by HPLC-PDA-IT/MSn and HPLC-Q-orbitrap MS method. J Chromatogr B Analyt Technol Biomed Life Sci. 2014;970:108–20. doi: 10.1016/j.jchromb.2014.06.035. [DOI] [PubMed] [Google Scholar]
- 14.Shaw PC, Wang J, But PP. Authentication of Chinese medicinal materials by DNA technology. Singapore: World Scientific; 2002. pp. 1–23. [Google Scholar]
- 15.Chen SL. DNA barcoding molecular markers in Chinese medicinal materials. Beijing: People's Medical Publishing House; 2012. pp. 18–9. [Google Scholar]