Abstract
Purpose
Vernier and grating acuity can be measured with swept-parameter visual evoked potentials (sVEP). However, whether sVEP Vernier and grating acuities are comparable in predicting letter acuity has not been systematically evaluated. This study evaluated the validity and reliability of sVEP Vernier and grating acuity for the detection of amblyopia in adults.
Methods
Three types of acuity were measured in 36 adults with amblyopia and 36 age-matched normal-vision controls. Letter acuity was measured with a logMAR chart. Both Vernier and grating acuity were estimated by sVEP and psychophysics for the same stimuli. Regression analyses were performed between the perceptual and electrophysiologic acuity measurements.
Results
SVEP Vernier and grating acuities were significantly correlated with their corresponding psychophysical acuities (P < 0.001). Both the sVEP Vernier (P < 0.0001) and grating (P < 0.01) acuities were also significantly correlated with letter acuity. However, Vernier acuity more precisely reflected the magnitude of the letter acuity loss than did grating acuity for both sVEP and psychophysical measures. Repeating sVEP grating acuity tests with different temporal frequencies and modulation types indicated good reliability of sVEP acuity measures.
Conclusions
SVEP Vernier acuity has a 1:1 relationship with letter acuity, but sVEP grating acuity does not. SVEP Vernier acuity thus provides a better characterization of the magnitude of the amblyopic acuity loss than does sVEP grating acuity. Nonetheless, each of the sVEP measurements can be used to predict letter acuity and because they can be made without a behavioral response, they may be useful measures of visual function in pre- and nonverbal patients.
Keywords: Vernier acuity, grating acuity, amblyopia, strabismus, swept-parameter visual evoked potentials
Accurate visual acuity estimation is an essential tool for clinical practice, but is problematic in pre-, and nonverbal patients. The most common application of visual acuity assessment in pediatric patients is detection of amblyopia, the most frequent cause of monocular visual acuity loss in early childhood,1 affecting about 3% of the population.2 Importantly, early detection and management of amblyopia improves treatment efficacy.3 However, early detection of amblyopia can be difficult, due to an inability to perform standard clinical visual acuity tests (discrimination of high contrast letters, referred to as letter acuity) in infants and nonverbal children. Therefore, it is routine clinical practice to use risk factors that are commonly associated with amblyopia to estimate the likelihood and severity of amblyopia. These factors include strabismus (turned eye), visual fixation responses4; anisometropia (unequal refractive errors); and occlusion of the visual axis (e.g., congenital cataract, ptosis, etc.). A quantitative and objective technique for visual acuity assessment in pre- or nonverbal patients is needed. Potential objective techniques for measuring visual acuity include the swept-parameter visual evoked potential (sVEP) and forced-choice preferential looking (FPL)5,6 techniques. In this study, we focused on sVEP acuity measures.
There are two types of acuity other than letter acuity that have been measured psychophysically (behavioral response dependent on perception) in adults with amblyopia.7,8 The first is grating acuity, the high spatial frequency visibility limit, and the other is Vernier acuity (the smallest perceptible misalignment).7 These two types of acuity have both been measured with the sVEP in infants,9,10 and in children with cortical visual impairment who are often unable to provide reliable behavioral measures of visual acuity.11,12 Measurement of sVEP Vernier acuity also offers a sensitive visual assessment in amblyopia. For example, an amblyopia-like effect on sVEP Vernier acuity was recorded in infants with a history of unilateral periocular vascular birthmarks that caused intermittent occlusion of one eye despite a normal clinical assessment of acuity.13 SVEP Vernier acuity measurements also reflect visual acuity loss in adults with amblyopia.14
The sVEP does not require behavioral responses or an ability to respond to instructions, making it well-suited for objective measurement of visual acuity in pre- and nonverbal patients. However, whether Vernier and grating acuities with sVEP measure are comparable in predicting letter acuity has not been systematically evaluated. The reliability (test-retest) of sVEP acuity measures also needs evaluation. A necessary prerequisite for any proposed nonverbal test of visual acuity is that it should produce valid measures in adults. In this study, we evaluated the validity and reliability of sVEP acuity measures in predicting letter acuity in adult amblyopia with a wide range of visual acuity losses in age-matched normal-vision controls. We made clinical letter acuity measurements, along with sVEP and psychophysical acuity measurements. Validity was assessed in two ways: whether sVEP acuities measured in verbal subjects who can report their perceptual experience are accurate reflections of their psychophysical Vernier and grating acuity for the same stimuli; and whether sVEP Vernier and grating acuity measurements are comparable in predicting letter acuity, the gold standard visual acuity measurement in clinical practice. Reliability was assessed by repeating sVEP grating acuity measures with different temporal frequencies and modulation types. A portion of the data has been reported previously.14
Methods
Participants
In total 36 patients with amblyopia (17 females) aged between 18 and 68 years (mean ± SD, 41 ± 13) and 36 age-matched normal-vision controls (19 females) aged between 18 and 66 years (mean ± SD, 42 ± 12) participated in the study. All participants were recruited from the San Francisco Bay Area with a research advertisement, and data were collected between March 2000 and March 2003. The study protocol was approved by the Institutional Review Board of the California Pacific Medical Center and conformed to the tenets of the Declaration of Helsinki. A written consent form was obtained from the participants after the experimental procedures were explained. Each participant was seen twice within 2 weeks: the first visit was for refraction, letter acuity, and sVEP acuity measurement; and the second visit was for psychophysical acuity measurement. The second visit occurred within 2 weeks following the first visit. There were missing data due to missed second visit, or due to an inability to complete all psychophysical test conditions. All amblyopic patients along with their letter acuity and refractive errors were included in Table 1. The number of participants for each of the different tests is listed in Tables 2, 3, and 4.
Table 1.
Letter Acuity and Refractive Errors in Patients With Amblyopia
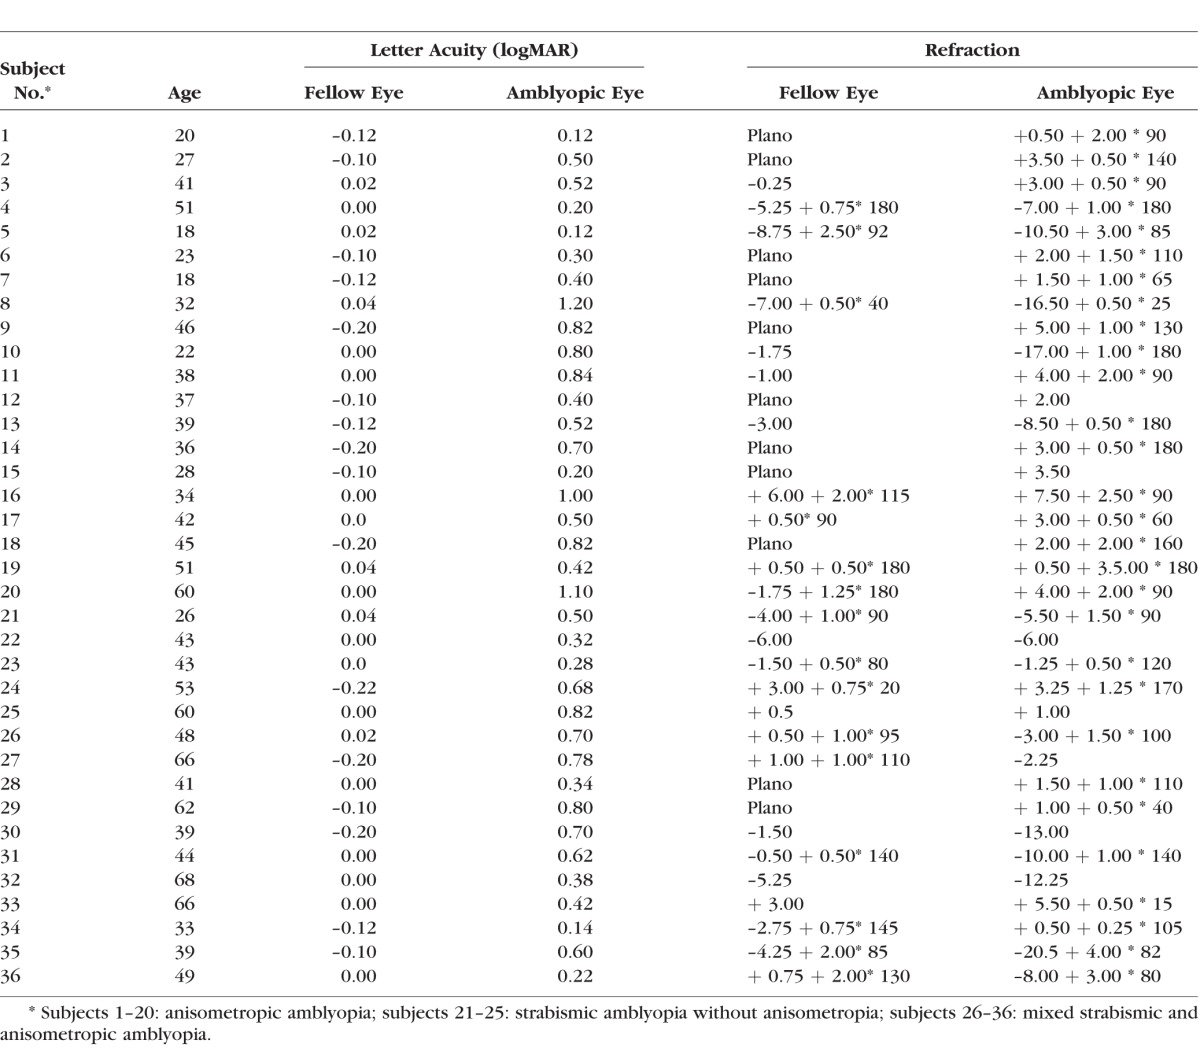
Table 2.
Statistical Summary for Correlations of sVEP Acuities and Psychophysical Acuities
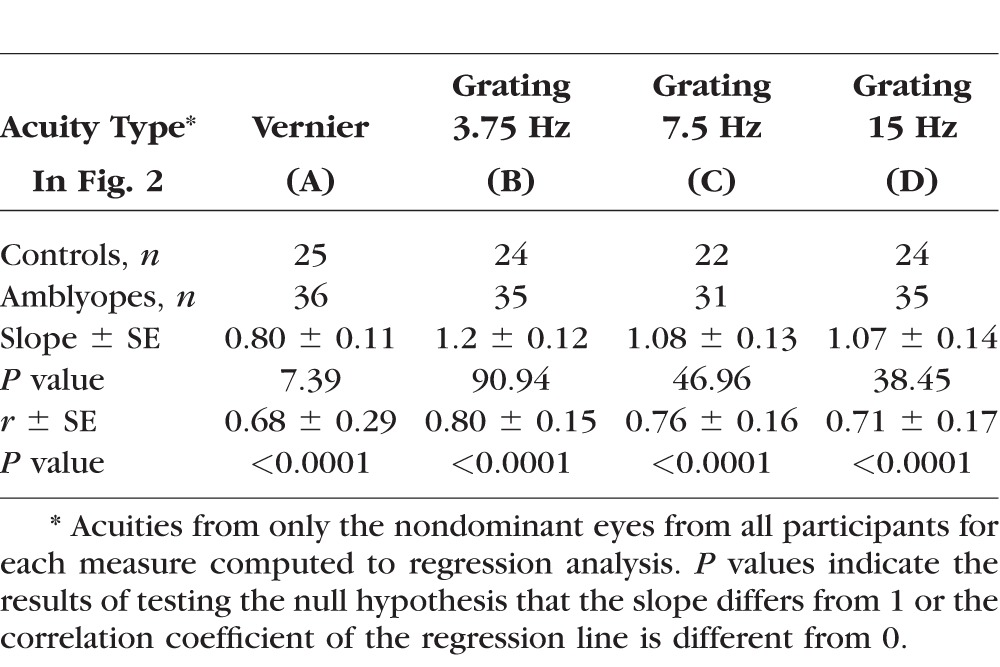
Table 3.
Statistical Summary for Correlations of sVEP/Psychophysical Acuity and Letter Acuity
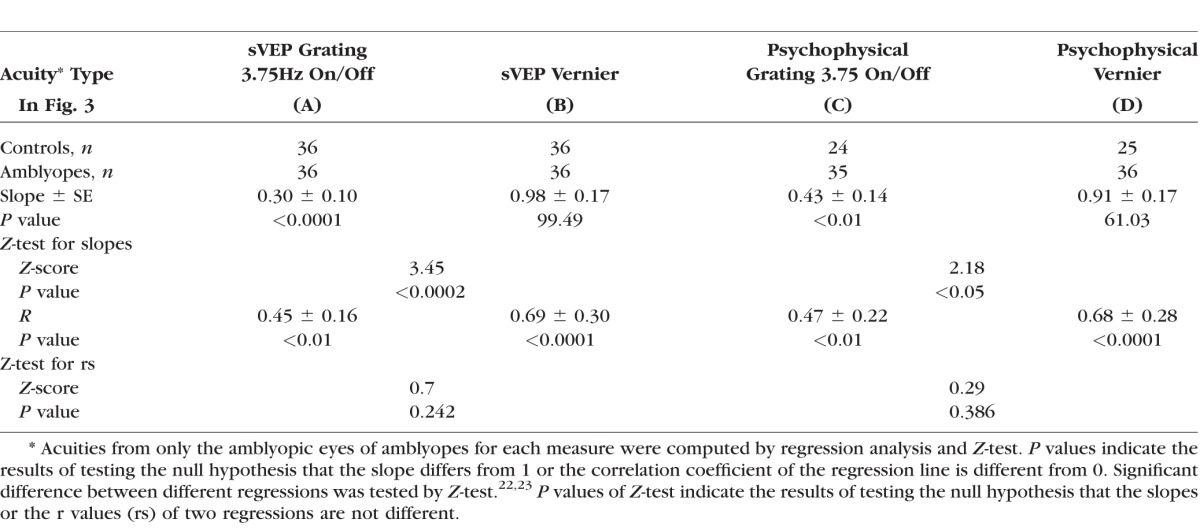
Table 4.
Statistical Summary for Equality of Coefficients From Two Different Regressions
Inclusion Criteria and Letter Acuity Measurement
Letter acuity measurement was performed with best optical correction for all participants with a logMAR chart (Bailey-Lovie) before the sVEP recordings in the first visit. Normal-vision controls (referred as “controls”) had or were corrected to 20/20 vision, or 0.0 logMAR (logarithm of the minimum angle of resolution) or better letter acuity in each eye. Ocular dominance was determined with the hole-in-the-card test for all participants. All amblyopic participants were refracted under noncycloplegic conditions by a pediatric ophthalmologist (WVG or CH) before the sVEP recordings. Inclusion criteria for participants with amblyopia included: (1) 0.1 logMAR (20/25) or worse acuity in one eye (defined as “amblyopic eye”, with the other eye being 0 logMAR or better (defined as “fellow eye”; (2) no history of congenital cataract; ptosis; lens implant; or other eye disease (e.g., cataract, glaucoma, retinal disease). Slit lamp examination and direct ophthalmoscopy were used to exclude other eye diseases. We recruited patients with a large range of letter acuities from 20/25 (0.1 logMAR) to 20/300 (1.2 logMAR), as detailed in Table 1. Amblyopic participants with unequal refractive error between the two eyes of ≥1.0 D in any meridian and with no constant ocular deviation or history of strabismus surgery were classified as having anisometropic amblyopia (n = 20). Amblyopic participants with a constant ocular deviation or a history of prior strabismus surgery, with (n = 11) or without (n = 5) anisometropia were classified as having strabismic amblyopia. The mean letter acuity in the anisometropic group was –0.07 ± 0.02 (SEM) logMAR (ranging between –0.2 and 0 logMAR) in the fellow eye and 0.56 ± 0.07 logMAR (ranging between 0.1 and 1.2 logMAR) in the amblyopic eye. The mean letter acuity in the strabismic group was –0.06 ± 0.02 logMAR (ranging between –0.2 and 1.1 logMAR) in the fellow eye and 0.51 ± 0.06 logMAR (ranging between 0.2 and 1.1 logMAR) in the amblyopic eye. There were no significant differences in letter acuity between anisometropic and strabismic groups (P = 0.72 in the fellow eye; P = 0.58 in the amblyopic eye). Refractive errors were fully corrected for the testing distance (150 cm) in all participants during the experiments.
SVEP Vernier and Grating Acuity Measurement
Stimuli
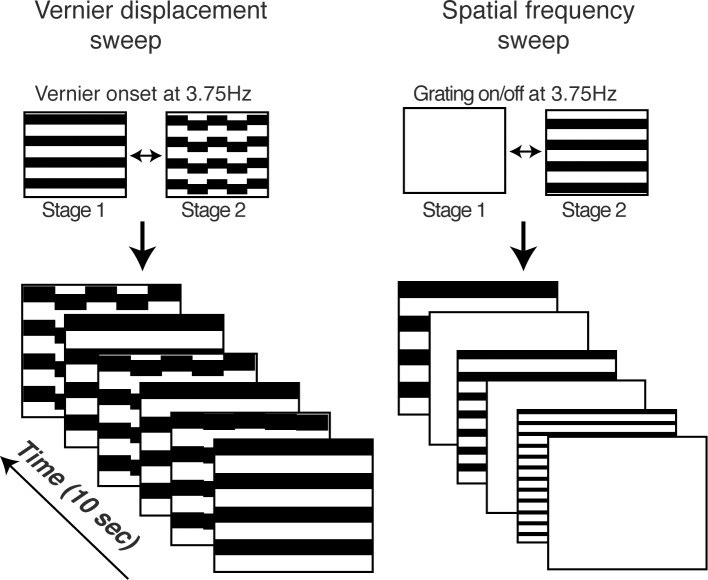
Figure 1 illustrates the Vernier displacement sweep paradigm (left column) and the spatial frequency (grating) sweep paradigm (right column, shown as grating on/off at 3.75 Hz as an example). Prior pilot testing had optimized the temporal frequency for the Vernier sVEP, but no comparable data were available from our laboratory for pattern reversal versus pattern appearance presentation modes or for stimulus temporal frequency, so these measurements were obtained here. The 7.5 Hz pattern reversal condition was included because this temporal frequency is commonly used for steady-state VEP spatial frequency measurements with pattern reversal.15 The 15 Hz on/off condition was included because the dominant response component (the first harmonic) has the same frequency as the dominant response component of the 7.5 Hz pattern reversal response (e.g., the second harmonic at 15 Hz).16,17
Figure 1.
Schematic illustration of sVEP stimuli for Vernier acuity (left) and for grating acuity (right) measurements. The stimulus alternated between the two depicted states: 3.75 Hz for Vernier stimuli; 3.75/15 Hz on/off and 7.5 Hz contrast reversal for grating stimuli (The grating stimuli were horizontal cosine-wave gratings, but are shown here as square-wave gratings for illustration purposes). The value of swept parameter changed over a period of 10 seconds. The displacement size of Vernier offset ranged from 0.5 to 8 arcmin in 10 equal logarithmic steps, and the spatial frequency of gratings ranged from 30 to 2 cyc/deg in 10 equal linear steps.
A frequency of 3.75 Hz was used for the pattern On/Off sweep to equate the temporal frequency of the first harmonic of the grating response to the first harmonic of the Vernier response. The repeated sVEP measurements also served as a conservative estimate the test and retest reliability of sVEP grating acuity measurements. The measure is conservative in that it includes both intrinsic repeatability differences and any (small) stimulus-related differences.
Stimulus generation and signal analyses were performed by in-house software running on separate computers (both Power Macintosh G3; Apple Computer, Cupertino, CA, USA). The stimuli were generated on a multisync video monitor (1600 × 1200 pixels; 60 Hz vertical refresh, video bandwidth, 150 MHz; MRHB2000; Richardson Electronics, Inc., LaFox, IL, USA) at a space average luminance of 110 cd/m2 and a Michelson contrast of 80%. Viewing distance was 150 cm, which generated a display size of 12° × 9°. A small fixation point in the center of the stimuli was given during the experiments.
SVEP Recording and Signal Analysis
We used Gold-cup surface electrodes (F-E5GH; Grass Telefactor, West Warwick, RI, USA) and an amplifier (model 12 A5; Grass Telefactor) to record the EEG at a gain of 50,000 with amplitude band-pass filter setting of 0.3 to 100 Hz. Three electrodes were placed over the occipital pole at O1, OZ, and O2 of the 10-20 electrode placement system.18 Reference and ground electrodes were placed at CZ and PZ, respectively. SVEP recording was monocular, and the nonviewing eye was occluded with a black eye patch. Four stimulus conditions (Vernier, grating on/off at 3.75 Hz and at 15 Hz, grating contrast reversal at 7.5 Hz) were recorded for each eye of all participants in a single sVEP recording session followed with letter acuity measurement. The stimulus conditions were run in a pseudo-random order for each eye, but were alternated between the two eyes upon completion of a given condition. Each stimulus condition consisted of eight 10-second trials. Breaks were given, as needed.
SVEP signal analysis was similar to the procedure described previously.19 In brief, a recursive least square (RLS) adaptive filter20 was used to determine sVEP amplitude and phase for the first four harmonics (1F, 2F, 3F, and 4F) of the stimulus frequency. The swept values were swept over a 10-second recording period (hereafter termed trial) that was divided into 10 sequential epochs of 1-second duration (hereafter termed epoch). Voltage-versus-swept value functions were obtained by coherently averaging the spectral coefficients for each epoch across trials for each participant, electrode position, harmonic, and stimulus condition. These functions were used to estimate thresholds for each participant's individual conditions.
SVEP Threshold Estimation
For each swept stimulus condition of each participant, response thresholds were estimated by regression of amplitudes from the trial-average epochs, where the response increased linearly to the point of stimulus visibility. The range of epochs eligible for regression depended on the statistical significance and phase consistency of the response according to an algorithm adapted from Norcia et al.21 The regression range was limited to those epochs where the following criteria were met: (1) The response probability in each epoch was at less than 0.16; (2) the phase difference for each pair of consecutive epochs was between 80° and –100°; (3) at least one pair of consecutive epochs had a response P value <0.077; and (4) to exclude spike artifacts, the amplitude of the epoch immediately before and after any given epoch in the range could not both be <0.3 times the amplitude of that given epoch. Once the regression range was established, the threshold was determined by extrapolating the regression line to 0 response amplitude. SVEP threshold estimation using the algorithm and the criteria described above were performed instantly by in-house software during EEG recordings. After data acquisition, manual inspection was conducted to correct poor line fits or outlying threshold values that had been detected automatically by the scoring algorithm. In the current study, Vernier displacement threshold at 1F determined by sVEP threshold estimation was defined as sVEP Vernier acuity, and similarly, spatial frequency threshold at 1F for grating on/off with 3.75 and 15 Hz and at 2F for grating reversal with 7.5 Hz was defined as sVEP grating acuity.
Psychophysical Vernier and Grating Acuity Measurement
After sVEP recordings, participants were requested to come back for a second visit for the psychophysical acuity measurements. A total of 36 participants with amblyopia and 25 out of 36 controls came back for the second visit. There were missing psychophysical data due to some participants' inability to complete all stimulus conditions within 2 hours (see details in Tables 2–4). We used the same stimulus paradigms as in sVEP recordings for psychophysical acuity measurements. A two-alternative, forced-choice (2AFC) with 2-down and 1-up staircase was used to estimate the 82% correct level of the psychometric function in monocular viewing condition. The nonviewing eye was occluded with a black eye patch.
For Vernier acuity measurement, the Vernier onset/offset at 3.75 Hz configuration defined the target interval, and the symmetrically jittered offsets at 3.75 Hz defined the null interval.14 For grating acuity measurements, the grating on/off screen at 3.75 Hz/15 Hz configuration and grating reversal at 7.5 Hz configuration defined the target interval, and the blank screen defined the null interval. The participant's task was to indicate which interval contained the target. The thresholds determined by the psychophysical procedures were defined as psychophysical Vernier or grating acuity. Four psychophysical acuity measurements (Vernier; grating on/off at 3.75 Hz and15 Hz; and grating reversal at 7.5 Hz) for each participant were conducted in a pseudorandom order for each eye, but were alternated between the two eyes upon completion of a given condition. Breaks were given, as needed.
Statistical Analysis
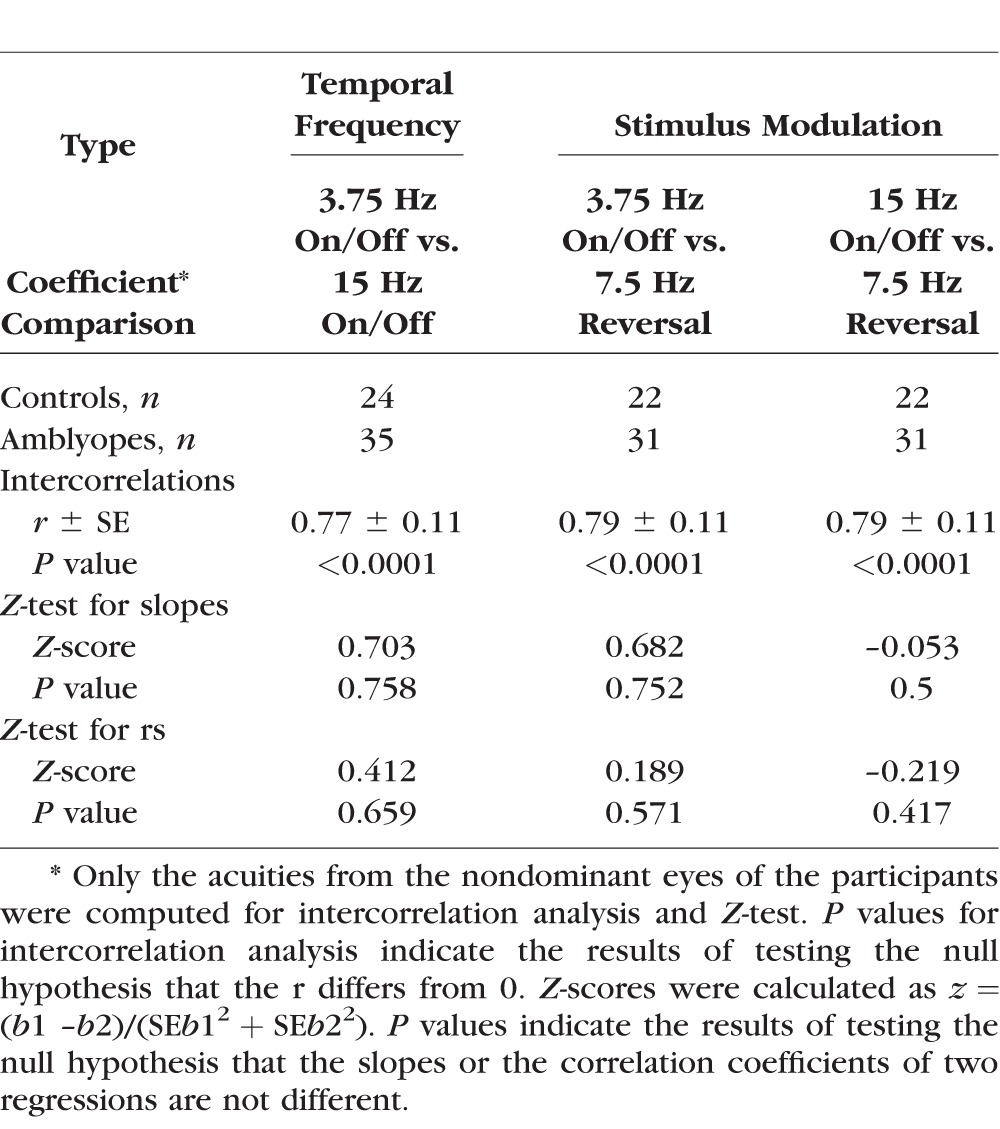
Correlations in Tables 2 through 4 were calculated using spreadsheet software (Excel; Microsoft Corp., Redmond, WA, USA) using a program add-in (Analysis ToolPak; https://support.office.com/, provided in the public domain). The equality of coefficients from two different regressions in Table 3 and 4 was tested by Z-test.22,23 Z-scores were calculated as z = (b1 – b2)/(SEb12 + SEb22), where b1 is coefficient (r or slope) from group 1 and b2 is coefficient (r or slope) from group 2. Significant differences in letter acuity between anisometropic and strabismic amblyopia were identified by two-tailed heteroscedastic t-test.
Results
Correlating sVEP Acuity With Psychophysical Acuity
To evaluate whether sVEP acuities are accurate reflections of their perceptual acuities, we correlated sVEP acuities to psychophysical acuities in each of different tests. Figure 2 plots sVEP acuities against psychophysical acuities. As 25 out of 36 controls came to the second visit for psychophysical acuity measures, and some participants (including controls and patients) completed subset of the tests, Figure 2 only includes the participants who completed both sVEP and psychophysical acuity measures. The number of participants in each of the tests is listed in Table 2. As seen in Figure 2 and Table 2, sVEP acuities and psychophysical acuities were correlated well. The correlations (r values) ranged between 0.68 and 0.8, and the slopes were close to 1. Note that the acuities from both eyes of each participant were plotted in Figure 2, but only the acuities from the nondominant eye across participants/groups were computed in the regression analysis. The summary of statistical tests is shown in Table 2.
Figure 2.
Correlation of sVEP acuities and psychophysical acuities. Colors represent the groups: blue, normal-vision controls; red, anisometropic amblyopes; green, strabismic amblyopes. Open symbols represent the dominant eye. Filled symbols represent the nondominant eye. Solid lines: 1:1 ratio. (A) Vernier acuity measured with Vernier displacement on/off at 3.75 Hz. (B) Grating acuity measured with on/off mode at 3.75 Hz. (C) Grating acuity measured with contrast-reversal at 7.5 Hz. (D) Grating acuity measured with on/off mode at 15 Hz. Dom, dominant eye; MAR, minimum angle of resolution; non-dom, nondominant eye.
Correlating sVEP and Psychophysical Acuities With Letter Acuity
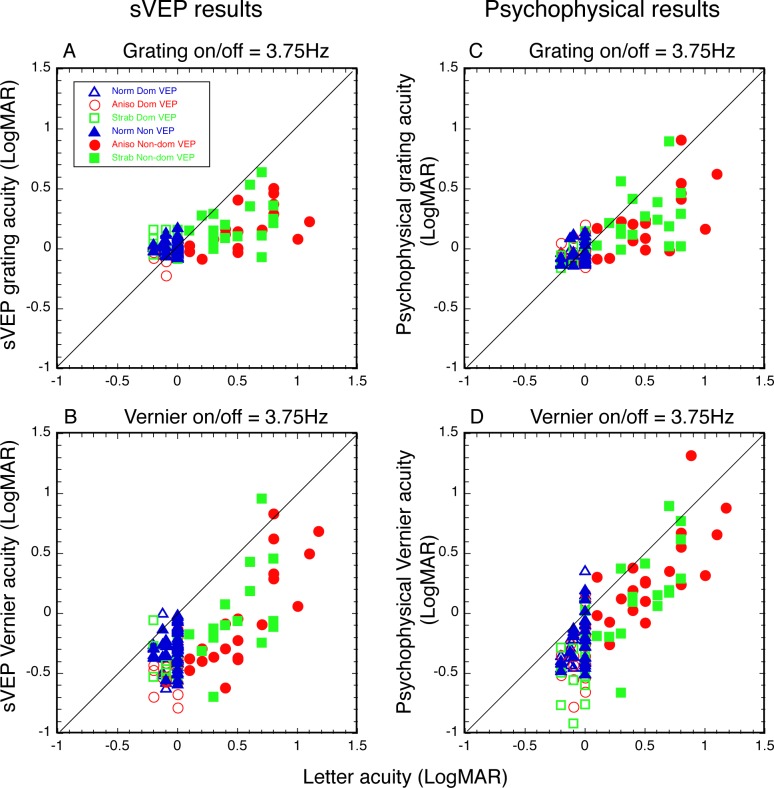
An important step in validating sVEP acuity for clinical use is to show whether sVEP measures are well correlated with letter acuity. To demonstrate this, we plotted sVEP grating acuity and Vernier acuity against letter acuity in Figures 3A and 3B, respectively. We also plotted psychophysical grating acuity and Vernier acuity against letter acuity in Figures 3C and 3D, respectively, in order to compare previous psychophysical study (see Ref. 8). Both sVEP and psychophysical grating acuity in Figure 3 were measured with 3.75 Hz at on/off modulation, which matched the temporal frequency and stimulus modulation used for the Vernier acuity measurement (Vernier displacement on/off at 3.75 Hz). To determine whether both sVEP Vernier and grating acuities are accurate reflections of the magnitude of letter acuity loss, we conducted regression analyses only in the amblyopic eyes, as they provide a wide range of acuities. In addition, Z-tests22,23 were conducted to determine whether there was a significant difference between Vernier and grating measures for predicting letter acuity for either sVEP or psychophysics. A summary of the statistical tests is shown in Table 3.
Figure 3.
Correlation of sVEP acuities and psychophysical acuities with letter acuity. Colors represent the groups: blue, normal vision controls; red, anisometropic amblyopes; green, strabismic amblyopes. Open symbols represent the dominant eye. Filled symbols present the nondominant eye. Solid lines: 1:1 ratio. (A) SVEP grating acuity and (B) Vernier acuity were compared with letter acuity. (C) Psychophysical grating acuity and (D) Vernier acuity were compared with letter acuity. Vernier acuity was measured with Vernier displacement, on/off, at 3.75 Hz. Grating acuity was measured with on/off modulation at 3.75 Hz.
As seen in Figure 3 and Table 3, both sVEP grating acuity (Fig. 3A, r = 0.45, P < 0.01) and sVEP Vernier acuity (Fig. 3B, r = 0.69, P < 0.0001) correlated significantly with letter acuity. However, when comparing with the slopes, sVEP Vernier acuity was a significantly better reflection of the magnitude of the letter acuity loss than sVEP grating acuity was (z-score = 3.45, P < 0.001). The slope of sVEP Vernier acuity was 0.98, compared to 0.30 for the slope of sVEP grating acuity. These results from the sVEP measurement were also consistent with those from the psychophysical measurements. Specifically, while both psychophysical grating acuity (Fig. 3C, r = 0.47, P < 0.01) and psychophysical Vernier acuity (Fig. 3D, r = 0.68, P < 0.0001) correlated significantly with letter acuity, the slope (0.91) of psychophysical Vernier acuity was also a significantly better estimate of letter acuity than the slope (0.43) of psychophysical grating acuity was (z-score = 2.18, P < 0.05). Our psychophysical grating and Vernier acuity measures in the amblyopic eyes were consistent with the findings from a previous psychophysical study with a large subject sample.8
We did not find correlation or slope differences between anisometropic and strabismic amblyopes for Vernier acuity and grating acuity, nor for both sVEP and psychophysical measurements.
Test and Retest Reliability for sVEP Grating Acuity Measurement
To assess the reliability of sVEP acuity measurements, we compared correlation coefficients of the sVEP and psychophysics for the grating acuities between different temporal frequencies and modulation types. The intercorrelations (r values) between the measurements were between 0.77 and 0.79 (P < 0.0001). Z-tests22,23 were conducted to determine whether there is significant difference between two different regressions (e.g., whether the correlation coefficients of the sVEP and psychophysical grating acuities for the 3.75 Hz on/off mode [Fig. 2B] are different from those of the 15 Hz on/off mode [Fig. 2D]). Z-test results are shown in Table 4. There were no significant differences in sVEP grating acuities with corresponding psychophysical grating acuities measured either by different temporal frequencies (3.75 Hz on/off versus 15 Hz on/off) or by different stimulus modulations (reversal versus on/off), as seen in Table 4 (P > 0.05 in each case). These results suggest that there is good test, retest reliability in sVEP acuity measurement.
Discussion
In this study, we systematically evaluated whether sVEP acuities measured in verbal subjects are accurate reflections of their psychophysical (perceptual) acuities for the sVEP stimuli and whether sVEP Vernier and grating acuities are comparable in predicting letter acuity, the gold standard visual acuity measurement in clinical practice. Our results demonstrated that the sVEP acuities were significantly correlated with the psychophysical acuities and that they bear a 1:1 relationship with each other in terms of their values. The acuities measured with both sVEP and psychophysics were also significantly correlated with letter acuities measured with a standard clinical letter acuity chart. Here the sVEP Vernier acuity had a 1:1 relationship with letter acuity, while sVEP grating acuity did not. The fact that the slopes of the regression lines between psychophysical and sVEP measures of both grating and Vernier acuity were ∼1 (see Table 2) indicates that the sVEP accurately reports stimulus visibility. By contrast, sVEP grating acuity overestimates letter acuity. These results suggest that overestimation of letter acuity by sVEP grating acuity is a property of grating acuity measurements in general and not sVEP measurements, in particular. That grating acuity overestimates letter acuity is well known psychophysically.8 The same is true for the sVEP. Because the slope of the regression line between sVEP Vernier acuity and letter acuity is ∼1 in our study, it should be better suited for objective measurement of visual acuity in pre- and nonverbal patients.
The discrepancy between Vernier acuity and grating acuity for detection of amblyopia found from our study and previous psychophysical study8 implies that grating acuity may not fully reveal amblyopic deficits. This discrepancy could be due to differences in neural processing, with grating acuity being primarily limited by retinal-striate cortex factors24 and Vernier acuity by both striate and extra-striate cortex factors (i.e., lateral occipital cortex, LOC).25 The conjecture that Vernier acuity may better reveal amblyopic deficits is supported by studies of amblyopic deficits on tasks thought to reflect extra-striate-function.26–30 Single neuron studies have also concluded that losses in cell responses in striate cortex appear to be insufficient to explain the magnitude of behaviorally measured deficits in amblyopia, suggesting that amblyopic effects also occur primarily in extra-striate cortex (see Ref. 31 for review). This suggestion is evident in a recent electrophysiologic study,28 in which the responses to stimuli that activate LOC were severely reduced in amblyopia. Therefore, Vernier acuity, processed in both striate and extra-striate cortex may more reliably represent the cortical deficits in amblyopia, compared to grating acuity.
In the current study, we evaluated the validity and reliability of sVEP Vernier and grating acuity for the detection of amblyopia in adults. Validity was assessed in two ways: first, by comparison of the sVEP acuity to the psychophysical acuity for the same stimuli; and second, by comparison of the sVEP acuities to the clinical gold standard of letter acuity. These evaluations were performed in verbal subjects who can reliably report their perceptual acuities. Reliability was assessed for grating acuity by comparing values obtained from the sVEP and psychophysics recorded with different temporal frequencies and modulation types. This approach provides a conservation estimate of test-retest reliability in that it includes both intrinsic reliability differences and (small) stimulus-related differences. Repeated sVEP grating acuity measures in the same participants revealed stable values, suggesting that sVEP acuity measurements are reliable. This finding suggests that “behavior-free” sVEP Vernier and grating acuity may be useful in objectively assessing visual acuity in pre- and nonverbal patients. The only requirement for the patients in the sVEP acuity measurement is to fixate on a large-field stimulus display.
Conclusions
The current study demonstrated that both sVEP Vernier and grating acuity tests were correlated with letter acuity. SVEP Vernier acuity more accurately reflected letter acuity, while sVEP grating acuity systematically overestimated letter acuity in the amblyopic eye. Therefore, sVEP Vernier acuity provides a better characterization of amblyopic acuity loss than does sVEP grating. SVEP Vernier and grating acuity tests can be performed without a behavioral response and thus have the potential to guide amblyopia diagnosis and therapy earlier than is currently possible with acuity tests that require verbal responses.
Acknowledgments
The authors thank Lisa Young, Vanitha Sampath, and Margaret Q. McGovern for the assistance in recruiting participants.
Supported in part by funds from the West China Hospital Foundation, National Institutes of Health Grant R01-EY025018 and the Children's Eye Foundation of the American Association for Pediatric Ophthalmology and Strabismus. Funding organizations had no role in the design or conduct of this research.
Disclosure: C. Hou, None; W.V. Good, None; A.M. Norcia, None
References
- 1. Ehrlich MI, Reinecke RD, Simons K. . Preschool vision screening for amblyopia and strabismus. Programs, methods, guidelines. Surv Ophthalmol. 1983; 28: 145– 163. [DOI] [PubMed] [Google Scholar]
- 2. Williams C, Northstone K, Howard M, Harvey I, Harrad RA, Sparrow JM. Prevalence and risk factors for common vision problems in children: data from the ALSPAC study. Br J Ophthalmol. 2008; 92: 959– 964. [DOI] [PubMed] [Google Scholar]
- 3. Epelbaum M, Milleret C, Buisseret P, Dufier JL. . The sensitive period for strabismic amblyopia in humans. Ophthalmology. 1993; 100: 323– 327. [DOI] [PubMed] [Google Scholar]
- 4. Laws D, Noonan CP, Ward A, Chandna A. . Binocular fixation pattern and visual acuity in children with strabismic amblyopia. J Pediatr Ophthalmol Strabismus. 2000; 37: 24– 28. [DOI] [PubMed] [Google Scholar]
- 5. Dobson V, Teller DY, Lee CP, Wade B. . A behavioral method for efficient screening of visual acuity in young infants. I. Preliminary laboratory development. Invest Ophthalmol Vis Sci. 1978; 17: 1142– 1150. [PubMed] [Google Scholar]
- 6. Lowery JP, Hayes JR, Sis M, Griffith A, Taylor D. . Pacific acuity test: testability, validity, and interobserver reliability. Optom Vis Sci. 2014; 91: 76– 85. [DOI] [PubMed] [Google Scholar]
- 7. Levi DM, Klein S. . Hyperacuity and amblyopia. Nature. 1982; 298: 268– 270. [DOI] [PubMed] [Google Scholar]
- 8. McKee SP, Levi DM, Movshon JA. . The pattern of visual deficits in amblyopia. J Vis. 2003; 3: 380– 405. [DOI] [PubMed] [Google Scholar]
- 9. Allen D, Tyler CW, Norcia AM. . Development of grating acuity and contrast sensitivity in the central and peripheral visual field of the human infant. Vision Res. 1996; 36: 1945– 1953. [DOI] [PubMed] [Google Scholar]
- 10. Skoczenski AM, Norcia AM. . Development of VEP Vernier acuity and grating acuity in human infants. Invest Ophthalmol Vis Sci. 1999; 40: 2411– 2417. [PubMed] [Google Scholar]
- 11. Good WV, Hou C, Norcia AM. . Spatial contrast sensitivity vision loss in children with cortical visual impairment. Invest Ophthalmol Vis Sci. 2012; 53: 7730– 7734. [DOI] [PMC free article] [PubMed] [Google Scholar]
- 12. Skoczenski AM, Good WV. . Vernier acuity is selectively affected in infants and children with cortical visual impairment. Dev Med Child Neurol. 2004; 46: 526– 532. [DOI] [PubMed] [Google Scholar]
- 13. Good WV, Hou C, Frieden IJ, Norcia AM. . Evidence for visual compromise in preverbal children with orbital vascular birthmarks. Am J Ophthalmol. 2009; 147: 679– 682.e671. [DOI] [PMC free article] [PubMed] [Google Scholar]
- 14. Hou C, Good WV, Norcia AM. . Validation study of VEP vernier acuity in normal-vision and amblyopic adults. Invest Ophthalmol Vis Sci. 2007; 48: 4070– 4078. [DOI] [PubMed] [Google Scholar]
- 15. Strasburger H, Murray I, Remky A. . Sustained and transient mechanisms in the steady-state visual evoked potential. Onset presentation compared to pattern reversal. Clin Vis Sci. 1993; 8: 211– 234. [Google Scholar]
- 16. Parry NR, Murray IJ, Hadjizenonos C. . Spatio-temporal tuning of VEPs: effect of mode of stimulation. Vision Res. 1999; 39: 3491– 3497. [DOI] [PubMed] [Google Scholar]
- 17. Strasburger H, Scheidler W, Rentschler I. . Amplitude and phase characteristics of the steady-state visual evoked potential. Appl Opt. 1988; 27: 1069– 1088. [DOI] [PubMed] [Google Scholar]
- 18. Nuwer MR, Comi G, Emerson R, Fuglsang-Frederiksen A,et al. . IFCN standards for digital recording of clinical EEG. The International Federation of Clinical Neurophysiology. Electroencephalogr Clin Neurophysiol Suppl. 1999; 52: 11– 14. [PubMed] [Google Scholar]
- 19. Hou C, Norcia AM, Madan A, Tith S, Agarwal R, Good WV. . Visual cortical function in very low birth weight infants without retinal or cerebral pathology. Invest Ophthalmol Vis Sci. 2011; 52: 9091– 9098. [DOI] [PMC free article] [PubMed] [Google Scholar]
- 20. Tang, Y, Norcia AM. An adaptive filter for steady-state evoked responses. Electroencephalogr Clin Neurophysiol. 1995; 96: 268– 277. [DOI] [PubMed] [Google Scholar]
- 21. Norcia AM, Tyler CW, Hamer RD, Wesemann W. . Measurement of spatial contrast sensitivity with the swept contrast VEP. Vision Res. 1989; 29: 627– 637. [DOI] [PubMed] [Google Scholar]
- 22. Clogg CC, Petkova, E., Haritou, A. . Statistical methods for comparing regression coefficients between models. American J Sociology. 1995; 100: 1261– 1293. [Google Scholar]
- 23. Paternoster R, Brame R, Mazerolle P, Piquero A. . Using the correct statistical test for equality of regression coefficients. Criminology. 1998; 36: 859– 866. [Google Scholar]
- 24. Levi DM, Klein SA. . Vernier acuity, crowding and amblyopia. Vision Res. 1985; 25: 979– 991. [DOI] [PubMed] [Google Scholar]
- 25. Hou C, Kim YJ, Verghese P. . Cortical sources of Vernier acuity in the human visual system: an EEG-source imaging study. J Vis. 2017; 17: 2. [DOI] [PMC free article] [PubMed] [Google Scholar]
- 26. Ho CS, Giaschi DE. . Deficient maximum motion displacement in amblyopia. Vision Res. 2006; 46: 4595– 4603. [DOI] [PubMed] [Google Scholar]
- 27. Hou C, Pettet MW, Norcia AM. . Abnormalities of coherent motion processing in strabismic amblyopia: Visual-evoked potential measurements. J Vis. 2008; 8: 2 1– 12. [DOI] [PMC free article] [PubMed] [Google Scholar]
- 28. Hou C, Pettet MW, Norcia AM. . Acuity-independent effects of visual deprivation on human visual cortex. Proc Natl Acad Sci U S A. 2014; 111: E3120– E3128. [DOI] [PMC free article] [PubMed] [Google Scholar]
- 29. Simmers AJ, Ledgeway T, Hess RF, McGraw PV. . Deficits to global motion processing in human amblyopia. Vision Res. 2003; 43: 729– 738. [DOI] [PubMed] [Google Scholar]
- 30. Sharma V, Levi DM, Klein SA. . Undercounting features and missing features: evidence for a high-level deficit in strabismic amblyopia. Nat Neurosci. 2000; 3: 496– 501. [DOI] [PubMed] [Google Scholar]
- 31. Kiorpes L. . Visual processing in amblyopia: animal studies. Strabismus. 2006; 14: 3– 10. [DOI] [PubMed] [Google Scholar]


