Abstract
Purpose
Prior studies suggested the use of customized perimetric locations in glaucoma; these studies were limited by imaging only the superficial depths of the retinal nerve fiber layer (RNFL) and by prolonged perimetric testing. We aimed to develop a rapid perimetric test guided by high-resolution images of RNFL bundles.
Methods
We recruited 10 patients with glaucoma, ages 56 to 80 years, median 68 years, and 10 controls, ages 55 to 77 years, median 68 years. The patients were selected based on discrepancies between locations of glaucomatous damage for perimetric and structural measures. Montaging was used to produce optical coherence tomography en face images of the RNFL covering much of the 24-2 grid locations. In experiment 1, we presented the Goldmann size III stimulus at preselected retinal locations of glaucomatous damage, using just two contrasts. In experiment 2, we developed an elongated sinusoidal stimulus, aligned within the defect, to measure contrast sensitivities; abnormalities were defined based on lower 95% reference limits derived from the controls.
Results
The percentage of predicted locations where size III was not seen at 28 dB ranged from 16% to 80%, with a median of 48%. Contrast sensitivity for the sinusoidal stimulus was below the 95% reference range for 37 of 44 stimuli aligned within the defects.
Conclusions
We developed methods for rapid perimetric testing guided by en face images of the RNFL bundles in patients with glaucoma. Results indicated ganglion cell damage under all of the visible RNFL defects.
Translational Relevance
Customized perimetric locations have potential to improve clinical assessment of glaucoma.
Keywords: glaucoma, optical coherence tomography, retinal nerve fiber bundles, perimetry
Introduction
Perimetry is widely used to measure functional loss in patients with glaucoma, but these measurements do not necessarily have good correspondence with structural loss viewed with imaging. This discordance between structural and functional measures poses clinical challenges for diagnosis and management of patients with glaucoma. One of the sources of discordance is related to the relatively large spacing between the visual field (VF) locations (which are 6° apart horizontally and vertically) on the standard testing grid.1–5 Prior studies demonstrated that perimetric tests with fixed grids did not show defects corresponding to the observed structural damage. These studies found that VF sampling could be improved by adding test locations guided by the structural data1,2,5 or functional3,4 data. Targeted perimetry has not been proposed to replace the 24-2 grid because perimetric defects may occur in regions of the VF with no corresponding structural damage.6 These studies were limited by a prolonged testing time for targeted perimetry. In order for targeted perimetry to be useful clinically, it must be rapid because it is an additional perimetric test.
There were several attempts to study the projections of the retinal nerve fiber (RNFL) bundles in control participants using fundus photographs and red-free fundus images with short wavelengths.7–10 These approaches, however, have their own limitations, such as the ability to visualize only superficial bundles in vivo and the variability resulting from the hand-tracing methods used.
Recently, improved in vivo imaging has made it possible to study the details of the projections of the RNFL bundles.11,12 En face views from optical coherence tomography (OCT) volume scans display images of RNFL bundles for a full range of depths below the inner limiting membrane (ILM). These images make it possible to follow the patterns of normal and damaged RNFL bundles as they project through the retina to the optic disc. Targeting retinal regions of damaged RNFL bundles with perimetric stimuli could improve perimetric correspondence with the structural loss and increase the confidence of clinicians when diagnosing and monitoring patients with glaucoma.
We aimed to develop a rapid perimetric exam that tests VF locations customized for each patient to correspond to regions of glaucomatous damage observed on en face images of the RNFL. This was an exploratory study conducted to assess proof of principle, in which a trained observer predicted regions of perimetric loss and these predictions were tested using customized perimetric locations. These results should help future studies develop clinically useful tests based on our findings.
RNFL bundles can contain axons from a wide range of retinal regions, so it is not obvious how to target perimetry based on en face RNFL images. We began with a pilot study to estimate the extent of perimetric damage compared to images, and then based on those findings, a trained observer learned how to make predictions for the primary study.
Methods
Participants
We recruited 20 participants, 10 patients with primary open-angle glaucoma and 10 age-similar controls. The age range for patients was 56 to 80 years, with a median of 68 years, and for control participants was 55 to 77 years, with a median of 68 years. Patients were selected from an ongoing glaucoma research project in our lab, based on glaucomatous damage observed on the OCT en face images of the RNFL bundles being greater than perimetric defects measured by the Humphrey Field Analyzer (HFA) using the 24-2 test pattern. The perimetric and structural losses in our patients were consistent with the definition of glaucoma, which is given in detail elsewhere.13 Informed consent was obtained for each participant before the testing sessions. The protocol for this study adhered to the tenets of the Declaration of Helsinki. Institutional review board approval was obtained at Indiana University.
Inclusion Criteria
Common inclusion criteria for both patients and age-similar control participants were a comprehensive eye examination within the last 3 years; best-corrected visual acuity better than or equal to 20/20, except for those older than 70 years for whom 20/30 was acceptable; no history of ocular disease except glaucoma; no history of eye surgery other than uncomplicated cataract surgery or glaucoma surgery; spherical equivalent of +3.0 to −6.0 diopters and cylindrical correction ≤3.0 diopters; and clear ocular media. Additional inclusion criteria for control participants were a normal cup-to-disc ratio and open anterior chamber angles as determined in the clinic charts.
Exclusion Criteria
For both patients with glaucoma and age-similar control participants, we excluded participants with diabetic retinopathy, prior vein occlusion, degenerative myopia, macular degeneration, and amblyopia. We also excluded participants having peripheral anterior synechiae, using medications that affect visual function, having epiretinal membrane advanced enough to prevent visualizing RNFL bundles, having abnormal optic disc or VF due to neurological disorders such as stroke or postchiasmatic disorders, or being difficult to image due to poor fixation. Additional exclusion criteria in control participants were IOP > 21 mm Hg for the last clinic visit or a glaucomatous appearance to the optic nerve head.
Equipment
Spectralis OCT
En face images of RNFL bundles were gathered using OCT (Spectralis OCT V. 6.0; Heidelberg Engineering, Heidelberg, Germany). We used dense vertical B-scans separated by 30 μm, composing four different rectangles. The first rectangle's width and height was 25° × 20°, and the temporal fixation target was used so that the operator placed the rectangle temporal to the fovea. The second and third scans were each designed to cover a retinal area of 10° × 20°. These scans were designed to image superior and inferior macular regions by using fixation targets above and below the fovea. The fourth scan covered a 15° × 30° rectangle that was centered on the optic disc, using the nasal fixation target. Participants' eyes were dilated to allow rapid OCT measurements. We applied this protocol to obtain en face RNFL images corresponding to much of the VF area tested within the central 30° of the retina.
The volume scans were exported from the Spectralis OCT and read by a custom MATLAB software program (Mathworks Inc., Natwick, MA), that was developed by our lab. This custom program was used to montage volume scans for different regions of the retina into a single volume scan and provided en face images at different depths from the ILM. Montages at different depths are shown in Figure 1. These montages were obtained by rotating and translating images to align the blood vessels; no magnification or warping was used.
Figure 1.
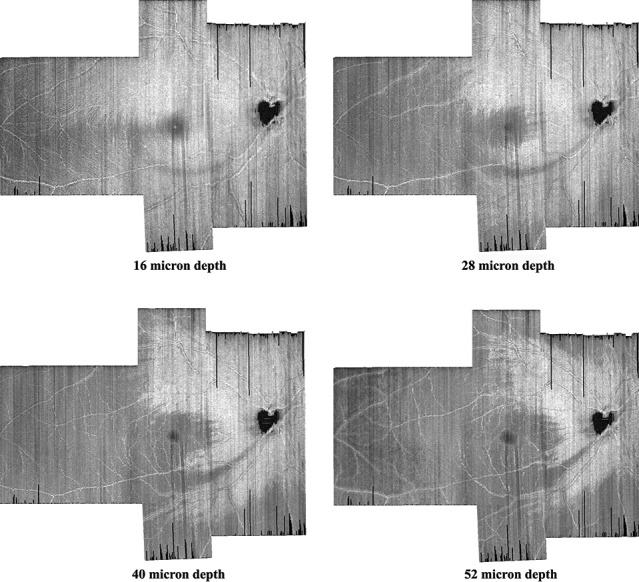
Four montages of en face images from vertical dense scans of one patient with glaucoma. We increased the distance from the ILM to better visualize the shape and width of the glaucomatous damage to the RNFL. The RNFL damage appears as a gray arc that begins at the bottom of the optic disc and at 16 μm follows an arc to the temporal side of the macula. At greater depths, this becomes darker and wider.
Perimetry
Details for the customized perimetry station that we used have been described previously.13 In brief, we used a cathode-ray tube (CRT) system, controlled by a visual stimulus generator (ViSaGe; Cambridge Research Systems, Ltd., Rochester, Kent, UK) with a screen resolution of 800 × 600 pixels subtending 51° × 42° of visual angle. To present the customized stimuli, the system was controlled by a custom MATLAB program. The background luminance was 20 cd/m2 and the maximum stimulus luminance was 100 cd/m2. There was a motorized headrest to control participants' head position. A camera was attached to the testing station to monitor fixation. Also, a lens holder was centered in front of the screen at a distance of 33 cm; the participant's spherical equivalent correction for this distance was used for the perimetric testing.
Study Design
Pilot Study
Because damaged RNFL may reflect damage to ganglion cells from a wide range of locations, a pilot study was conducted to train a clinician (author MSA) to predict perimetric loss. First, in order to appreciate the normal variability in RNFL structure, the clinician reviewed en face RNFL montages at depths 4 to 160 μm from the ILM from more than 50 people free of eye disease, ages 20 to 85 years. The clinician also reviewed montages from 30 patients with glaucoma and compared these with 24-2 perimetric defects superimposed on the RNFL montages. The VF locations were aligned with the en face images by aligning fixation on perimetry with the foveal location on the montage. To assess whether effects of head tilt or cyclorotation were substantial, we also compared the location of the blind spot during perimetry with the location of the optic nerve in the montage. When we constructed the montages, we kept the images in units of the degrees of visual angle in order to match the VF locations with retinal locations.
Five patients with glaucoma were chosen based on the discordance observed between the RNFL en face images and VF defects with the 24-2. These patients had participated in our studies for many years, and the discordance was consistently repeated. Each patient was invited to participate in a 1-hour visit to the lab. After visual acuity and Pelli-Robson contrast sensitivity were checked, the patient was tested with targeted perimetry. For the rest of the hour, the patient underwent perimetry and imaging for other studies.
Size III Stimulus
For each patient, the trained observer selected 40 to 60 VF locations for testing with size III within the retinal region with RNFL defect(s). The perimetric locations were chosen to follow the low-reflectance regions of the RNFL because we hypothesized that the low reflectance was caused by glaucomatous insult. Locations were placed at least 0.5° apart. Perimetric locations were selected to be within the RNFL defects at superficial and deep depths of the RNFL. First, superficial depths of the RNFL (as deep as ∼24 μm from the ILM) were used to visualize the RNFL damage at the temporal raphe. Greater depths were used to visualize RNFL damage where the RNFL is highly packed around the macula. Locations predicted to have defects were placed inside and just outside the regions of RNFL damage, while locations predicted to not have defects were placed at areas adjacent to the RNFL damage. This was done to determine whether or not the perimetric defect was wider than the damage we observe on the en face images.
Testing with the size III stimulus (a 0.4° circular luminance increment) used two contrast levels in two separate tests, 100% and 50% Weber contrast. These correspond to 25 and 28 dB, respectively, on the HFA.14 These two contrast levels were used to compensate for differences in the height of the hill of vision15 100% contrast would be appropriate for those with a low hill of vision and 50% contrast for a high hill of vision. For each contrast level, one presentation of the stimulus was made at each location, selected randomly.
Sinusoidal Stimulus
The trained observer selected two to four VF locations (depending on whether RNFL damage was on both the superior and inferior retina) within damaged RNFL regions for testing with a much larger sinusoidal stimulus that was aligned with the defect.
Testing with the sinusoidal stimulus used the elongated derivative of Gaussian stimulus16 shown in Figure 2; peak spatial frequency was 1.0 cycle per degree (cpd), and an orthogonal Gaussian window had a standard deviation of 0.71°. This choice of stimulus spatial frequency was used as a trade-off between the stimulus being high enough to fit within narrow defects and low enough to resist effects of astigmatism and peripheral defocus.17 Temporal presentation was three cycles of 5-Hz counterphase flicker. We used a ZEST algorithm18,19 to measure contrast sensitivity in which the order of tested perimetric locations was randomized across trials. This algorithm used six presentations at each customized retinal location.19
Figure 2.
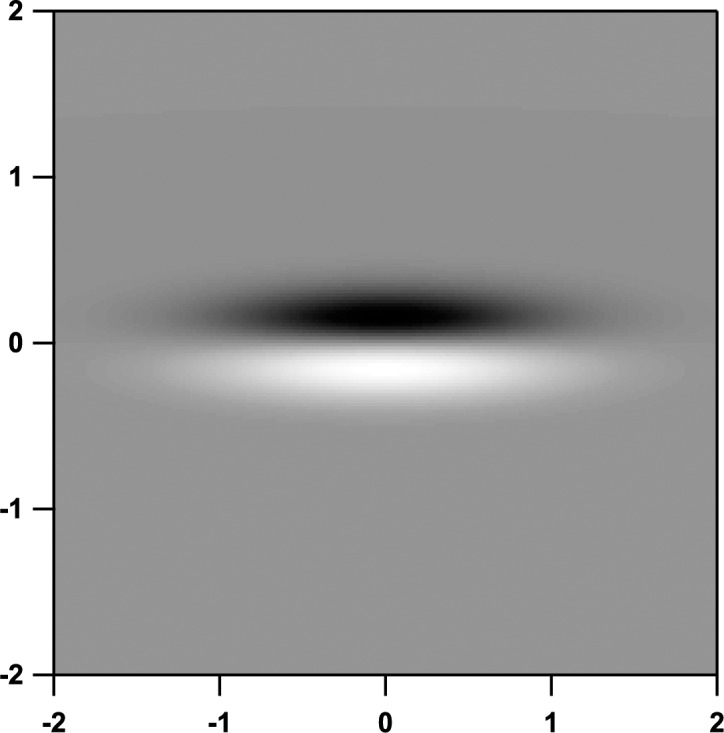
The elongated sinusoidal stimulus used for threshold testing. Axes indicate the distance in degrees of visual angle from the center of the stimulus.
The sinusoidal stimulus was oriented with the RNFL defect. For a potential within-subject control for variations in the height of the hill of vision, the stimulus was also presented with an orthogonal orientation to determine whether aligning the stimulus with the defect yielded a deeper defect. To assess accuracy in finding the center of the defect, another two locations were chosen above and below the primary stimulus, referred to as the “upper” and “lower” stimuli. Both oriented and orthogonal stimuli were presented at each location. These locations were separated from the primary location by 1° (up or down) on the y-axis for the same x location.
Results of Pilot Study
This pilot study found that patients with glaucoma often did not respond to the size III stimulus for most of the VF locations corresponding to RNFL defects seen on the en face images. Perimetric defects were more extensive than the trained observer had originally expected based on review of the 24-2 results; thus in the main study, a larger number of locations were selected for testing with size III. For the sinusoidal stimulus, there was substantial within-subject and between-subject variability; thus, for the main study, there were repeat visits and recruitment of control subjects.
Main Study
The five patients with glaucoma from the pilot study were invited to participate in three further study visits, as were five more patients with glaucoma, selected in the same manner, and 10 age-similar control subjects. The visits were separated by at least 24 hours and no more than 3 weeks. At each study visit, visual acuity and Pelli-Robson contrast sensitivity were measured, and then perimetry was conducted with the size III stimulus and with the sinusoidal stimulus. For the patients with glaucoma, testing with the size III stimulus was performed on the first two visits. For all subjects, testing with the sinusoidal stimulus was performed on all three visits. The remainder of each visit included perimetry and/or imaging for other studies.
Size III Stimulus
For the size III stimulus, we employed the suprathreshold strategy described above, using Weber contrasts of 50% and 100%. Based on the pilot data, in order to better assess the extent of the perimetric loss, we presented stimuli at extra locations adjacent to the regions of glaucomatous damage as seen on the en face images. This resulted in two groups of locations: those at which it was predicted that the stimulus would not be seen and those at which it was predicted that the stimulus would be seen. The number of perimetric locations tested ranged from 70 to 98, with a median of 80 across all patients. Each location was tested with a single stimulus presentation for a given contrast. For each contrast level, half of locations were tested in one session and half in a second. Therefore, for a given visit there were a total of four perimetric tests with the suprathreshold strategy.
For each patient, visit, and stimulus contrast, we calculated the percentage of true positives: perimetric locations that had been predicted to have defects and for which the patient did not respond to the size III stimulus. We also calculated the percentage of true negatives: perimetric locations that had been predicted to have no defects and for which the patient did respond to the size III stimulus. These percentages were compared for the two visits (visit 2 minus visit 1), to assess repeatability of the findings. For remaining analyses, the results for the two visits were averaged to give a single percentage.
To assess whether or not our choice of a 2-fold difference in the two contrast levels was appropriate for the size III stimulus, we compared the true positive and true negative rates using 50% vs. 100% contrast levels. A sign test for matched pairs was used for this comparison, with the prediction that more locations would be seen with 100% contrast than with 50% contrast.
Sinusoidal Stimulus
The sinusoidal stimulus described above and shown in Figure 2 was used to measure contrast sensitivity employing the ZEST algorithm mentioned above. For the patients with glaucoma, three to six locations were identified based on the pattern and extent of RNFL damage. As described above, for each selected location there were also two additional locations 1° above and below, and at all three locations, both oriented and orthogonal stimuli were presented.
For the control subjects, the goal was to obtain reference limits for identifying defects in the patient data. All control participants were tested with a perimetric grid that we created to include all of the perimetric locations that we had selected to be presented to the patients. If a group of locations was separated by 1° or less in x and y values, then the average of these locations was used. This grid contained 76 locations, so we divided the examination into four sessions to reduce the effect of fatigue; we presented 18 locations in session 1, 20 locations in sessions 2 and 3, and 18 locations in session 4. At each location, both orientations of the stimulus were used, for a total of 152 contrast sensitivities.
The primary analysis tested two hypotheses regarding the centered stimuli, whereas a secondary analysis was used to evaluate results for the upper and lower stimuli. For the two hypotheses, we used a 1-tailed two-proportion z-test to assess the difference between patient and control groups; the significance level was set at P < 0.025 after Bonferroni correction. Each proportion was calculated as the number of locations with abnormal contrast sensitivity divided by the total number of tested locations. To reduce the effect of test-retest variability, we calculated the average of the contrast sensitivities for the three visits.
The first hypothesis was that there would be abnormal contrast sensitivities for the stimulus oriented within the RNFL defects in patients with glaucoma. Abnormality was defined based on the values from age-similar control participants using the same stimulus orientation and similar locations. An abnormal contrast sensitivity was defined as a sensitivity that fell below the 95% reference range derived from the contrast sensitivities that we found in the control participants. We assumed a Gaussian distribution for which 2.5% of contrast sensitivity values from the age-similar controls are expected to fall below the 95% reference range.
The second hypothesis was that, for the centered stimulus, contrast sensitivity would be lower when the stimulus was aligned with the defect than when the stimulus was orthogonally presented. Abnormality was defined as in the first hypothesis: values outside the 95% reference range for orientation differences. For the primary analysis, we compared proportions of abnormal differences in contrast sensitivity for the oriented and the orthogonal stimuli.
A secondary analysis was of the proportion of locations with abnormal contrast sensitivity for the upper and lower stimuli. The same definition of abnormality was applied as for the first hypothesis.
Results
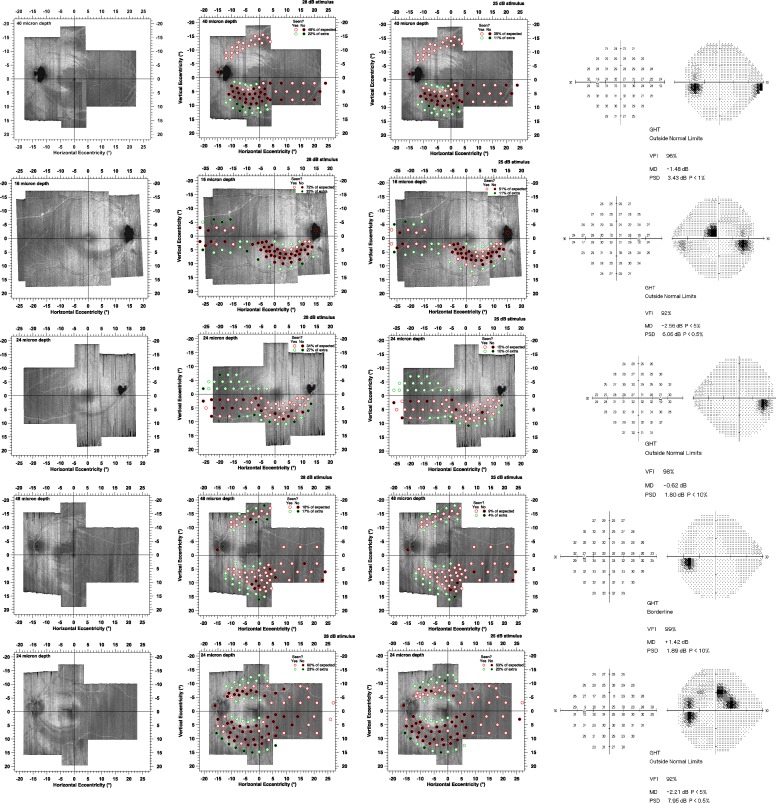
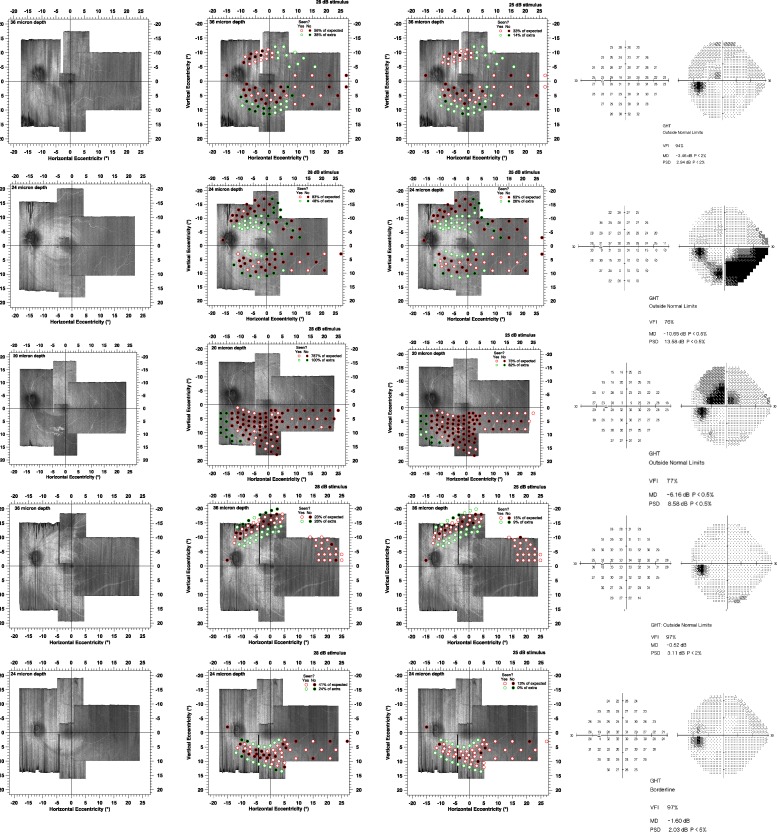
Figure 3 shows results for the size III stimulus. Test-retest for the true positive rates had mean (SD) 4.4% (8.1%) for 50% contrast and 5.0% (6.5%) for 100% contrast. For all 10 patients, the mean true positive rates were higher for 50% contrast than for 100% contrast; the sign test reached statistical significance (10 of 10, P < 0.001). Mean true positive rates ranged from 16% to 80% (median 48%) for 50% contrast (Fig. 3, middle column) and from 8% to 74% (median 31%) for 100% contrast (Fig. 3, right column). Test-retest for the true negative rates had mean (SD) −2.2% (12.2%) for 50% contrast and 2.7% (12.4%) for 100% contrast. Mean true negative rates ranged from 0% to 85% (median 74%) for 50% contrast and from 14% to 98% (median 90%) for 100% contrast.
Figure 3.
Results of the suprathreshold strategy for the 10 patients. Circles with red edges indicate the locations of predicted perimetric defects, and circles with green edges indicate perimetric locations predicted to not have defects. Black circles represent locations for which patients did not respond, and white circles represent locations where they did respond. Left panel shows the en face images without perimetric locations superimposed, middle panel represents results for 50% contrast, and right panel shows results for 100% contrast.
Figure 3.
Continued
Figure 4 shows results for the experiment with the sinusoidal stimulus oriented with the defect. We found that 37 of 44 contrast sensitivities fell below the 95% reference range derived from Gaussian analysis of data from the age-similar control participants, and only 5 of 380 contrast sensitivities from the age-similar control participants fell below. Every patient had at least two locations with contrast sensitivity below the reference limit. The overall proportion of locations with contrast sensitivity below the reference limit was 0.84 in patients and 0.01 in control participants, a difference of 0.83 (P < 0.001).
Figure 4.
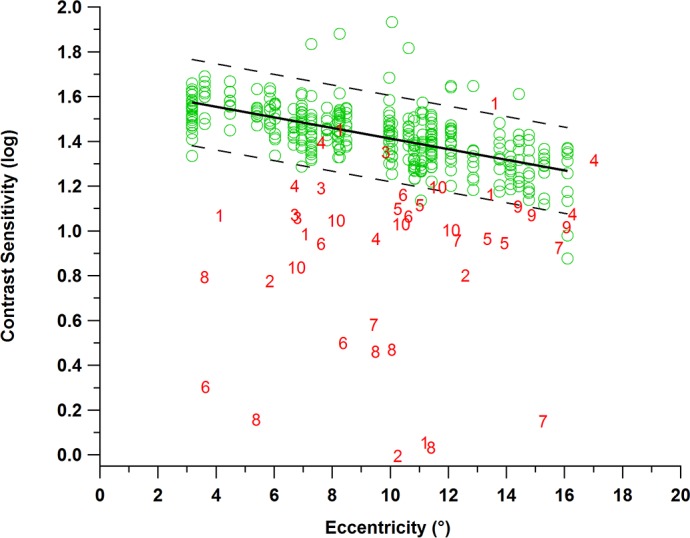
Results from the second experiment with the sinusoidal stimulus for age-similar controls (green circles) and for patients with glaucoma (red numbers). Contrast sensitivity in log units is indicated on the y-axis as a function of eccentricity on the x-axis. Green circles represent contrast sensitivities for the age-similar control participants, bold black line indicates the mean, and dashed black lines represent the upper and lower limits of the 95% reference range. Red numbers represent contrast sensitivities for the patients; most of these fell below the 95% reference range.
Figure 5 shows the difference in contrast sensitivities for the oriented and orthogonal stimuli, which for most controls and patients was within ±0.2 log unit. The orthogonal stimuli showed only 14 of 44 locations falling below the 95% reference range. For the age-similar control participants, there were 12 of 380 locations with orthogonal presentations that fell below the 95% reference range. The proportion of locations with abnormal differences was 0.32 in patients and 0.04 in control participants, a difference of 0.28 (P < 0.001).
Figure 5.
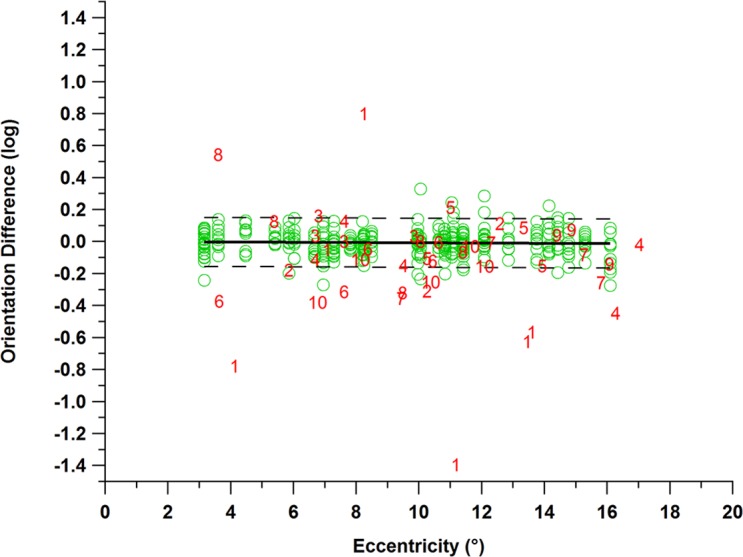
Results for the second hypothesis regarding orientation differences for age-similar controls (green circles) and for patients with glaucoma (red numbers). Dashed lines show the upper and lower limits of the 95% reference range, and the bold line represents the mean. It can be observed that 14 of 44 locations had abnormal orientation differences in patients with glaucoma (red numbers).
Similar results were obtained with stimulus locations 1° above and below the chosen location. Out of 44 locations, there were 33 (above) and 30 (below) contrast sensitivities below the reference range, with proportions of 0.75 and 0.68, respectively.
Discussion
This was an exploratory study that found that retinal regions with RNFL damage on en face imaging also had perimetric defects. This was surprising because the RNFL at a given retinal location contains axons from distant retinal ganglion cells as well as from the retinal ganglion cells underlying it. If this finding is confirmed in further studies, it will both provide a basis for targeted perimetry and give insight into the pathophysiology of the disease.
The first line of evidence for the extent of damage was taken from testing with the size III stimulus, which is the conventional perimetric stimulus, but in our case was presented on a CRT. These small stimuli are useful for locating the edges of defects, but due to their small size are not efficient for measuring contrast sensitivity across a wide number of locations. Therefore, we used a suprathreshold approach and found evidence of damaged ganglion cells under all of the damaged RNFLs seen in our montages. Test-retest similarities in the extent of damage strengthened this evidence.
The second line of evidence was from testing with the much larger sinusoidal stimulus, which was designed to be elongated so that it could fit within an RNFL defect. As expected from the suprathreshold testing with size III, contrast sensitivity was abnormally low at almost all locations we tested. Similar results were obtained with stimuli placed 1° vertically above and below the central stimulus. This is strong evidence that in these patients there was ganglion cell damage in most retinal locations where RNFL damage was seen.
These results confirmed and extended findings from prior studies that RNFL images can be used to guide targeted perimetry.1,2 There was considerable between-subject variability in the extent of damage found with the size III stimulus and in the depth of defect measured with the sinusoidal stimulus. A larger study with many more patients would be necessary to determine the causes of this variability.
We had to select the appropriate distance from the ILM for each patient in order to define the width and shape of the damage to the RNFL; the range of distances we used was from 16 to 48 μm from the ILM. Our choice of the depth for the OCT en face images was based on the best view of the damage as we increased the depth through the RNFL. Some of the variability our findings may be due to the choice of which depth to use to guide targeted perimetry.
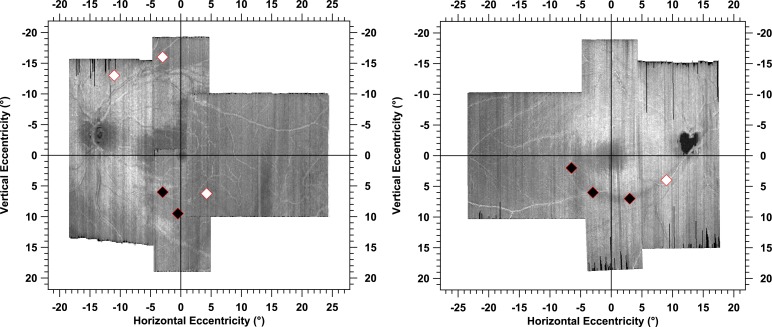
The pattern of perimetric defects derived with the size III stimulus followed, in general, the path of damaged RNFL bundles to the optic disc. This finding indicates that locations with perimetric defects corresponded well with retinal regions of glaucomatous damage to the RNFL, which potentially supports our approach to increase clinicians' confidence when diagnosing and managing patients with glaucoma. There were two patients who responded to stimuli at most of the locations (third and fourth rows in Fig. 3) in which the pattern of perimetric defects did not correspond as well to retinal regions of the glaucomatous damage to RNFL. These two patients had mean deviations of −0.8 and +1.4 dB, respectively, and narrow RNFL defects. Contrast sensitivity for the sinusoidal stimulus was reduced at some locations in these patients, as seen in Figures 4 and 6.
Figure 6.
Two examples of the primary stimulus locations (diamond symbols) for the sinusoidal stimulus that we selected to target the glaucomatous damage to the RNFL. The black diamonds indicate that contrast sensitivities to the oriented stimuli were below the 95% reference range and the white diamonds indicate that contrast sensitivity was not below the reference range. These two patients (patients 3 and 4) responded at all but a few locations using the suprathreshold strategy (see Fig. 3, third and fourth rows), yet had abnormal contrast sensitivity for the sinusoidal stimulus at similar locations.
We chose fixed contrast levels at all locations, rather than varying contrast across locations, to avoid effects of variability in the shape of the hill of vision between participants.20 In eyes free of disease, the sensitivity to size III declines monotonically with eccentricity, although the pattern of the decline varies across people and across meridians, and for small stimuli, shadows of the blood vessels can cause angioscotomas.21 Localized glaucomatous defects cause a nonmonotonic hill of vision.
We designed an elongated sinusoidal stimulus to measure sensitivity over a large area with glaucomatous damage so that we could use only a few locations with this stimulus in order to keep test duration relatively brief. For size III suprathreshold testing, the average test duration was 2:37 (minute:second) for 50% contrast (range, 2:08–3:37) and 2:31 for 100% contrast (range, 2:06–3:14). For the sinusoidal stimulus, the average test duration was 5:27 (range, 3:23–7:09) for patients and 5:10 (range, 4:33–5:47) for control participants.
As can be observed in Figure 4, a few patients had locations corresponding to RNFL defects, yet had contrast sensitivities similar to control participants. We interpreted this as meaning that these patients either had a high hill of vision or had mild perimetric loss resulting from subtle glaucomatous damage. It is also possible that there might have been eye movements during the test or that the stimulus was presented at the edge of the glaucomatous damage, thus was presented at a retinal region that was healthier than the location we intended to target. Another possible explanation is that the locations we targeted still had remaining ganglion cells, but we were not able to observe their bundles due to the limited resolution. It has been reported that the reflectance from the RNFL bundles is approximately two times brighter than the surrounding tissues.22 This means that a reduction to about half of the normal RNFL bundle reflectance does not necessarily represent total loss of the RNFL bundles. Therefore, there might have been remaining RNFL bundles whose ganglion cells mediated the contrast sensitivities.
Because we used a peak spatial frequency of 1 cpd for the sinusoidal stimulus, we expected, in people free of eye disease, very little effect of orientation23 on contrast sensitivity. We hypothesized that there would be a considerable orientation effect on the contrast sensitivity in patients with glaucoma. There was a statistically significant difference between proportions of abnormal differences in sensitivities to the oriented and orthogonal stimuli in patients, but the difference in contrast sensitivities between the oriented and orthogonal stimuli did not identify as many defects (Fig. 5) as did contrast sensitivity to the oriented stimulus alone (Fig. 4). One explanation for this could be that the extent of damage was so great that contrast sensitivity was reduced for both orientations. In any event, the proposal of a within-subject control was not justified by these data.
In summary, we found functional defects wherever we saw RNFL damage, a finding that, if confirmed, has the potential to lead to clinically useful targeted perimetry that could increase confidence for clinicians when diagnosing and managing patients with glaucomatous damage. Further research is warranted to improve and apply the approach we developed.
Acknowledgments
We thank Douglas G. Horner for his useful comments regarding revision of the manuscript for clarity.
Supported by National Institutes of Health Grants NIH R01EY024542 and 5P30EY019008.
Disclosure: M.S. Alluwimi, None; W.H. Swanson, Heidelberg Engineering (C), Carl Zeiss Meditec (C); V.E. Malinovsky, None; B.J. King, None
References
- 1. Orzalesi N, Miglior S, Lonati C, Rosetti L. . Microperimetry of localized retinal nerve fiber layer defects. Vision Res. 1998; 38: 763– 771. [DOI] [PubMed] [Google Scholar]
- 2. Schiefer U, Malsam A, Flad M,et al. Evaluation of glaucomatous visual field loss with locally condensed grids using fundus-oriented perimetry (FOP). Eur J Ophthalmol. 2001; 11 suppl 2: S57– 62. [DOI] [PubMed] [Google Scholar]
- 3. Westcott MC, Garway-Heath DF, Fitzke FW, Kamal D, Hitchings RA. . Use of high spatial resolution perimetry to identify scotomata not apparent with conventional perimetry in the nasal field of glaucomatous subjects. Br J Ophthalmol. 2002; 86: 761– 766. [DOI] [PMC free article] [PubMed] [Google Scholar]
- 4. Schiefer U, Papageorgiou E, Sample PA,et al. Spatial pattern of glaucomatous visual field loss obtained with regionally condensed stimulus arrangements. Invest Ophthalmol Vis Sci. 2010; 51: 5685– 5689. [DOI] [PMC free article] [PubMed] [Google Scholar]
- 5. Hood DC, Nguyen M, Ehrlich AC,et al. A test of a model of glaucomatous damage of the macula with high-density perimetry: implications for the locations of visual field test points. Transl Vis Sci Technol. 2014; 3 3: 5. [DOI] [PMC free article] [PubMed] [Google Scholar]
- 6. Ashimatey BS, Swanson WH. . Between-subject variability in healthy eyes as a primary source of structural-functional discordance in patients with glaucoma. Invest Ophthalmol Vis Sci. 2016; 57: 502– 507. [DOI] [PMC free article] [PubMed] [Google Scholar]
- 7. Airaksinen PJ, Doro S, Veijola J. . Conformal geometry of the retinal nerve fiber layer. Proc Natl Acad Sci U S A. 2008; 105: 19690– 19695. [DOI] [PMC free article] [PubMed] [Google Scholar]
- 8. Jansonius NM, Schiefer J, Nevalainen J, Paetzold J, Schiefer U. . A mathematical model for describing the retinal nerve fiber bundle trajectories in the human eye: average course, variability, and influence of refraction, optic disc size and optic disc position. Exp Eye Res. 2012; 105: 70– 78. [DOI] [PubMed] [Google Scholar]
- 9. Lamparter J, Russell RA, Zhu H,et al. The influence of intersubject variability in ocular anatomical variables on the mapping of retinal locations to the retinal nerve fiber layer and optic nerve head. Invest Ophthalmol Vis Sci. 2013; 54: 6074– 6082. [DOI] [PubMed] [Google Scholar]
- 10. Denniss J, Turpin A, Tanabe F, Matsumoto C, McKendrick AM. . Structure-function mapping: variability and conviction in tracing retinal nerve fiber bundles and comparison to a computational model. Invest Ophthalmol Vis Sci. 2014; 55: 728– 736. [DOI] [PubMed] [Google Scholar]
- 11. Huang G, Gast TJ, Burns SA. . In vivo adaptive optics imaging of the temporal raphe and its relationship to the optic disc and fovea in the human retina. Invest Ophthalmol Vis Sci. 2014; 55: 5952– 5961. [DOI] [PMC free article] [PubMed] [Google Scholar]
- 12. Chauhan BC, Sharpe GP, Hutchison DM. . Imaging of the temporal raphe with optical coherence tomography. Ophthalmology. 2014; 121: 2287– 2288. [DOI] [PubMed] [Google Scholar]
- 13. Swanson WH, Malinovsky VE, Dul MW,et al. Contrast sensitivity perimetry and clinical measures of glaucomatous damage. Optom Vis Sci. 2014; 91: 1302– 1311. [DOI] [PMC free article] [PubMed] [Google Scholar]
- 14. Sun H, Dul MW, Swanson WH. . Linearity can account for the similarity among conventional, frequency-doubling, and gabor-based perimetric tests in the glaucomatous macula. Optom Vis Sci. 2006; 83: 455– 465. [DOI] [PMC free article] [PubMed] [Google Scholar]
- 15. Marin-Franch I, Swanson WH, Malinovsky VE. . A novel strategy for the estimation of the general height of the visual field in patients with glaucoma. Graefes Arch Clin Exp. 2014; 252: 801– 809. [DOI] [PMC free article] [PubMed] [Google Scholar]
- 16. Swanson WH, Wilson HR, Giese SC. . Contrast matching data predicted from contrast increment thresholds. Vision Res. 1984; 24: 63– 75. [DOI] [PubMed] [Google Scholar]
- 17. Horner DG, Dul MW, Swanson WH, Liu T, Tran I. . Blur-resistant perimetric stimuli. Optom Vis Sci. 2013; 90: 466– 474. [DOI] [PMC free article] [PubMed] [Google Scholar]
- 18. King-Smith PE, Grigsby SS, Vingrys AJ, Benes SC, Supowit A. . Efficient and unbiased modifications of the QUEST threshold method: theory, simulations, experimental evaluation and practical implementation. Vision Res. 1994; 34: 885– 912. [DOI] [PubMed] [Google Scholar]
- 19. Swanson WH, Horner DG, Dul MW, Malinovsky VE. . Choice of stimulus range and size can reduce test-retest variability in glaucomatous visual field defects. Transl Vis Sci Technol. 2014; 3: 6. [DOI] [PMC free article] [PubMed] [Google Scholar]
- 20. Swanson WH, Dul MW, Horner DG, Malinovsky VE. . Individual differences in the shape of the nasal visual field. Vision Res. 2017; 141: 23– 29. [DOI] [PMC free article] [PubMed] [Google Scholar]
- 21. Schiefer U, Benda N, Dietrich TJ, Selig B, Hofmann C, Schiller J. . Angioscotoma detection with fundus-oriented perimetry. A study with dark and bright stimuli of different sizes. Vision Res. 1999; 39: 1897– 1909. [DOI] [PubMed] [Google Scholar]
- 22. Kocaoglu OP, Cense B, Jonnal RS,et al. Imaging retinal nerve fiber bundles using optical coherence tomography with adaptive optics. Vision Res. 2011; 51: 1835– 1844. [DOI] [PMC free article] [PubMed] [Google Scholar]
- 23. Campbell FW, Kulikowski JJ, Levinson J. . The effect of orientation on the visual resolution of gratings. J Physiol. 1966; 187: 427– 436. [DOI] [PMC free article] [PubMed] [Google Scholar]


