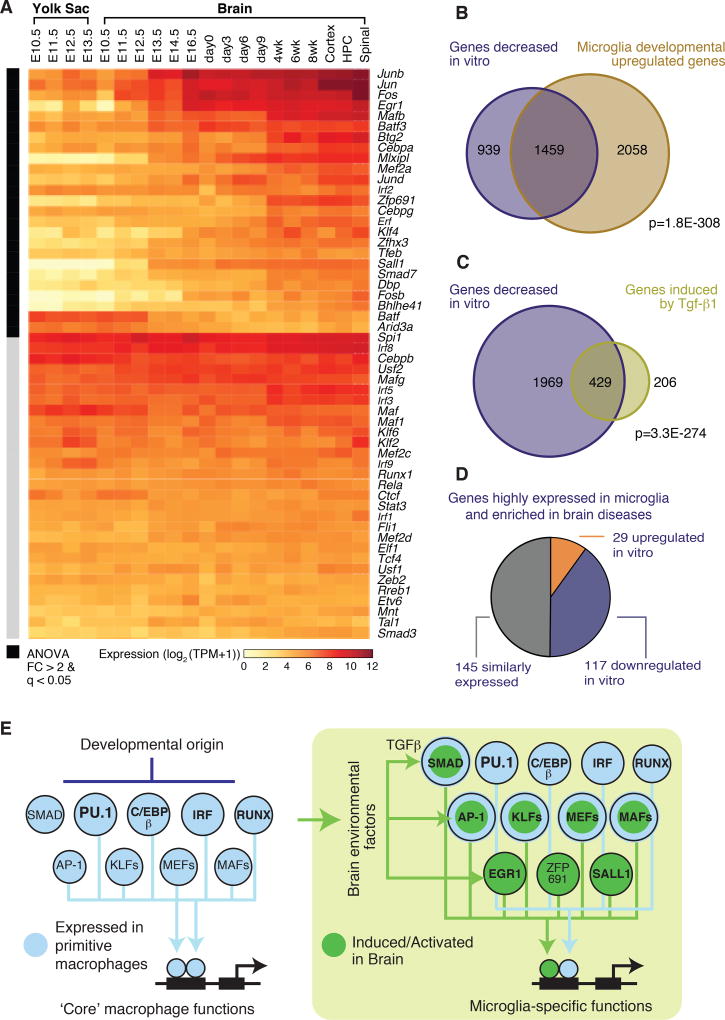
Figure 6. A network of developmentally programmed and environment-dependent transcription factors establishes microglia identity and function.
(A) Heat map displaying changes in mRNA expression of key microglia transcription as a function of development of the mouse brain. (B) Venn diagram illustrating significant overlap of mouse microglia genes repressed (> 2-fold, FDR 0.05) in culture and genes that increased (> 2-fold, FDR 0.05) in expression during brain development. p-value of the overlap is provided (Fisher’s exact test). (C) Venn diagram illustrating significant overlap of mouse microglia genes repressed (> 2-fold, FDR 0.05) in culture after 7 days and genes maintained/induced (> 2-fold, FDR 0.05) by chronic stimulation with Tgf-β1. p-value of the overlap is provided (Fisher’s exact test). (D) Pie chart of microglia-enriched genes compared to brain cortex overlapping with differentially expressed genes in neurodegenerative or behavioral diseases from Fig. 1C color-coded according to whether they are increased, decreased or unchanged after transfer to a tissue culture environment. (E) Diagram illustrating main features of transcription factor network regulating microglia cell identity and functions.

