

Abstract
Perfluorooctanoic acid (PFOA) is a persistent, toxic, anthropogenic chemical recalcitrant to biodegradation. Based on previous studies in lower and higher vertebrates, it was hypothesized that chronic, sub-lethal, embryonic exposure to PFOA in zebrafish (Danio rerio) would adversely impact fish development, survival, and fecundity. Zebrafish embryo/sac-fry were water exposed to 2.0 or 0 nM PFOA from 3 to 120 hpf, and juvenile to adult cohorts were fed spiked food (8 pM) until 6 months. After chronic exposure, PFOA exposed fish were significantly smaller in total weight and length. Gene expression analysis found a significant decrease of transporters slco2b1, slco4a1, slco3a1 and tgfb1a, and a significant increase of slco1d1 expression. PFOA exposed fish produced significantly fewer eggs with reduced viability and developmental stage delay in F1. Chronic, low-dose exposure of zebrafish to PFOA significantly altered normal development, survival and fecundity and would likely impact wild fish population fitness in watersheds chronically exposed to PFOA.
Keywords: PFOA, Zebrafish reproduction, Zebrafish fecundity, Zebrafish development
1. Introduction
For over 50 years, perfluoro-alkylated substances (PFASs) have been used in a number of commercial and industrial products, such as paints, fire retardants, coatings for clothing/carpets for water resistance and stain protection, and surfactants [1]. Linear perfluorooctanoic acid (PFOA) is a fully fluorinated, eight-carbon chain PFAS with a carboxylic acid end group (Fig. 1). This compound is used as an emulsifier for producing fluoropolymers [2]. In 2000, growing research on the toxicity and bioaccumulation tendencies of various PFASs led to the voluntary cessation of production by the 3M Company and other United States manufacturers [3]. Between 1950 and 2000, an estimated 500 metric tons of PFOA was produced, and a large portion is still present in the environment [4].
Fig. 1.
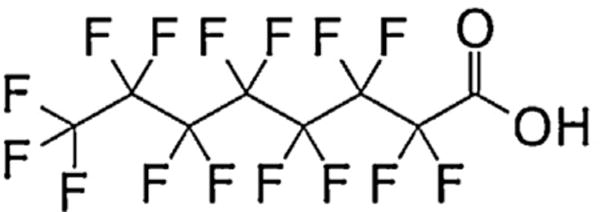
Structure of non-branched perfluorooctanoic acid (PFOA).
Due to its carboxylic acid moiety, PFOA is fairly water soluble in comparison to its hydrocarbon end chain counterparts, and hence its presence in ground and surface water is widespread [5]. Data collected from New Jersey public water systems have shown PFOA to be the most common PFAS found, with a maximum concentration of 100 ng/L [5]. Its metabolic inertness in natural biota, and resistance to degradation by strong acids, bases, or oxidizing agents [2] made PFOA appealing to manufactures, but these same traits resulted in PFOA persisting in the environment [6].
Although PFOA production had primarily been in North America, current manufacturing is continuing in other countries. Its presence has been detected in animal tissue and environmental samples worldwide due to local use and long term transport [7]. PFOA can also be formed from fluorotelomer alcohols, which are still used in a number of manufacturing processes. In the United States, fish tissue collected from three Midwest rivers had a maximum PFOA concentration of 1 part per billion [8]. In an artic study in northern Canada performed post phase-out, sediment samples contained approximately 0.01 ppb and fish samples 0.1 ppb PFOA [9]. Additionally, PFOA concentrations in the parts per trillion range has been found in Atlantic, central Pacific, and eastern Pacific Ocean samples [10].
In contrast to other organic pollutants, which tend to collect in fat, research has shown PFOA to accumulate predominantly in the liver, plasma, and kidney [1,6,11]. It does not undergo any metabolism within the body, and it is primarily eliminated as the parent compound in the urine [12–15]. In the mammalian literature, PFOA has been shown to be eliminated from the kidney utilizing the OAT1 and OAT3 transporters [16].
In aquatic species, PFOA exposure has led to gene expression changes (both up and down-regulated) in pathways involved in lipid metabolism, lipid transport, hormone action, and mitochondrial function in rare minnows [17]. A reproductive study of PFOA (0.01 mg/L) in adult medaka (Oryzias latipes) indicates negative impacts on offspring development and survivability, manifesting as an increased mortality rate and thyroid gland hyperplasia, hypertrophy, and colloidal depletion [18]. There appears to be multiple biochemical pathways that are disrupted following exposure to PFASs and the initial assumption that this class of compounds exerts their toxicity solely through the peroxisome proliferator activated receptor-alpha (PPARα) is not substantiated by more recent literature reports.
PFOA exposures in rats have established that PFOA can act as a peroxisome proliferator [19,20] specifically through expression of PPARα [21]. PPARα is a nuclear receptor involved in the regulation of fatty acids and lipid metabolism and activated though ligand binding [22]. When pregnant mice were exposed to PFOA, it was found that PPARα activation was associated with specific postnatal morphological delays, such as in eye opening, and the reduced survivability of offspring [23].
However, additional studies in rats found PFOA to be a hormone disruptor and it’s mode of action is independent of PPARα. One possible pathway to examine the hormone disruption effect is the organic anion transporting polypeptides (oatps; slco). These transporters can have a significant impact on the uptake and clearance of both toxic and endogenous compounds [24]. Some of the endogenous compounds transported include thyroxin, steroid conjugates, bile acids, bilirubin, and prostaglandins [24]. These substrates are important for both hormone regulation, as well as for growth and development. PFOA has been classified as both an inhibitor and substrate of various OATps [25]. A disruption in the normal function, either through inhibition or competition, of these transporters would impact the pharmacokinetics of the natural substrates. This in turn could lead to disruptions in hormonal pathways as well as energy uptake, utilization, and storage. Disruption of these critical biochemical pathways would impact reproductive success and F1 development across species since these transporters are highly conserved phylogenetically.
The disruption of temporal and spatial expression during early embryonic development and altered receptor expression during critical organ development by PFOA can result in permanent structural alterations in both lower and higher vertebrates. An acute embryo-larval PFOA exposure resulted in sac-fry larvae that were smaller in total length and had a larger yolk sac size at 5 dpf [26]. The decreased body size persisted in treated fish after the exposure was terminated. Additionally, a decrease in gene expression of organic anion transporting polypeptide slco2b1 and protein transporter ap1s1 pathway was observed. In the present study, we examined the effects of a chronic, environmentally relevant exposure concentration of PFOA in zebrafish from the embryo through adult life stages. P0 adult fish were measured for body weight and length, number of eggs produced during breeding and gene expression of relevant slco transporter pathways. The F1 generation was analyzed for percentage of viable embryos, developmental staging, and gene expression of ap1s1, a critical developmental pathway. The results presented in this paper demonstrate that chronic PFOA exposure during critical life-stages in zebrafish caused adverse effects in both the parental (P0) and offspring (F1) generations. The results reported in this paper and concordance with rodent effects described from laboratory studies would detrimentally impact both lower and higher vertebrate population and possibly community structure in locations with elevated PFOA concentrations.
2. Methods
2.1. Animal handling
The AB strain zebrafish (Zebrafish International Resource Center, Eugene, OR) were used for all experiments. Breeding stocks were bred and housed in Aquatic Habitats (Apopka, FL) recirculating systems under a 14:10 h light:dark cycle. System water was obtained by carbon/sand filtration of municipal tap water and water quality was maintained at <0.05 ppm nitrite, <0.2 ppm ammonia, pH between 7.2 and 7.7, and water temperature between 26 and 28 °C. All experiments were conducted in accordance with the zebrafish husbandry protocol and embryonic exposure protocol (#08-025) approved by the Rutgers University Animal Care and Facilities Committee.
2.2. Exposure
Shown in Fig. 2 is the exposure and data collection timeline. Zebrafish embryos were exposed in glass vials to either 2 nM or 0 nM PFOA (95%, Sigma Aldrich, St. Louis, MO) through a waterborne exposure from 3 hpf–120 hpf. At 120 hpf, fish were transferred to non-exposed water until 30 dpf, in which they were separated by treatment and placed in 3 L fish tanks. In our laboratory, the greatest period of mortality has been observed to be between 7 dpf when feeding begins through 30 dpf after fish have been acclimated to the feeding and water change schedule. In order to not further stress the fish and increase mortality during this critical time, exposure was terminated at 120 hpf and resumed at 30 dpf. At 1 month post fertilization, the fish began a feeding regimen consisting of non-treated brine shrimp in the morning feeding and 0.04 g of either control or PFOA treated flake food in the afternoon feeding (see Section 2.3 below). At 3 months post fertilization, fish from each treatment or control group were separated by sex and feeding continued. Feeding aliquots of 0.04 g of food were based on food quantities determined for our stock breeding sets (N = ~8 fish per tank). No food was remaining in tank after feeding. Exposure through feeding was performed for a number of reasons. Logistically, exposure through water only would require large quantities of PFOA-contaminated exposure water to be made daily, while exposure through food allowed for smaller volumes produced with all treatment or control groups receiving doses from the same preparation. Additionally, PFOA is relatively water soluble, and as such some of the PFOA in the food is expected to be absorbed into the water; this allows for both a food and waterborne exposure, similar to that seen in environmental conditions.
Fig. 2.
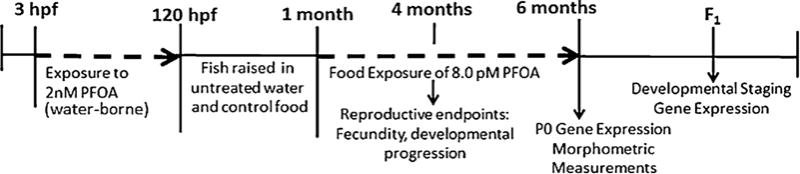
Timeline showing zebrafish exposure to PFOA and the endpoints examined. Water-borne exposure occurred between 3 and 120 hpf. Food exposure occurred from 30 dpf to 6 months post fertilization. Dashed lines represent exposure periods.
Fig. 3 represents the experimental design for one independent biological replicate. Three biological replicates were performed, each from a different initial stock breeding set initiated on different spawning dates. Initially, embryos were collected and exposed to 2 nM or 0 nM PFOS in 20 mL vials with 20 fish per vial. At 120 hpf, each group of fish from a vial were transferred to 600 mL beakers with no-treatment system water. These fish were raised in non-treated water until 30 dpf, in which 20 fish from each treatment group were placed into one 3-L tank and exposure continued via a food exposure (0.04 g of PFOA or control food). After 90 days, the fish were separated by sex into two tanks per treatment, one for males (N = 10) and one for females (N = 8) to have what is considered one “breeding set”. Each week, 5 males were moved into the female tank for a “breeding event”. Generally, the first breeding event does not produce an adequate amount of embryos for accurate analysis. Therefore, they were bred together 10 times for 9 “successful” breeding events. The number of eggs produced, the viability of the embryos, and the developmental staging progression [27] of the embryos were recorded. After 10 breeding events, the morphometric measurements of body length and weight were recorded for the adult fish, as well as livers isolated for gene expression analysis.
Fig. 3.
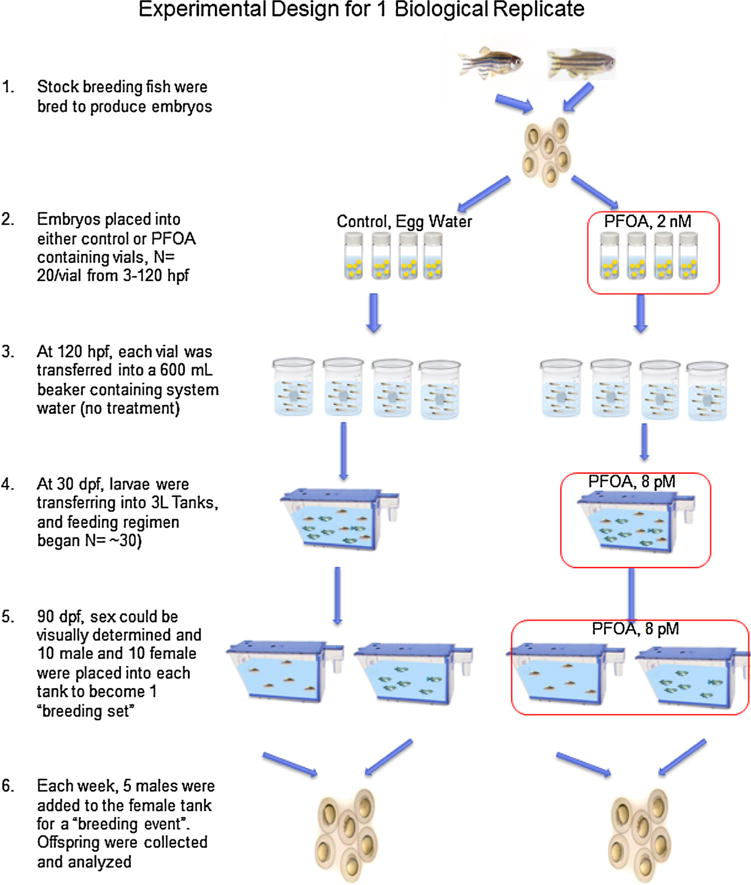
Schematic of no treatment control and exposed PFOA treated groups for one replicate of F0/F1 egg production. Red boxes indicate exposure to PFOA. While each replicate varied slightly, there was no significant differences between the same treatments in different replicates. (For interpretation of the references to colour in this figure legend, the reader is referred to the web version of this article.)
All tanks were constantly aerated and temperature was measured daily to ensure accurate range (25–27 °C) was maintained throughout the entire experiment. Twice weekly (day of breeding event, 3 days before next breeding event) a 50% water change was performed.
2.3. Exposure water and food preparation
PFOA solution for the water exposure was prepared by dissolving powdered perfluorooctanoic acid (Sigma Aldrich, St Louis MO) into Millipore filtered water for a stock solution (200 μM). The working solution of 2.0 nM was made by diluting the stock solution into filtered fish system water (described above). Control groups were raised in activated carbon filtered system water with no PFOA added. The food was prepared by mixing either stock PFOA or water with 95% ethanol for a final concentration of 2 nM (treated) or 0 nM (control). This solution was added to 10 g fish flake food making a slurry. The slurry was stirred overnight. The following day, the food-ethanol slurry was placed into a shallow Pyrex tray in the fume hood, and the ethanol was evaporated off until the food was dry. The remaining dried food was crushed into a powder and separated into 0.04 g aliquots and placed in a −20 °C freezer. The treated food had a final calculated concentration of 8.0 pM PFOA per aliquot.
2.4. Gene expression analysis
Livers isolated from adult fish (N = 5–8 per treatment group per biological replicate) or four replicates (N = 35 fish/replicate) of F1 embryos (48 hpf) from each treatment and control biological replicate were snap frozen in liquid nitrogen and RNA extracted using RNAzol reagent (Sigma-Aldrich, St. Louis, MO). Reverse transcription was performed with the High-Capacity cDNA Reverse Transcription Kit (Life Technologies, Carlsbad, CA) and real-time qPCR was performed using iQ™ SYBR® Green Supermix (Bio-Rad, Hercules CA). The qPCR protocol was used: 35 cycles of: 95 °C for 15 s and 60 °C for 1 min. The housekeeping gene used was actb1 (b-actin). It was ascertained that actb1 expression was not effected by PFOA treatment. Analysis was performed using a standard curve method for all of the P0 transcripts examined, and delta-delta CT was used for the F1 transcripts. The genes examined and primer sequences are listed in Table 1. Each independent experiment was replicated 3 times. Gene were selected based on previous studies in zebrafish PFOA exposure (slco2b1, ap1s1; [26]) or zebrafish exposure to similar compounds (PFNA and PFOS; tgfb1a; [26]). Slco1d1 was selected due to in vitro studies finding that the function of this transporter was inhibited by PFOA [25]. Slco3a1 and slco4a1 are similar transporters to slco2b1 and slco1d1, and while not studied as thoroughly, have many overlapping substrates. Additionally, it is believed that these organic anion transporting polypeptides can play a role in PFOA half-life and elimination within the organism [24]. Gene expression analysis was performed on F1 embryos at 48 hpf, with the goal of this time point to ensure enough tissue for analysis while not allowing the embryos to adapt to a non-exposure condition. At this time point, many of the genes are not expressed at high enough levels to be analyzed. Therefore, for F1 embryos, actb1 and ap1s1 were the only transcripts examined.
Table 1.
Zebrafish gene symbols, primer sequences, and primary function used for qRT-PCR analysis.
| Gene | Primer sequence | Primary Function | Relationship to PFOA Exposure |
|---|---|---|---|
| actb1 | Forward: 5′ -CGAGCAGGAGATGGGAACC-3′ | Housekeeping gene | – |
| Reverse: 5′ -CAACGGAAACGCTCATTGC-3′ | |||
| slco2b1 | Forward: 5′ -TTGCCCTGCCTCACTTCATT-3′ | Organic anion transporter | Previously observed to be affected in acute embryonic PFOA exposure [26] |
| Reverse: 5′ -AGGCTGGAGTTGAGTCTGGT-3′ | |||
| slco3a1 | Forward: 5′ -CTCATCTGCGGTGCCTTACT-3′ | Organic anion transporter | Similar substrates to slco2b1, possible contribute to PFOA transport [24] |
| Reverse: 5′ -CAGGCACTCCTTCCATCTCC-3′ | |||
| tgfb1a | Forward: 5′ -CCGCATCCAAAGCCAACTTC-3′ | Transcription growth factor; lateral line development | Previously observed to be affected in acute embryonic PFOS, PFNA exposure (Jantzen et al.) [26] |
| Reverse: 5′ -CGCCCGAAAACATTCCCAAG-3′ | |||
| slco4a1 | Forward: 5′ -GATCTTCTACACAGCCGCCA-3′ | Organic anion transporter | Similar substrates to slco2b1, possible contribute to PFOA transport [24] |
| Reverse: 5′ -AATCCACCAAGCTCCAACCC-3′ | |||
| slco1d1 | Forward: 5′ -GCCGCATTTCTTCCAAGGAC-3′ | Organic anion transporter | Previously observed to be inhibited PFOA exposure [25] |
| Reverse: 5′ -TGTAAGGCACGGCAGAACAT-3′ | |||
| ap1s1 | Forward: 5′ -CCGTCGAAATGATGCGCTTT-3′ | Protein transporter | Previously observed to be affected acute in embryonic PFOA exposure [26] |
| Reverse: 5′ -GTACTTATCCAGCACCACCTG-3′ |
2.5. Reproductive success and F1 embryo staging
Each week, control and PFOA-treated breeding sets were bred at the same time. Embryos were collected into 100 mm petri dishes with egg water. The total number of eggs produced and the percentage of eggs that were viable were recorded immediately after collection (3 hpf). Viability was determined by the appearance of dividing cells on the yolk mass. All non-viable embryos were removed from the petri dish, and of those remaining ten embryos were randomly selected and raised individually in egg water in 1-mL glass vials at 26 °C. Staging of each embryo was performed daily from 24 to 96 hpf using the parameters described by Kimmel et al. [27]. Table 2 below lists zebrafish embryo-larval developmental periods and an example of a specific developmental endpoint used in determining the specific developmental stage.
Table 2.
Zebrafish developmental periods and examples of specific developmental stage. Descriptions of each developmental period are based on those described in [27] for fish raised at 28 °C. Hours post fertilization as been altered from to our observations of raising fish at 26 °C.
| Developmental Period | Specific Developmental Stage | Hours Post Fertilization (26 °C) |
Description |
|---|---|---|---|
| Gastrula | Bud | 17 | Tail begins to be visible, head formation begins |
| Segmentation | 18-somite | 24 | Extension of tail |
| Pharyngula | Prim-6 | 48 | Retina pigmented, melanophores present, heart beat prominent, |
| Hatching | Long Pec | 72 | Pectoral fin buds elongated, hatching occurs |
| Larval | Protruding Mouth | 96 | Gill formations visible, mouth is open |
2.6. Statistics
Using SigmaPlot® 11, student t-test or paired student t-test, (gene expression, morphometric measurements) and chi-squared tests (developmental stages, viable offspring) were performed to determine significance. For gene expression and morphometric measurements, statistical analysis was performed on each biological replicate (1 breeding set) with N = 5–8 animals per group. Offspring viability was determined using a chi-squared test based on observed (PFOA treated) and expected (control) embryos from each breeding set for each breeding event, as well as a cumulative viability of the 9 breeding events. This was repeated for each biological replicate. Developmental staging analysis was also performed using a chi squared test, N = 8–10 embryos randomly selected for each breeding event (N = 8–10) as well as cumulative for the 9 breeding events in each replicate. Statistical significance was at a p-value ≤0.05. There were no significant differences determined between treatment groups from different biological replicates or between control groups from different biological replicates. The SigmaPlot software tests for normality and power of the test prior to statistical analysis.
3. Results
3.1. Parental (P0) morphometrics and PFOA body burden
PFOA exposure had no effect on the survival of the P0 generation. At 6 months post fertilization, the total body length and weight of the adult animals were measured. PFOA exposed fish had significantly shorter total body length (Fig. 4A) as well as a significantly reduced body weight (Fig. 4B) compared to control fish.
Fig. 4.
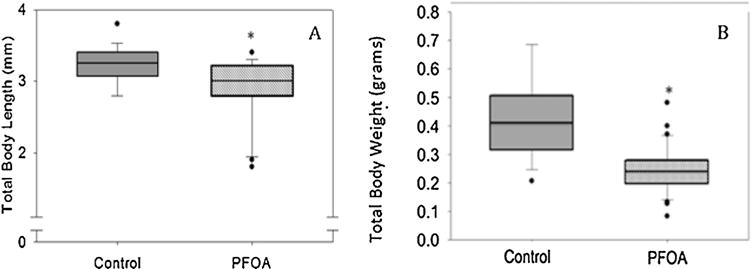
Morphometric measurements of P0 fish at 6 months following embryonic exposure and 30 dpf–6 months feeding exposure. The middle bar represents the median, the boxes represent 25th and 75th percentiles. The total body length (A) is reduced in the treatment group (average ± SD 2.9 ± 0.5) compared to control (average ± SD 3.2 ± 0.3). The total body weight (B) is reduced in the treatment group (average ± SD 0.29 ± 0.1) compared to control (average ± SD 0.4 ± 0.1). N = 8–12 fish per treatment group. An asterisk (*) indicates a statistical significant value, p < 0.05, student t-test.
3.2. Gene expression
Gene expression of 4 organic anion transporting polypeptides (slco1d1, slco2b1, slco3a1, and slco4a1) and growth factor tgfb1a was performed on livers of the parent generation (Fig. 5). Slco2b1, slco3a1, and slco4a1 all resulted in significantly decreased expression (0.5, 0.03, and 0.17 fold, respectively). Tgfb1a was also significantly decreased in expression in the treated group (0.30 fold). Organic anion transporter slco1d1 was the only gene examined that resulted in a significant increase in expression after PFOA exposure (9.12 fold). Analysis of protein transporter ap1s1 was performed on the F1 embryos at 48 hpf (Fig. 6). There was a significant increase in ap1s1 expression (1.71 fold) in F1 embryos from PFOA exposed parents.
Fig. 5.
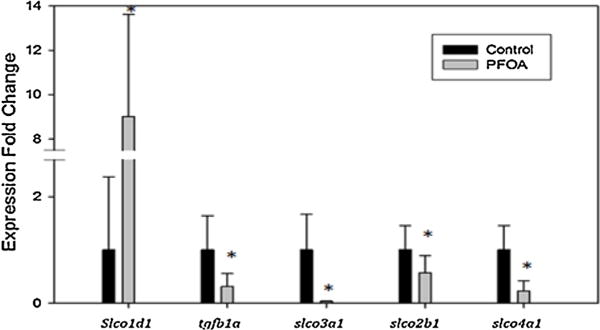
Gene expression of control (0 pM) and PFOA-fed (8.28 pM) fish of slco1d1, tgfb1a, slco3a1, slco2b1, and slco4a1 transcripts. N = 5–8 for each exposure group. An asterisk (*) indicates a statistical significant value from control, p < 0.05, student t-test.
Fig. 6.
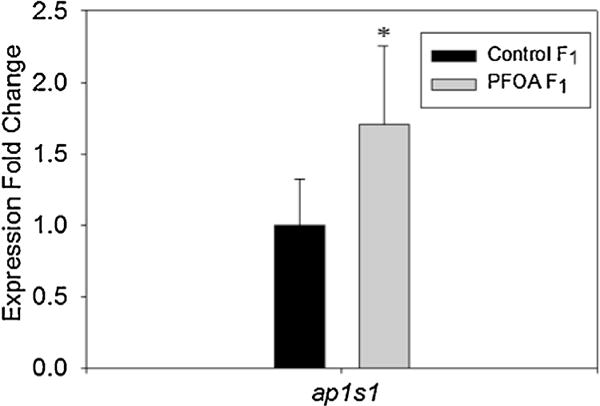
Gene expression of F1 offspring from control (0 pM) and PFOA-fed (8.28 pM) fish of ap1s1 transcript. N = 4 pooled sampled of 25 fish each per exposure group. An asterisk (*) indicates a statistical significant value from control, p < 0.05, student t-test.
3.3. Offspring production and viability
After nine breeding events, the cumulative number of eggs produced by the control-fed fish was significantly larger (2184 eggs) compared to number produced from the PFOA exposed fish (1754 eggs) (Fig. 7). The average percent of viable embryos produced over the nine breeding events was significantly decreased in the PFOA exposure group (Fig. 8).
Fig. 7.
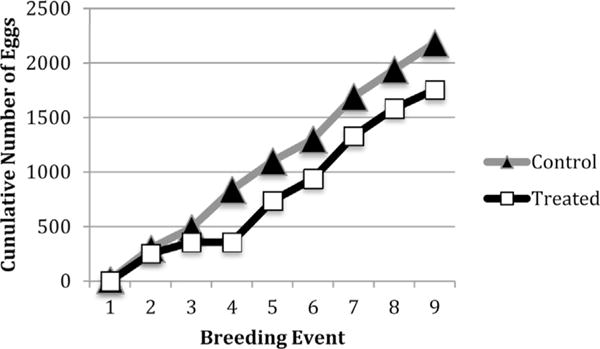
Cumulative number of eggs produced over the course of 9 breeding events. This figure is representative of one biological replicate. Each breeding set had six females and five males. Statistical analysis using chi-squared test of the cumulative data indicated the control groups produced significantly more eggs. This was replicable in each biological replicate.
Fig. 8.
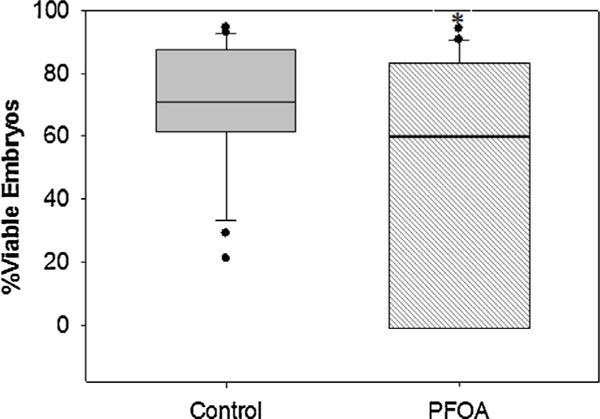
Average percentage of viable embryos/eggs produced at collection 3 hpf. Middle bars represent median, error bars represent 95th and 5th percentiles. An asterisk (*) indicates a statistical significant value, p < 0.05, chi-squared test.
3.4. F1 generation effects
The F1 embryos were photographed and their developmental stage recorded at 24, 48, 72, and 96 hpf (Fig. 9). Representative images of a control and treated embryo through these time points can be seen in Supplemental Fig. 1. The general staging criteria (based on [27]) are listed in Table 2. At each time point examined, there is a significant stage delay in the development of embryos from the PFOA exposed adults. At 24 hpf, 40% of the PFOA F1 embryos were in the gastrula period, which is when the germ ring and embryonic shield become visible, and the brain and notochord begin to form. At this time point, all of the control embryos were in the segmentation stage, which is when primary organogenesis occurs, the body and tail structures become distinct, and structures such as the somite, pharyngeal and neuromeres develop. After 48 h, all of the PFOA embryos reached the segmentation stage, whereas 75% of the control embryos have moved into the pharyngula period, in which the body axis straightens, circulation and pigmentation are visible, and fins begin to form. At 72 hpf, the majority of the embryos from the control group were in the long-pec or pec fin stages, which are part of the hatching period, and involve completion of morphogenesis of primary organs, and cartilage formation in the head and fins. PFOA embryos at this time point were in the pharyngula period. After 96 h, 95% of the control embryos were at the pec fin or protruding mouth stage, which is classified as early free swimming larval stage. PFOA embryos at this time point were mainly in the segmentation stage (70%), and many had not hatched from the chorion.
Fig. 9.
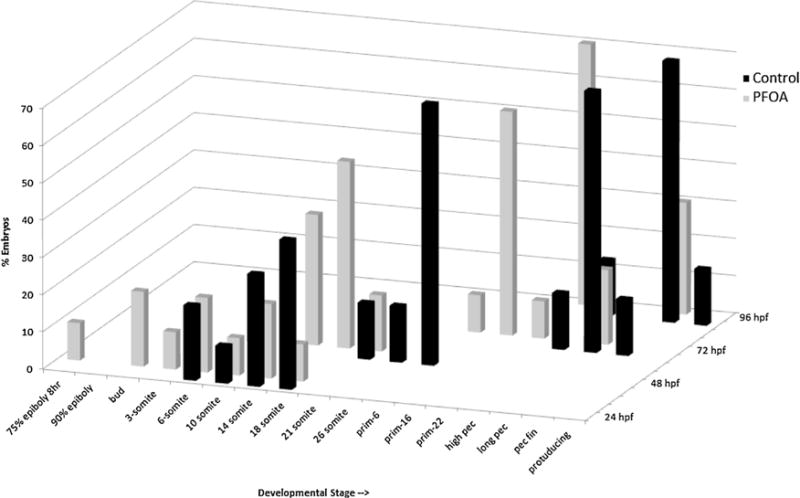
Embryo developmental staging based on [27] at 24, 48, 72, and 96 hpf for embryos collected from chronically exposed parental stock and raised in rearing solution free of treatment. Developmental stages along the x-axis increase from left to right. Statistical analysis using chi-squared test at each stage found the PFOA F1 embryos were significantly developmentally delayed (p < 0.05).
4. Discussion
Chronic, low dose, PFOA exposure to zebrafish has detrimental effects both in the P0 and F1 generations. These effects were observed in this study at a concentration (3.4 ng/L) that is similar to those detected in drinking water sources in a number of localities throughout the country, such as the North Carolina river basin (median 12.6 ng/L) [28] and New Jersey drinking water sources (4–5 ng/L) [5]. Representative PFOA body burden measurements were analyzed on pooled samples from each sex and treatment from two replicates after the liver had been removed for gene expression analysis found control fish to have 1.2 ng PFOA/fish and treated fish to have 4.07 ng PFOA/fish. In our study, fish chronically exposed to PFOA were significantly smaller in size, produced fewer eggs, had smaller percentage of embryo viability, and decreased expression of growth factor tgfb1a as well as three organic anion transporting polypeptides (slco2b1, slco4a1, slco3a1), and an increase in expression of transporter slco1d1. Offspring of PFOA exposed fish were significantly developmentally delayed and had an increase in the protein transport gene ap1s1 expression. These changes in gene expression during critical windows of development are one possibility that could explain the morphologic and toxic effects observed.
In the P0 generation, a significant decrease of body size in terms of both length and weight was observed (Fig. 3). This correlates with previous studies in our laboratory which found that zebrafish exposed to PFOA during development decreased in total body size both immediately following the exposure period (120 hpf) as well as after a recovery period (14 dpf) [26]. These acutely exposed fish s(2.0 μM) also had a significantly increased yolk sac size. It has previously been shown that the yolk sac size can have a direct effect on the total size of the zebrafish [34]. Jardine [34] showed that when the yolk sac was manipulated to be smaller, it resulted in a decrease in body size. The yolk sac is where the energy and nutrients supplied from the mother are stored for the developing embryo, and it is the embryo’s only source of nutrition until feeding begins. In the current study, during the initial embryonic exposure of 2 nM PFOA between 3 hpf and 120 hpf no significant changes in yolk sac size were observed. A decrease in body size could be due to a dysfunction of energy uptake, storage, or subtle changes in lipoproteins transport or utilization by the developing zebrafish even when the yolk sac size is not affected.
One pathway that could possibly be involved in the observed alterations in energy usage and possibly other reproductive effects observed is the tgfb1a gene, which was significantly decreased in expression in the exposed animals. In mammals, the tgfb1 family of genes has been shown to regulate follicle development, steroidogenesis, oocyte maturation, ovulation and follicular atresia [29]. In zebrafish, it was discovered that TGF-B1 is likely involved in regulating ovarian function through hormone signaling and has been shown to inhibit gonadotropin and maturation inducing hormone (MIH) oocyte maturation [29]. A decrease in expression of this gene could have effects on zebrafish reproductive hormone cycling as well as oocyte maturation, which could account for the reduced number of embryos and viability observed (Figs. 6 and 7). Delayed development seen in F1 treated embryos (Fig. 8) may be related to this or other transporters, such as the organic anion transporters. It is currently unknown whether these effects are due to PFOA affecting the embryo’s nutrient and hormone availability, or potentially affecting the maternal circulating hormone levels during spawning.
Another possible explanation that could account for the effects seen in the P0 generation and reduced reproductive success are the organic anion transporters. Organic anion transporting polypeptides (oatp; slco) are membrane transporters [25] that are responsible for the uptake and efflux of multiple endogenous and exogenous substrates [24]. Some of these substrates include thyroxin, steroid conjugates, bile acids, bilirubin, and prostaglandins [24]. These transporters can act to bring substances both into and out of the cells. While OATps can have specific substrates, many have lower substrate fidelity and overlap the substances that they have an affinity to transport across membranes.
PFOA has been found to interact with oatps in a number of different species. In rats, PFOA had been determined to be both a substrate and inhibitor for Oatp1a1 and a strong inhibitor for human OATP1A2 [16]. Acute exposure to PFOA resulted in a significant increase of slco2b1 expression in zebrafish at both 5 dpf and 14 dpf [26] and has been shown to be a strong inhibitor of slco1d1 [25]. Rodent Oatp1a1, human OATP1a2, and zebrafish Oatp1d1 are all considered functional orthologs of each other in their respective species.
Oatp2b1 (slco2b1) is expressed throughout the zebrafish body, and has endogenous substrates that include taurocholate and estron-3-sulfonate as well as exogenous substrates such a fexofenadine, statins, and glibenclamide [25]. Estron-3-sulfonate is a precursor to biologically active estrogen [30] and can play a role in mediating reproductive success. In humans, the OAT2B1 ortholog is thought to be responsible for transport of sulfated steroids to the fetus from the mother during pregnancy [24]. Oatp3a1 transports neuron-active peptides, thyroid hormones, taurocholate and prostaglandins. OAT4a1 is ubiquitously expressed and involved in thyroid hormones, taurocholate and possibly prostaglandins [24]. All three of these transporters (slco2b1, slco3a1, slco4a1) had a significantly reduced expression in the PFOA treated adult fish.
In zebrafish, thyroid hormones are involved in the differentiation of pectoral fins, growth of pelvic fins, and necessary for the progression from larval to juvenile stages [31]. Changes in transport and serum concentration of these hormones through changes in organic anion transporter function could have resulted in the reduced growth observed in the PFOA treated adults (Fig. 3). Prostaglandins are lipid compounds that can act in a similar manner to hormones, and have been shown to play a role in the maturation and ovulation of the zebrafish oocyte [29]. Alteration in the transport of these compounds could result in reproductive defects, such as a reduction of egg production observed in the current study.
The transporter slco1d1 is responsible for the movement of a wide range of endogenous and pharmaceutical compounds. These substrates include bile acids, bromosulfophthalein, sulfated steroid, DHEAS, estron-3-sulfonate, and thyroid hormones [24,25]. Slco1d1 is the only transporter transcript examined in this study found to be significantly increased in expression. Previous studies in vitro (HEK293 cell line) found that PFOA was an inhibitor of slco1d1 in zebrafish as well as its orthologs in humans and rodents [25]. The normal function of Oatp1d1 in zebrafish is to uptake steroid hormone conjugates into hepatocytes, which allows elimination through the bile [25]. While the regulation mechanisms of this pathway are currently not known, a change in expression could affect the amount of circulating hormone conjugates. This could have effects on egg production in adult zebrafish and is another plausible pathway to account for the decrease in egg production (Fig. 6) and viability observed (Fig. 7).
In the F1 generation, PFOA exposed embryos showed a significant development delay compared to the control embryos (Fig. 8). This could be an indirect effect from alterations to the P0 females, in that they did not produce enough vitellogenin for the embryos to use for nutrients to grow until they are large enough to ingest their own food. Another possible explanation would be that there is a defect in the embryos that affects their ability to transport nutrients from their yolk sac. In an acute PFOA exposure, treated embryos had a significantly larger yolk sac and smaller body size, and showed significant decrease in the ap1s1 expression at 5 dpf [26]. The ap1s1 pathway is involved in protein cargo sorting and vesicular trafficking in the cell in early zebrafish development [32]. Knockdown of this pathway results in zebrafish larvae that are smaller in size, disorganized fin structure, and severe motor deficits [32]. Gene expression of the F1 generation in the current study at 48 hpf showed a significant increase of the ap1s1 gene but had no visible change in yolk sac size. One explanation for this increase in ap1s1 expression could be that expression is dependent upon the development stage. At 48 hpf, the F1 control fish are primarily in the prim-6 stage, in which the brain and notochord are fully formed. At this time, development is less rapid and each stage begins to last for a longer duration. In contrast, the majority of the F1 treated fish are in the 14-18-somite stage. During these stages organogenesis is rapidly occurring. Some characteristics of this stage include the subdivision of the brain becomes visible, the yolk sac constricts which allows the animal to begin to straighten, and muscular contractions begin. The F1 from treated fish are at a stage where protein transport and utilization is needed more than those of the F1 control fish, which could account for the increase in ap1s1 expression.
5. Conclusions
A chronic, environmentally relevant PFOA exposure through water and food had detrimental effects on both the P0 and F1 generations with similar outcomes to those observed in other model organisms (Table 3). These results are also able to be compared to those found in embryonic zebrafish PFOA exposure [26] (Table 4). In the P0 generation, this manifested as a decreases in body weight and body size. The reproductive effects observed were a significant decrease in total eggs production and viability. In the F1 generation, there was a significant developmental delay in PFOA exposed offspring. Possible pathways that could account for these effects could be the decrease of growth factor tgfb1a expression, or a combination of organic anion transporters (slco2b1, slco1d1, slco3a1, slco4a1). Currently, very little is known about the role of maternal versus embryonic production and utilization of these transporters after PFOA exposure. The reproductive defects observed in this study after chronic PFOA exposure in zebrafish could also manifest in field-exposed teleost species, which would in turn have severe population level effects.
Table 3.
Summary of reproductive effects after PFOA exposure in various model species. These studies were selected as a representative example of similar effects observed in multiple species.
| Organism | PFOA Concentration | Reproductive Effects | Citation |
|---|---|---|---|
| Zebrafish (Danio rerio) | 0.002 μM | Reduced egg production, reduced viability, delayed F1 development | Current study |
| Medaka (Oryzias latipes) | 4.14 μM | Increased F1 mortality, thyroid development defects | [18] |
| Mice | 5 mg/kg | Reduced fetal weight, Increased post-partum mortality | [33] |
Table 4.
Comparison of 5 dpf and 14 dpf zebrafish embryonically exposed to PFOA as seen in [26] compared to the current study (180 dpf chronic PFOA exposure). Up (↑) or down (↓) arrows represent a statistically significant alteration either increased or decreased, respectively. “NS” indicates no significance difference. Dashed lines (- - -) indicate that the endpoint was not measured for that life stage.
| dpf: Exposure Type |
5 dpf* PFOA Embryonic exposure |
14* PFOA Embryonic Exposure |
180 dpf PFOA chronic exposure |
|---|---|---|---|
| Morphometric | |||
| Total Body Length | ↓ | ↓ | ↓ |
| Gene Expression | |||
| slco2b1 | ↑ | ↑ | ↓ |
| tgfb1a | NS | - - - | ↓ |
| slco1d1 | - - - | - - - | ↑ |
Indicates data reported in [26].
Supplementary Material
Acknowledgments
This work was carried out at the NJ Agricultural Experiment Station with funding support through Cooperative State Research, Education, and Extension Services [01201]; the NJ Water Resources Research Institute [NJWRRI2015]; Department of Biochemistry and Microbiology, Rutgers University.
Appendix A. Supplementary data
Supplementary data associated with this article can be found, in the online version, at http://dx.doi.org/10.1016/j.reprotox.2017.01.009.
Footnotes
Disclosure of potential conflicts of interest
The authors have no potential conflicts of interest to declare.
References
- 1.Post GB, Cohn PD, Cooper KR. Perfluorooctanoic acid (PFOA), an emerging drinking water contaminant: a critical review of recent literature. Environ Res. 2012;116:93–117. doi: 10.1016/j.envres.2012.03.007. [DOI] [PubMed] [Google Scholar]
- 2.Lau C. Perfluorinated compounds. EXS. 2012;101:47–86. doi: 10.1007/978-3-7643-8340-4_3. [DOI] [PubMed] [Google Scholar]
- 3.Parsons JR, et al. Biodegradation of perfluorinated compounds. Rev Environ Contam Toxicol. 2008;196:53–71. doi: 10.1007/978-0-387-78444-1_2. [DOI] [PubMed] [Google Scholar]
- 4.Lau C, et al. Perfluoroalkyl acids: a review of monitoring and toxicological findings. Toxicol Sci. 2007;99(2):366–394. doi: 10.1093/toxsci/kfm128. [DOI] [PubMed] [Google Scholar]
- 5.Post GB, et al. Occurrence of perfluorinated compounds in raw water from New Jersey public drinking water systems. Environ Sci Technol. 2013;47(23):13266–13275. doi: 10.1021/es402884x. [DOI] [PubMed] [Google Scholar]
- 6.Houde M, et al. Monitoring of perfluorinated compounds in aquatic biota: an updated review. Environ Sci Technol. 2011;45(19):7962–7973. doi: 10.1021/es104326w. [DOI] [PubMed] [Google Scholar]
- 7.Kannan K, et al. Perfluorinated compounds in aquatic organisms at various trophic levels in a Great Lakes food chain. Arch Environ Contam Toxicol. 2005;48(4):559–566. doi: 10.1007/s00244-004-0133-x. [DOI] [PubMed] [Google Scholar]
- 8.Ye X, et al. Perfluorinated compounds in whole fish homogenates from the Ohio, Missouri, and Upper Mississippi Rivers, USA. Environ Pollut. 2008;156(3):1227–1232. doi: 10.1016/j.envpol.2008.03.014. [DOI] [PubMed] [Google Scholar]
- 9.Butt CM, et al. Levels and trends of poly- and perfluorinated compounds in the arctic environment. Sci Total Environ. 2010;408(15):2936–2965. doi: 10.1016/j.scitotenv.2010.03.015. [DOI] [PubMed] [Google Scholar]
- 10.Yamashita N, et al. A global survey of perfluorinated acids in oceans. Mar Pollut Bull. 2005;51(8–12):658–668. doi: 10.1016/j.marpolbul.2005.04.026. [DOI] [PubMed] [Google Scholar]
- 11.Kudo N, Kawashima Y. Toxicity and toxicokinetics of perfluorooctanoic acid in humans and animals. J Toxicol Sci. 2003;28(2):49–57. doi: 10.2131/jts.28.49. [DOI] [PubMed] [Google Scholar]
- 12.Consoer DM, et al. Toxicokinetics of perfluorooctanoate (PFOA) in rainbow trout (Oncorhynchus mykiss) Aquat Toxicol. 2014;156C:65–73. doi: 10.1016/j.aquatox.2014.07.022. [DOI] [PubMed] [Google Scholar]
- 13.Han X, et al. Binding of perfluorooctanoic acid to rat and human plasma proteins. Chem Res Toxicol. 2003;16(6):775–781. doi: 10.1021/tx034005w. [DOI] [PubMed] [Google Scholar]
- 14.Han X, et al. Renal elimination of perfluorocarboxylates (PFCAs) Chem Res Toxicol. 2012;25(1):35–46. doi: 10.1021/tx200363w. [DOI] [PubMed] [Google Scholar]
- 15.Steenland K, Fletcher T, Savitz DA. Epidemiologic evidence on the health effects of perfluorooctanoic acid (PFOA) Environ Health Perspect. 2010;118(8):1100–1108. doi: 10.1289/ehp.0901827. [DOI] [PMC free article] [PubMed] [Google Scholar]
- 16.Yang CH, Glover KP, Han X. Characterization of cellular uptake of perfluorooctanoate via organic anion-transporting polypeptide 1A2, organic anion transporter 4, and urate transporter 1 for their potential roles in mediating human renal reabsorption of perfluorocarboxylates. Toxicol Sci. 2010;117(2):294–302. doi: 10.1093/toxsci/kfq219. [DOI] [PubMed] [Google Scholar]
- 17.Wei Y, et al. Toxicogenomic analysis of the hepatic effects of perfluorooctanoic acid on rare minnows (Gobiocypris rarus) Toxicol Appl Pharmacol. 2008;226(3):285–297. doi: 10.1016/j.taap.2007.09.023. [DOI] [PubMed] [Google Scholar]
- 18.Ji K, et al. Toxicity of perfluorooctane sulfonic acid and perfluorooctanoic acid on freshwater macroinvertebrates (Daphnia magna and Moina macrocopa) and fish (Oryzias latipes) Environ Toxicol Chem. 2008;27(10):2159–2168. doi: 10.1897/07-523.1. [DOI] [PubMed] [Google Scholar]
- 19.Berthiaume J, Wallace KB. Perfluorooctanoate, perflourooctanesulfonate, and N-ethyl perfluorooctanesulfonamido ethanol; peroxisome proliferation and mitochondrial biogenesis. Toxicol Lett. 2002;129(1–2):23–32. doi: 10.1016/s0378-4274(01)00466-0. [DOI] [PubMed] [Google Scholar]
- 20.Guruge KS, et al. Gene expression profiles in rat liver treated with perfluorooctanoic acid (PFOA) Toxicol Sci. 2006;89(1):93–107. doi: 10.1093/toxsci/kfj011. [DOI] [PubMed] [Google Scholar]
- 21.White SS, Fenton SE, Hines EP. Endocrine disrupting properties of perfluorooctanoic acid. J Steroid Biochem Mol Biol. 2011;127(1–2):16–26. doi: 10.1016/j.jsbmb.2011.03.011. [DOI] [PMC free article] [PubMed] [Google Scholar]
- 22.Escher P, Wahli W. Peroxisome proliferator-activated receptors: insight into multiple cellular functions. Mutat Res. 2000;448(2):121–138. doi: 10.1016/s0027-5107(99)00231-6. [DOI] [PubMed] [Google Scholar]
- 23.Abbott BD, et al. Perfluorooctanoic acid induced developmental toxicity in the mouse is dependent on expression of peroxisome proliferator activated receptor-alpha. Toxicol Sci. 2007;98(2):571–581. doi: 10.1093/toxsci/kfm110. [DOI] [PubMed] [Google Scholar]
- 24.Klaassen CD, Aleksunes LM. Xenobiotic, bile acid, and cholesterol transporters: function and regulation. Pharmacol Rev. 2010;62(1):1–96. doi: 10.1124/pr.109.002014. [DOI] [PMC free article] [PubMed] [Google Scholar]
- 25.Popovic M, et al. Interaction of environmental contaminants with zebrafish organic anion transporting polypeptide, Oatp1d1 (Slco1d1) Toxicol Appl Pharmacol. 2014;280(1):149–158. doi: 10.1016/j.taap.2014.07.015. [DOI] [PubMed] [Google Scholar]
- 26.Jantzen CE, et al. PFOS, PFNA, and PFOA sub-lethal exposure to embryonic zebrafish have different toxicity profiles in terms of morphometrics, behavior and gene expression. Aquat Toxicol. 2016;175:160–170. doi: 10.1016/j.aquatox.2016.03.026. [DOI] [PMC free article] [PubMed] [Google Scholar]
- 27.Kimmel CB, et al. Stages of embryonic development of the zebrafish. Dev Dyn. 1995;203(3):253–310. doi: 10.1002/aja.1002030302. [DOI] [PubMed] [Google Scholar]
- 28.Nakayama SF, et al. Determination of perfluorinated compounds in the upper Mississippi river basin. Environ Sci Technol. 2010;44(11):4103–4109. doi: 10.1021/es100382z. [DOI] [PubMed] [Google Scholar]
- 29.Kohli G, et al. Cloning of transforming growth factor-beta 1 (TGF-beta 1) and its type II receptor from zebrafish ovary and role of TGF-beta 1 in oocyte maturation. Endocrinology. 2003;144(5):1931–1941. doi: 10.1210/en.2002-0126. [DOI] [PubMed] [Google Scholar]
- 30.Nozawa K, et al. Neonatal exposure to 17 alpha-ethynyl estradiol affects ovarian gene expression and disrupts reproductive cycles in female rats. Reprod Toxicol. 2014;46:77–84. doi: 10.1016/j.reprotox.2014.03.001. [DOI] [PubMed] [Google Scholar]
- 31.Brown DD. The role of thyroid hormone in zebrafish and axolotl development. Proc Natl Acad Sci U S A. 1997;94(24):13011–13016. doi: 10.1073/pnas.94.24.13011. [DOI] [PMC free article] [PubMed] [Google Scholar]
- 32.Montpetit A, et al. Disruption of AS1, causing a novel neurocutaneous syndrome, perturbs development of the skin and spinal cord. PLoS Genet. 2008;4(12):e1000296. doi: 10.1371/journal.pgen.1000296. [DOI] [PMC free article] [PubMed] [Google Scholar]
- 33.Yahia D, et al. Effects of perfluorooctanoic acid (PFOA) exposure to pregnant mice on reproduction. J Toxicol Sci. 2010;35(4):527–533. doi: 10.2131/jts.35.527. [DOI] [PubMed] [Google Scholar]
- 34.Jardine D, Litvak MK. Direct yolk sac volume manipulation of zebrafish embryos and the relationship between offspring size and yolk sac volume. J Fish Biol. 2003;63(2):388–397. [Google Scholar]
Associated Data
This section collects any data citations, data availability statements, or supplementary materials included in this article.