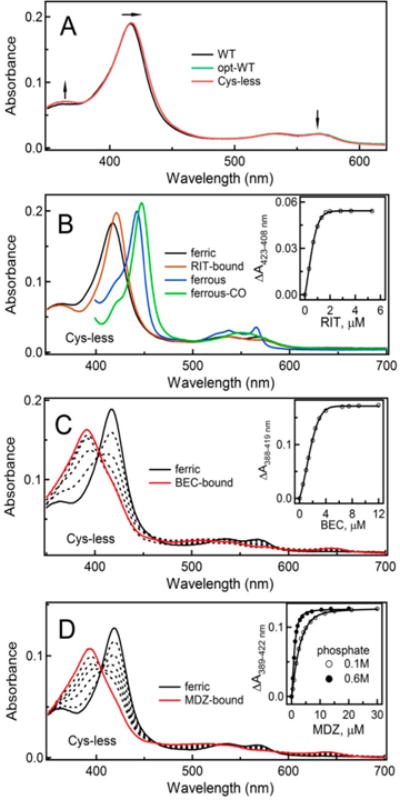
Figure 2.

(A) Absorbance spectra of WT, opt-WT, and Cys-less CYP3A4. Arrows point to spectral differences indicative of a partial type II spectral shift in opt-WT and Cys-less CYP3A4. (B) Spectral changes induced by RIT in Cys-less CYP3A4. (C and D) Equilibrium titration of Cys-less CYP3A4 with BEC and MDZ, respectively. Insets are titration plots and quadratic or hyperbolic fittings. The derived Ks values are listed in Table 1.
