

Abstract
Objective:
To estimate the fat fraction (FF) in the salivary glands (SGs) by the mDIXON method and the 1H−MR spectroscopy (MRS) method, and to compare the results.
Methods:
16 healthy volunteers were enrolled. mDIXON Quant and MRS (point-resolved spectroscopy: PRESS) with a single TE were employed to measure the FF in the parotid gland (PG) and submandibular gland (SMG). Multiple TEs were applied in 10 volunteers to correct for T2 decay. In addition, we assumed that the 1.3 ppm peak accounted for 60% of the total fat peak and estimated the FF (MRS all) as a gold standard. On mDIXON Quant images, volumes of interest were set on the bilateral SGs and we obtained the FF (mDIXON) of each volume of interest.
Results:
There was a strong correlation between the results of the mDIXON Quant method and the MRS (single TE) method (R2 = 0.960, slope = 0.900). Using PRESS with multiple TEs, there was also a strong correlation between FF (mDIXON) and FF (MRS all) (R2 = 0.963, slope = 1.18). FF (MRS all) was 24.9±12.7% in the PG and 4.5±3.0% in the SMG, while FF (mDIXON) was 29.4±16.2% in the PG and 6.4±4.7% in the SMG. There were no significant differences between the two methods, but the Bland-Altman plot showed that FF (mDIXON) was slightly larger than FF (MRS all) for small FF areas.
Conclusion:
The mDIXON Quant method could be clinically useful for evaluating the FF of SGs, but the absolute values need careful interpretation.
Advance in knowledge:
This study suggested the potential clinical usefulness of the mDIXON Quant method for the SGs.
INTRODUCTION
Hepatic accumulation of triglycerides causes nonalcoholic fatty liver disease, which comprises a wide spectrum extending from simple hepatic steatosis to end-stage liver disease. As a substitute for invasive biopsy, 1H−MR spectroscopy (MRS) has been widely used to estimate the proton densityfat fraction (FF) and it has proven to be a sensitive biomarker for estimating the hepatic triglyceride content.1–3
Fat deposition in the salivary glands is considered to be a characteristic feature of Sjögren’s syndrome and its assessment is useful for differentiation from xerostomia due to other causes. Although subjective and semi-quantitative analyses of fat deposition in Sjögren’s syndrome have already been performed,4,5 there have been no reports about quantitative FF analysis.
MRS has been widely used for estimation of the hepatic FF and is recognized as the gold standard for proton density FF estimation. However, this method does not provide morphological information and the scanning time is relatively long.
Recent advances in three-dimensional Dixon methods have led to the development of rapid, robust and quantitative approaches that can accurately characterize fat and water contents.
If the longitudinal relaxation is sufficient, the signal intensity can be described as follows:6,7
where (t) represents the signal acquired at time t in a given voxel, Δfi and ai are the chemical shift spectral frequency and relative amplitude of the ith spectral peak of F relative to W, ѱ represents magnetic field inhomogeneity, and characterizes transverse relaxation and intravoxel dephasing of the signal. The unknown parameters (W, F, ѱ and ) are solved with six measurements of s (t). This method for quantification of fat–water separation is known as the iterative decomposition with echo asymmetry and least squares (IDEAL) technique. The latest IDEAL techniques employ a six-echo acquisition protocol to estimate the FF by the method outlined above.
This method was initially only available on GE scanners, but a similar method called mDixon Quant has become available on Philips scanners and it can be used to automatically obtain various types of images (water, fat, in phase, out of phase, and FF) without off-line processing. Because contiguous axial images are acquired, it is possible to calculate FF at any site within the scanning field.
Previous imaging studies of the liver7–9 have revealed a strong correlation between the FF obtained by water–fat signal separation using a volume gradient sequence with multiple TEs (6 echoes in refs. 7 and 8 vs 2 or 3 echoes in ref.9) and the FF obtained by MRS. However, we found only one report about the accuracy of determining the FF in the salivary glands using the 6-echo mDixon method with off-line image processing,10 while MRS evaluation of the salivary gland FF has not been reported.
Therefore, the objectives of this study were to estimate the salivary gland FF by the vendor-supplied mDIXON Quant method and the MRS method, and to analyse the correlation between these two methods in order to evaluate the efficacy of mDIXON Quant for assessing the fat fraction of the salivary glands because mDIXON Quant is more rapid than MRS and provides additional spatial localization data.
METHODS AND MATERIALS
The institutional ethics review board of Kyushu University Hospital (Fukuoka, Japan) approved this study (approval number 26080). 16 healthy volunteers were enrolled in this study (Table 1). We gave a verbal and written explanation of the purpose of the research, the details of the experiments, and possible adverse effects and risks to the volunteers before we obtained their informed consent. Four volunteers underwent two scans each to evaluate the scan–rescan reproducibility. The two examinations were performed within 3 months of each other.
Table 1.
Characteristics of the volunteer
| Number | 16 |
| Sex (male, female) | 9, 7 |
| Age (years) | 37.6 ± 10.0 |
| Height (cm) | 166.5 ± 9.7 |
| Weight (kg) | 61.4 ± 13.0 |
| BMI | 22.0 ± 3.3 |
BMI, body mass index.
MR imaging protocol
All MR examinations were done with a clinical 3T whole body MRI system (Ingenia 3.0 T; Philips Healthcare, Best, the Netherlands) using a head/neck coil and a torso coil. Two types of MRI sequences, mDIXON Quant and single voxel MRS (point resolved spectroscopy: PRESS), were employed to measure the FF in the parotid gland (PG) and the submandibular gland (SMG). In this preliminary study, we applied PRESS due to the high signal-to-noise ratio because the selected volumes of interest (VOIs) were much smaller than those used in previous liver studies. PRESS was performed with the following parameters: TR = 5000 ms, 1024 samples, spectral band width (Hz) = 2000 and readout duration = 512 ms. To avoid T1 saturation, a long TR of 5000 mswas applied.
A single TE with 50 ms was applied in all 16 volunteers (32PGs and 32SMGs), while multiple TEs were applied in 10 out of 16 volunteers to correct for T2 decay. To limit scanning time, only the right PG and right SMG (10 PGs and 8SMGs) were evaluated. VOIs were carefully positioned in the salivary glands and attention was paid to avoid partial volume contamination of the PG VOIs by the retromandibular vein. The outline of the region of interest (ROI) was set approximately 2 mm inside the border of the salivary gland to reduce contamination of the signal caused by shift of the excitation region between water and fat in the surrounding tissues.
The mDIXON Quant method employs a six-echo 3D gradient echo sequence and was performed with the following parameters: TR = 10 ms, TE1 = 1.3 ms, ΔTE = 1.0 ms, fly back = none, echo train length = 6, water fat shift = 0.309 pixels, FOV = 230 × 230 mm, acquisition matrix size = 1.5 × 1.5 mm, reconstruction matrix size = 0.6 × 0.6 mm, slice thickness = 2 mm and total imaging time = 2 min49 s. To avoid T1 saturation, a very low flip angle of only 3° was applied.
Data analysis
Calculation of FF by MRS
Determination of the FF by MRS requires estimation of the fat peak and water peak areas, as well as correction by the T2 value of each peak. To achieve accurate measurement, this should be done for all fat peaks, but quantification of small peaks is difficult and not so robust. We assumed that the 1.3 ppm peak accounted for 60% of the total fat peak, 1,8 and processing was done as follows.
Post-processing of the spectroscopic data acquired from each volunteer was performed with the vendor’s post-processing package. Phase adjustment was done manually, as was spectral shift of the display before integration. The major lipid peak (1.3 ppm) and water peak (4.7 ppm) integrals were obtained.
MRS with a single TE of 50 ms was performed in all 16 volunteers (32PGs and 32SMGs). From the data thus obtained, FF (1.3 ppm) TE50 was estimated using the following formula:
MRS with multiple TEs was performed in 10 volunteers (10 PGs and 8 SMGs) (Figure 1). The T2 relaxation times of the water and fat peaks were determined by separate mono-exponential fitting of the respective spectral line integrals, with the intercepts of the regression lines corresponding to the proton density of water or fat. Then the proton FF (1.3 ppm) was estimated with the following formula:
Figure 1.

Plots of TE series of PRESS-localized MR spectra (TR/TE1-55000/40, 50, 60, 70 and 80 ms from the volumes of interest. Both the water and fat peaks decrease along with an increase of TE, but the water peak shows more rapid attenuation than the fat peak.
Although we did not determine the ratio of the 1.3 ppm peak to the total fat peak, many reports have indicated that the 1.3 ppm peak accounts for approximately 60% of the total fat peak.1,8 Therefore, we assumed it was 60% and recalculated the FF (MRS all), which was defined as the gold standard.
Calculation of FF by the mDIXON Quant method
On mDIXON Quant images, VOIs were set on both sides of the PGs and SMGs using the FF map obtained with MRS to obtain the FF (mDIXON) of each VOI consistent with the VOIs on MRS images.
These procedures were performed by a single head and neck radiologist with 9 years of experience using ImageJ software (National Institutes of Health, Bethesda, MD) (Figure 2).
Figure 2.
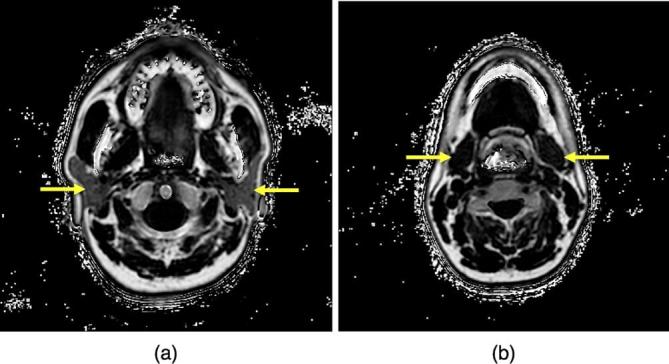
FF maps of the PG (a) and SMG (b) obtained by the mDIXON Quant method. (arrows) PG, parotid gland; FF, fat fraction; SMG, submandibular gland.
Statistical analysis
Single regression analysis and Bland-Altman plots were used for comparison of the different methods of calculating FF values. We performed linear regression analysis on all data from PGs and SMGs. The paired t-test was used for comparison between the T2 of the water peak (4.7 ppm) and that of the fat peak (1.3 ppm). Regarding the scan–rescan reproducibility, we calculated intraclass correlation coefficients (ICC). Analyses were performed with the JMP statistical software package (version 9.0.0; SAS Institute, Cary, NC).
RESULTS
The means and the standard deviations for the FF (%) and T2 values (ms) are summarized in Tables 2 and 3.
Table 2.
The means and the standard deviations for the FF (%) (single TE)
| F (%) | PG (n = 32) | SMG (n = 32) |
| MRS 1.3 ppm TE=50 | 30.0 ± 16.1 | 3.7 ± 2.9 |
| mDIXON | 30.7 ± 13.7 | 5.9 ± 4.9 |
FF, fat fraction; MRS, 1H−MR spectroscopy; PG, parotid gland; SMG, submandibular gland.
Table 3.
The means and the standard deviations (SD) for the FF (%) and T2 values (ms) (multiple TEs)
| FF (%) | T2 (ms) | |||||
| Salivary gland | Case No. | MRS 1.3 ppm with T2 correction | MRS all | mDIXON | water | fat |
| PG | 1 | 8.8 | 13.9 | 16.0 | 39.8 | 75.3 |
| 2 | 13.6 | 20.8 | 19.7 | 42.1 | 94.7 | |
| 3 | 30.7 | 42.4 | 49.5 | 35.8 | 92.2 | |
| 4 | 6.6 | 10.5 | 11.0 | 39.8 | 77.2 | |
| 5 | 6.9 | 10.9 | 15.6 | 35.2 | 79.2 | |
| 6 | 33.5 | 45.6 | 53.1 | 39.5 | 91.8 | |
| 7 | 12.1 | 18.6 | 17.5 | 32.4 | 90.9 | |
| 8 | 25.7 | 36.6 | 50.1 | 37.9 | 54.4 | |
| 9 | 15.0 | 22.8 | 33.4 | 53.4 | 86.1 | |
| 10 | 18.0 | 26.8 | 27.8 | 49.8 | 104.5 | |
| mean ± SD | 17.1 ± 9.7 | 24.9 ± 12.7 | 29.4 ± 16.2 | 40.6 ± 6.5 | 84.6 ± 13.9 | |
| SMG | 1 | 0.7 | 1.2 | 1.7 | 53.7 | 75.6 |
| 2 | 4.7 | 7.5 | 9.9 | 42.1 | 66.0 | |
| 3 | 2.2 | 3.6 | 3.8 | 52.9 | 80.1 | |
| 4 | 1.5 | 2.5 | 4.6 | 56.7 | 97.6 | |
| 5 | 5.9 | 9.5 | 14.6 | 46.4 | 75.6 | |
| 6 | 4.1 | 6.6 | 10.6 | 52.6 | 79.6 | |
| 7 | 1.8 | 2.9 | 2.9 | 63.6 | 73.8 | |
| 8 | 1.5 | 2.4 | 3.3 | 41.7 | 103.6 | |
| mean ± SD | 2.8 ± 1.9 | 4.5 ± 3.0 | 6.4 ± 4.7 | 51.2 ± 7.5 | 81.5 ± 12.7 | |
FF, fat fraction; MRS, 1H−MR spectroscopy; PG, parotid gland; SMG, submandibular gland.
With a single TE, the mean FF (%) obtained by MRS (1.3 ppm TE=50) was 30.0±16.1% in the PG and 3.7±2.9% in the SMG, while the results obtained with the mDIXON method were 30.7±13.7% and5.9±4.9%, respectively. There was no significant difference of FF (%) between the two groups (PG: p = 0.555, SMG: p = 0.106).
The salivary gland fat fraction showed a strong correlation between the mDIXON Quant method and the MRS (single TE) method (R2 = 0.960), with a slope (±standard deviation) of 0.900 ± 0.02 (p < 0.0001) and an intercept of 3.08 ± 0.56 (p < 0.0001) (Figure 3).
Figure 3.
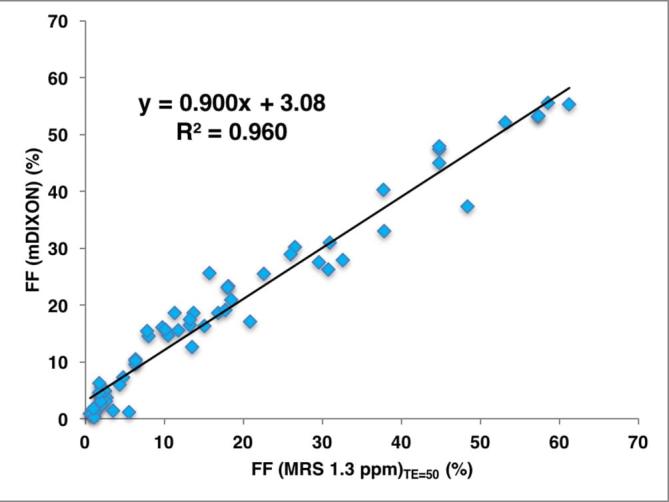
Correlation between FF (mDIXON) and FF (MRS 1.3 ppm)TE=50. Scatter plot displaying individual results and linear regression (solid line) with Pearson‘s correlation coefficient (R2 = 0.960), with a slope (±standard deviation) of 0.900 ± 0.02 (p < 0.0001) and an intercept of 3.08 ± 0.56 (p < 0.0001). FF, fat fraction; MRS, 1H−MR spectroscopy.
When PRESS was done with multiple TEs, the T2 value of the fat peak (1.3 ppm) was significantly higher than that of the water peak (Figure 4) (p = 0.000 (PG), p = 0.001 (SMG), paired t-test). After taking T2 decay into consideration, the mean FF (%) obtained by MRS (1.3 ppm with T2 correction) was 17.1±9.7% in the PG and 2.8±1.9% in the SMG. Moreover, when we assumed that the 1.3 ppm peak accounted for 60% of the total fat peak, MRS (all) was 24.9±12.7% in the PG and 4.5±3.0% in the SMG, while the mDIXON method gave values of 29.4±16.2% in the PG and 6.4±4.7% in the SMG. There was no significant difference between MRS (all) and MRS (mDIXON) (PG: p = 0.143, SMG: p = 0.195).
Figure 4.

T2 values of the water and fat peaks. In both the PG and the SMG, T2 values of the fat peak are longer than those of the water peak. PG, parotid gland; SMG, submandibular gland.
There was also a strong correlation between FF (mDIXON) and FF (MRS all) (R2 = 0.963), with a slope (±standard deviation) of 1.18 ± 0.06 (p < 0.0001) and an intercept of 0.487 ± 1.20(p = 0.6904) (Figure 5a). Bland-Altman plots showing the difference between them (Bias = 3.18, SD = 0.92, 95%confidenceinterval(CI)[1.24–5.12], p = 0.0029) (Figure 5b).
Figure 5.

(a) When the FF was recalculated after assuming that the methylene peak accounted for 60% of the total fat peak, there was a strong correlation between FF (mDixon) and FF (MRS all) (R2 = 0.963), with a slope (±standard deviation) of 1.18 ± 0.06(p < .0001) and an intercept of 0.487 ± 1.20 (p = 0.6904). (b) Bland-Altman plots showing the difference between them (Bias = 3.18, SD = 0.92, 95%CI[1.24–5.12], p = 0.0029). The dotted lines indicate±2 SD. FF, fat fraction; MRS, 1H−MR spectroscopy.
Regarding the scan–rescan reproducibility, the difference between two measurements of FF (MRS 1.3 ppm)TE50 was 1.05–1.3% (95%CI[−3.1–5.1]) and the difference between two measurements of FF (mDIXON) was 0.08–0.85% (95%CI[−2.6–2.7]). Furthermore, based on the number of ICC, the FF (MRS 1.3 ppm)TE50 ICC was 0.988 and mDIXON ICC was 0.998; so the reproducibility of these techniques was considered to be quite good.
DISCUSSION
There have been a few reports about proton density FF of the PG, which have demonstrated that the parotid fat content obtained using Dixon’s method is positively correlated with both age and BMI in healthy adults.11 However, to the best of our knowledge, only one attempt has been made to assess the feasibility of applying Dixon’s method to the salivary glands.10 Chang et al. compared FFs obtained by the T1 method, T2 method and Dixon method. With the T1 and T2 methods, they calculated the FF from the signal intensity ratio between non-fat-saturated images and frequency selective fat-saturated images, but this approach has the major drawback of being vulnerable to B0 and B1 inhomogeneity. MRS has not previously been employed for estimation of the salivary gland FF, although it has been identified as the gold standard for estimating hepatic FF. Therefore, we first performed PRESS to obtain gold standard data.
Although FF (mDIXON) and FF (MRS 1.3 ppm) were closely correlated without T2 correction, the T2 of the fat peak was much longer than that of the water peak in the multiple TE study, and the T2 values of both water and fat were similar to those previously reported for the liver.12
With T2 correction, FF (mDIXON) and FF (MRS 1.3 ppm) were also strongly correlated. While multipeak analysis is theoretically preferable to single-peak analysis, small peaks other than the main ethylene peak were difficult to quantify, especially with long TEs (Figure 1).
Kukuk et al8 determined FF values in patients with fatty liver by both the Dixon and MRS methods, and reported that a close correlation was noted between them and that the methylene peak was over 60% (0.62) of the total fat peak, while Hamilton et al1 obtained a value of 0.64. By assuming that the methylene peak accounted for 60% (0.6) of the total fat peak, we calculated the FF (MRS all) and defined it as the gold standard. FF (mDIXON) was strongly correlated with FF (MRS all) in our study (R2 = 0.963, slope = 1.18). The reason why the slope is 1.18 (more than 1) might be associated with the assumption that the methylene peak accounted for 60% of the total fat peak. Another likelihood is the problem associated with the fitting of MRS. Especially, the 5.3 ppm fat peak (-CH=CH-) and 4.2 ppm fat peak (-CH2-O-CO-) are affected by the water peak due to close proximity of the water peak.
Since the slope is 1.18, Bland-Altman plots showed a proportional bias. Moreover, it demonstrated that FF (mDIXON) was a little larger than FF (MRS all) in the small FF area, which may be associated with the effect of noise on the estimation of FF (mDIXON).6
In spite of such a discrepancy, the mDIXON Quant method is a sophisticated quantification method that provides both the FF and anatomical information. In addition, the reproducibility of this technique was considered to be quite good, because ICC was 0.998. Therefore, the mDIXON Quant method can potentially be employed for diagnostic imaging and it is considered to have a higher clinical usefulness than MRS.
The present study had several limitations. First, we performed MRS with fitting to a single fat peak (the methylene peak). In the future, we plan to use STEAM acquisition instead of PRESS, which will make it possible to employ shorter TEs and lessen the effect of J coupling.12
Second, shift of the excitation region between water and fat in the surrounding tissues causes contamination of the signal, but we set the ROI approximately 2 mm inside the border of the salivary gland to reduce such contamination and we considered that this effect was negligible.
Third, in this preliminary study, we combined the data for PGs and SMGs due to the small number of volunteers enrolled. However, the fat content of both glands is thought to be similar, so the effect of combining these data should be trivial. To clarify this point, further analysis will be needed in a larger number of subjects.
CONCLUSIONS
Taking into consideration T2 decay and the ratio of the 1.3 ppm peak to the total fat peak, we obtained the FF (MRS all) as a gold standard. FF (mDIXON) and FF (MRS all) values showed a strong correlation, with no significant difference between them. However, the Bland-Altman plot showed that FF (mDIXON) was slightly larger than FF (MRS all) when small FF areas were measured. Therefore, the mDIXON Quant method could be clinically useful for evaluating the salivary gland fat fraction, but the actual values need to be interpreted carefully.
Footnotes
ACKNOWLEDGMENTS: The authors acknowledge the support of Mr Takemura, radiological technologist at the Philips Electronics Japan.
FUNDING: This work was supported by JSPS KAKENHI Grant Number 15K20386 [Grant-in-Aid for Young Scientists (B)].
Contributor Information
Yoshitaka Kise, Email: kise@dpc.agu.ac.jp.
Toru Chikui, Email: chikui@rad.dent.kyushu-u.ac.jp.
Yasuo Yamashita, Email: yasuo-y@med.kyushu-u.ac.jp.
Koji Kobayashi, Email: kokoba@r-tec.med.kyushu-u.ac.jp.
Kazunori Yoshiura, Email: yoshiura@rad.dent.kyushu-u.ac.jp.
REFERENCES
- 1.Hamilton G, Yokoo T, Bydder M, Cruite I, Schroeder ME, Sirlin CB. et al. In vivo characterization of the liver fat ¹H MR spectrum. NMR Biomed 2011; 24: 784–90. doi: https://doi.org/10.1002/nbm.1622 [DOI] [PMC free article] [PubMed] [Google Scholar]
- 2.Georgoff P, Thomasson D, Louie A, Fleischman E, Dutcher L, Mani H, et al. Hydrogen-1 MR spectroscopy for measurement and diagnosis of hepatic steatosis. AJR Am J Roentgenol 2012; 199: 2–7. doi: https://doi.org/10.2214/AJR.11.7384 [DOI] [PMC free article] [PubMed] [Google Scholar]
- 3.Ligabue G, Besutti G, Scaglioni R, Stentarelli C, Guaraldi G. MR quantitative biomarkers of non-alcoholic fatty liver disease: technical evolutions and future trends. Quant Imaging Med Surg 2013; 3: 192–5. doi: https://doi.org/10.3978/j.issn.2223-4292.2013.08.01 [DOI] [PMC free article] [PubMed] [Google Scholar]
- 4.Izumi M, Eguchi K, Uetani M, Nakamura H, Takagi Y, Hayashi K, et al. MR features of the lacrimal gland in Sjögren’s syndrome. AJR Am J Roentgenol 1998; 170: 1661–6. doi: https://doi.org/10.2214/ajr.170.6.9609194 [DOI] [PubMed] [Google Scholar]
- 5.Takagi Y, Sumi M, Sumi T, Ichikawa Y, Nakamura T. MR microscopy of the parotid glands in patients with Sjogren’s syndrome: quantitative MR diagnostic criteria. AJNR Am J Neuroradiol 2005; 26: 1207–14. [PMC free article] [PubMed] [Google Scholar]
- 6.Reeder SB, Cruite I, Hamilton G, Sirlin CB. Quantitative assessment of liverfat with magneticresonanceimaging and spectroscopy. J Magn Reson Imaging 2011; 34: 729–49. doi: https://doi.org/10.1002/jmri.22580 [DOI] [PMC free article] [PubMed] [Google Scholar]
- 7. Hu HH, Kim HW, Nayak KS, Goran MI. Comparison of fat-water MRI and single-voxel MRS in the assessment of hepatic and pancreatic fat fractions in humans. Obesity 2010; 18: 841–7. doi: https://doi.org/10.1038/oby.2009.352 [DOI] [PMC free article] [PubMed] [Google Scholar]
- 8.Kukuk GM, Hittatiya K, Sprinkart AM, Eggers H, Gieseke J, Block W, et al. Compa rison between modified Dixon MRI techniques, MR spectroscopic relaxometry, and different histologic quantification methods in the assessment of hepatic steatosis. Eur Radiol 2015; 25: 2869–79. doi: https://doi.org/10.1007/s00330-015-3703-6 [DOI] [PubMed] [Google Scholar]
- 9.Kim H, Taksali SE, Dufour S, Befroy D, Goodman TR, Petersen KF, et al. Comparative MR study of hepatic fat quantification using single-voxel proton spectroscopy, two-point Dixon and three-point IDEAL. Magn Reson Med 2008; 59: 521–7. doi: https://doi.org/10.1002/mrm.21561 [DOI] [PMC free article] [PubMed] [Google Scholar]
- 10.Chang HC, Juan CJ, Chiu HC, Liu YJ, Cheng CC, Chiu SC, et al. Parotid fat contents in healthy subjects evaluated with iterative decomposition with echo asymmetry and least squares fat-water separation. Radiology 2013; 267: 918–23. doi: https://doi.org/10.1148/radiol.12112599 [DOI] [PubMed] [Google Scholar]
- 11.Chang HC, Juan CJ, Chiu HC, Cheng CC, Chiu SC, Liu YJ, et al. Effects of gender, age, and body mass index on fat contents and apparent diffusion coefficients in healthy parotid glands: an MRI evaluation. Eur Radiol 2014; 24: 2069–76. doi: https://doi.org/10.1007/s00330-014-3265-z [DOI] [PubMed] [Google Scholar]
- 12.Hamilton G, Middleton MS, Bydder M, Yokoo T, Schwimmer JB, Kono Y, et al. Effect of PRESS and STEAM sequences on magnetic resonance spectroscopic liver fat quantification. J Magn Reson Imaging 2009; 30: 145–52. doi: https://doi.org/10.1002/jmri.21809 [DOI] [PMC free article] [PubMed] [Google Scholar]