Abstract
The widespread use of abdominal imaging techniques has increased the detection of solid renal masses over the past years. Imaging plays a crucial role in the management and surveillance and in determining which lesions need treatment. The “classical angiomyolipoma” is the only benign solid renal mass that can be characterized with confidence by imaging through the detection of a fat-containing lesion without calcifications. There is a large overlap of imaging features between benign and malignant renal masses that often makes difficult a correct characterization of these lesions. In this review, we discuss the imaging features of the main solid renal masses that may suggest a likely benign diagnosis.
INTRODUCTION
The widespread use of abdominal imaging techniques over the past decades has led to an increase in diagnosis of incidental findings such as solid renal masses.1 These lesions are often identified as localized small lesions in asymptomatic patients and mostly treated with nephrectomy or partial nephrectomy. However, non-oncologic mortality in patients with small renal tumours has increased in the past years, thereby arguing for a reassessment of the current treatment strategy.2 Thus, imaging may play a crucial role in the management, surveillance and choice of lesions that need treatment.3 Ultrasound is useful to assess the cystic nature of the lesions, but it has low sensitivity for small masses and is operator dependent. CT is the imaging technique of choice for diagnosis and pre-operative evaluation of renal masses. MR may be helpful to better characterize such masses. The main objective of imaging is to detect the renal mass and to distinguish whether it could be benign or malignant. The first step is to evaluate if it is a true renal mass or a condition that may mimic it such as prominent column of Bertin, lobar dysmorphism, vascular anomaly or other findings that may cause a mass-like enlargement, such as trauma, haemorrhage, infarction and infection, which are usually associated with a particular clinical history. The second step is to determine whether the lesion is a cyst or not. Half of patients over the age of 50 years have at least a renal mass that is in most cases a simple cyst.3 Cysts usually have water attenuation with an attenuation value between 0 and 20 Hounsfield units (HU) on non-enhanced CT (NECT) and do not enhance after contrast administration. It is possible to see a “pseudoenhancement”, an increase in attenuation between 10 and 20 HU as a result of beam hardening, that is correlated with the central location and size (<1 cm).3,4 A solid renal mass with an attenuation value >20 HU on NECT can be benign or malignant. Many studies have shown that most renal cell carcinomas (RCCs) have attenuation between 20 and 70 HU on NECT, therefore an incidental detection of renal masses that contain non-calcified regions with HU values in this “danger zone” needs further investigation.5,6 Although renal masses that have a homogeneous density on NECT of >70 HU are haemorrhagic cysts in the 99% of cases, they may also have a density <70 HU.7 In this review, we discuss the imaging features of the main solid renal masses.
BENIGN RENAL MASSES
Angiomyolipoma
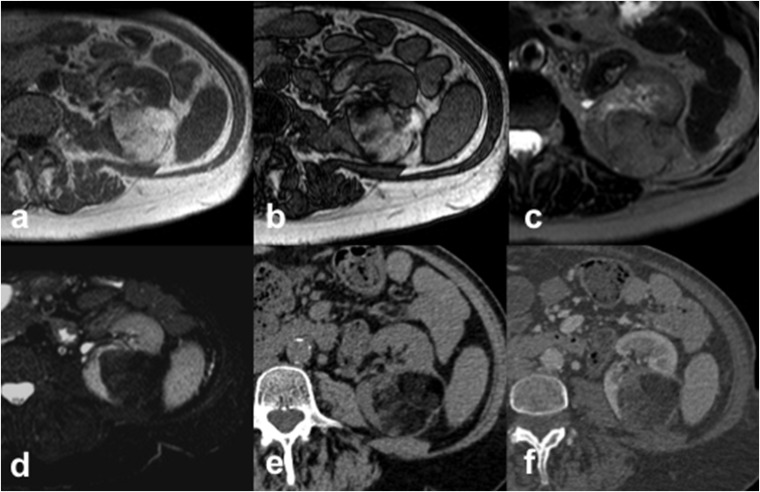
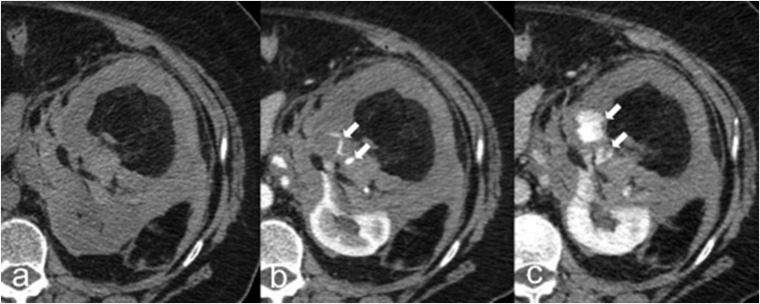
Angiomyolipoma (AML) is the most common benign solid renal neoplasm. 80% is sporadic, whereas 20% is associated with tuberous sclerosis or with lymphangioleiomyomatosis.8 AML belongs to the family of perivascular epithelioid cell tumours that are histologically composed of varying amounts of three elements: mature adipose tissue, dysmorphic blood vessels and smooth muscle components.9 The “classical AML” contains a significant amount of fat, and for this reason, it is markedly hyperechoic on ultrasound.10 However, a confident diagnosis requires the identification of fat through CT or MR; indeed, the RCC may be also hyperechoic on ultrasound. On NECT, fat areas within the lesions show attenuation value <−10 HU. MR is a useful technique to identify fat components of the lesions through frequency selective fat suppression and chemical shift suppression. However, the first may not detect small amounts of fat while chemical suppression MR cannot distinguish cells containing fat of clear cell RCC (ccRCC) from small amount of fat cells in AML.11 Conversely, the presence of “india ink artefact”, also called “black boundary artefact”, is indicative of AML. It is seen on chemical shift MR like an interface between AML and the kidney3,12 (Figure 1). Therefore, as well as AML, ccRCC can contain fat components, and most reported cases of ccRCC with intratumoural fat also contain calcifications. Thus, a confident diagnosis of AML requires that a fat-containing renal mass does not contain calcifications.11 Unfortunately, approximately 5% of AMLs are “fat-poor AML”.11 These AMLs show a small amount of fat that could not be detected using NECT or MR. For this reason, sometimes, it is necessary to perform a percutaneous biopsy or partial nephrectomy in order to obtain a correct diagnosis. Most fat-poor AMLs are hyperattenuating on NECT13 with washout kinetics after contrast agent administration and show T2 hypointensity on MR. Furthermore, chemical-shift MR is not useful to characterize these masses for the significant overlap with ccRCC.14 Several studies focused their attention in detection of microscopic fat through texture analysis, with mixed results; moreover, texture analysis is not widely available.15 A dangerous complication of AML is its spontaneous rupture with massive retroperitoneal haemorrhage, especially if the tumour is >4 cm16 (Figure 2). The tumour size is a good predictor of rupture but its specificity is not high, whereas intratumour vessel size has higher specificity with the same sensitivity of tumour size. Indeed, it is less likely that AMLs >4 cm with few and small vessels can spontaneously haemorrhage than those with multiple and large vessels with or without aneurysms (>5 mm).16 There is still a correlation between tumour size and intratumour vessel size, probably because the increased blood flow related to tumour growth leads to vessel dilatation and occurrence of aneurysms.16 Small AMLs usually do not require any treatment and imaging follow-up is recommended to assess their size changes, whereas larger ones can be embolized or surgically resected.11
Figure 1.
Angiomyolipoma (AML) in a 63-year-old female. Axial T1 weighted in-phase (a) and out-of-phase (b) gradient recalled echo images show an hyperintense left-renal AML with the presence of “india ink artefact”, seen as an interface between the AML and the kidney. The AML shows intermediate signal intensity on axial T2 weighted fast spin echo image (c) with a loss of signal on axial T2 weighted fat-saturated image (d). Axial CT images acquired before (e) and after (f) intravenous contrast administration demonstrate the typical features of AML appearing as a fat-containing renal lesion with no calcifications.
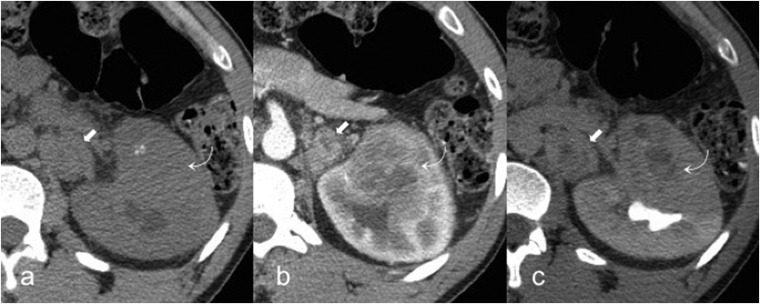
Figure 2.
Rupture of angiomyolipoma (AML) in a 66-year-old female. Axial unenhanced (a), corticomedullary phase (b) and nephrographic phase (c) CT images show a left-renal AML with intratumoural and perinephric high-attenuating material suggestive of haematoma caused by the rupture of the AML. Contrast-enhanced CT images (b–c) easily demonstrate the source of active bleeding (arrows).
Oncocytoma
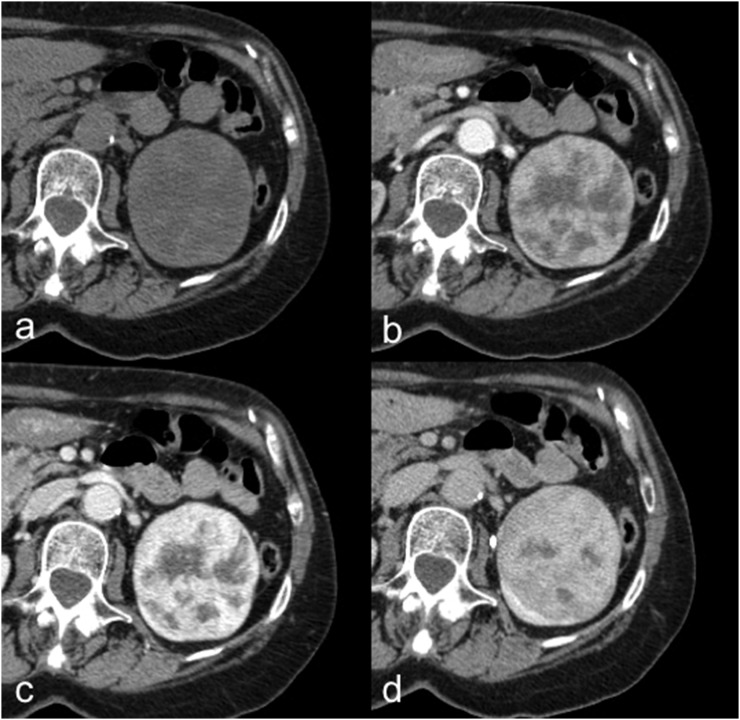
Oncocytoma is the second most common benign renal mass after AML, and it represents 3–7% of all renal tumours.17,18 Although it is a benign lesion, vascular invasion, generally considered a histological sign of malignancy, may be observed in <2% of excised oncocytoma specimens.19 In most cases, they are incidentally discovered and have peak incidence in the seventh decade of life.9 On ultrasound, it usually appears as solitary isoechoic or hypoechoic mass; a rich blood flow signal may be observed in the periphery of the mass using colour Doppler, whereas a strip-like blood flow signal can be found within the lesions.20 Contrast-enhanced ultrasound enables performance a real-time observation of tumour vascularization, and oncocytoma usually shows as early enhancement and a fast washout compared with the adjacent renal cortex.20 On CT, oncocytoma usually appears as a well-circumscribed lesion with homogeneous enhancement and a central stellate scar, without calcifications, necrosis or haemorrhage (Figure 3). All these imaging features are considered non-diagnostic for the significant overlap with RCC.21 On MR, oncocytoma appears as a well-defined homogeneously hypointense mass compared with the renal cortex on T1 weighted (T1w) sequences and isointense or hyperintense on T2 weighted (T2w) sequences; it depends on the differences in cellularity. CT and MR images acquired after contrast agent administration show homogeneous enhancement of the lesions.22 It is not easy to differentiate oncocytoma and ccRCC on the basis of contrast enhancement. Lee-Felker et al13 suggested the possibility to differentiate them on the basis of absolute de-enhancement from the corticomedullary to nephrographic phases and relative attenuation in the corticomedullary phase. However, they had a substantial overlap among the quantitative enhancement features of the lesions. The tumour perfusion can be assessed without intravenous contrast agent administration by using arterial spin-labelling (ASL) MRI.23 This technique uses blood as an endogenous contrast agent by labelling of the blood spins with radiofrequency pulses and gradient fields. The ASL MRI enables to determine tissue perfusion without any influence by vessel permeability, allowing to study patients with renal impairment.24 Previous studies demonstrated the extremely high perfusion of oncocytoma in comparison to ccRCC, chromophobe RCC (cRCC) and papillary RCC (pRCC), at ASL MRI. Nevertheless, controversial results in the differentiation of oncocytomas from other solid renal masses were achieved.25,26
Figure 3.
Oncocytoma in a 72-year-old female. Axial unenhanced (a), corticomedullary phase (b), nephrographic phase (c) and excretory phase (d) CT images show a well-circumscribed left-renal lesion with inhomogeneous enhancement and a central stellate scar, without calcifications, necrosis or haemorrhage.
The value of diffusion-weighted imaging (DWI) on oncocytoma is still debated. Previous studies demonstrated that it is not possible to distinguish oncocytoma from ccRCC using DWI.27 Indeed, these lesions show similar apparent diffusion coefficient (ADC) values, even if significantly higher than papillary pRCC and cRCC.27 However, a previous work evaluated the ADC values of solid renal masses at 3 T and demonstrated that oncocytoma has significantly higher ADC values than ccRCC.28 Moreover, oncocytoma may show slow growth not so different from RCC.29 Therefore, it is not easy to differentiate oncocytoma from RCC through imaging techniques, and for this reason, it is often necessary to perform biopsy.
MALIGNANT RENAL MASSES
Renal cell carcinomas
RCC is the most common malignant renal mass, representing >90% of all malignancies of the kidney and 2–3% of all cancers, with a peak incidence between the 60- and 70-year olds.9 The “classical triad” (haematuria, flank pain and palpable mass) is uncommon and observed only in advanced stage.1,9 Obesity, high blood pressure and tobacco smoking are the most important risk factors; some rare hereditary conditions such as von Hippel–Lindau disease and hereditary papillary RCC are correlated with RCC.1,9 Most patients are treated with nephron-sparing surgery or radical nephrectomy, although active surveillance may be an option for some older patients, especially suboptimal candidates for surgery with small renal tumours.1,17 There are several histological types of RCCs. The most common subtypes are ccRCC (70%), pRCC (10%) and cRCC (5%).9,30 The TNM classification is recommended in staging for both clinical and scientific use. The last version, published in 2009, was updated in 2012 (Table 1).18 Renal fat invasion is a relevant unfavourable prognostic factor (T3a) that increases the possibility of metastases because this area is rich in lymphatic and vascular structures. The diagnostic accuracy of CT to detect renal sinus fat invasion is poor, whereas it is higher for detecting perirenal fat invasion.31 However, tumour size >5 cm, irregular lesion margins, lymph node metastases and decreased perfusion of kidney are all predictive factors of renal sinus fat invasion.31 Moreover, the prognosis is strongly influenced not only by the TNM stage but also by the Fuhrman nuclear grade and the RCC subtype.18 To date, the tumour size is the most important predictor of malignancy and aggressive histological grade but with weaker evidence for association with overall survival.7 Furthermore, even if the rates of malignancy are comparable between positive-growth and zero-growth masses, usually no metastases develop in masses with zero-growth.32,33 Lastly, T1w hypointense RCCs have demonstrated to have less aggressive pathological features and favourable clinical behaviour compared with T1w isointense or T1w hyperintense RCCs.34 To better standardize and assess the anatomical complexity and operative outcomes of RCCs, different scoring systems have been reported: (i) the centrality index, (ii) radius, exophytic/endophytic, nearness, anterior/posterior and location and pre-operative aspects and dimensions used for anatomic classification scoring systems.35–37 The centrality index characterizes tumour centrality on the basis of distance between the tumour and kidney centre and tumour radius, whereas the radius, exophytic/endophytic, nearness, anterior/posterior and location and pre-operative aspects and dimensions used for anatomic classification scoring systems describe the tumour site, polarity, size and proximity to the collecting system.38
Table 1.
TNM classification system
| T—primary tumour |
|---|
| TX—primary tumour cannot be assessed |
| T0—no evidence of primary tumour |
| T1—tumour <7 cm in greatest dimension, limited to the kidney |
| T1a—tumour <4 cm in greatest dimension, limited to the kidney |
| T1b—tumour >4 cm but <7 cm in greatest dimension |
| T2—tumour >7 cm in greatest dimension, limited to the kidney |
| T2a—tumour >7 cm but <10 cm in greatest dimension |
| T2b—tumours >10 cm limited to the kidney |
| T3—tumour extends into major veins or perinephric tissues but not into the ipsilateral adrenal gland or beyond Gerota's fascia |
| T3a—tumour grossly extends into the renal vein or its segmental (muscle-containing) branches or invades perirenal and/or renal sinus fat (peripelvic) but not beyond Gerota's fascia |
| T3b—tumour grossly extends into the VC below the diaphragm |
| T3c—tumour grossly extends into VC above the diaphragm or invades the wall of the VC |
| T4—tumour invades beyond Gerota's fascia (including contiguous extension into the ipsilateral adrenal gland) |
| N—regional LNs |
| NX—regional LNs cannot be assessed |
| N0—no regional LN metastasis |
| N1—regional LN metastasis |
| M—distant metastasis |
| M0—no distant metastasis |
| M1—distant metastasis |
| TNM stage grouping |
| Stage I—T1 N0 M0 |
| Stage II—T2 N0 M0 |
| Stage III—T3 N0 M0 |
| T1, T2, T3 N1 M0 |
| Stage IV—T4 Any N M0 |
| Any T Any N M1 |
LN, lymph node; VC, vena cava.
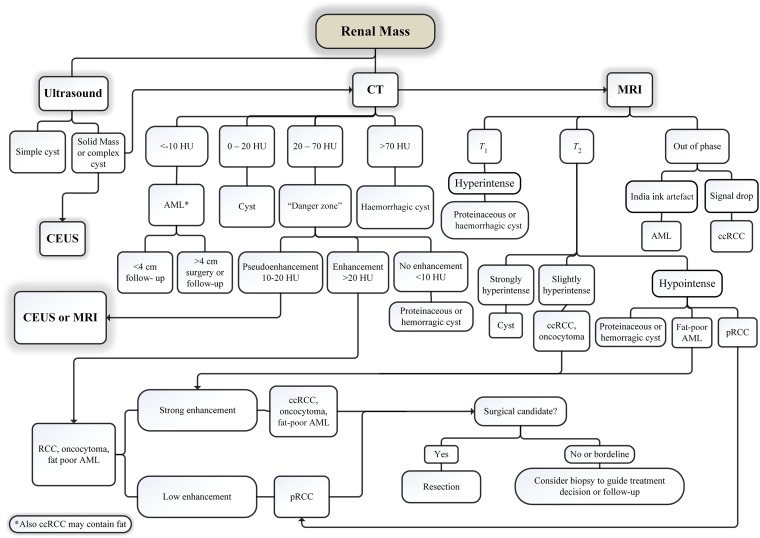
Figure 4 shows a diagnostic and management algorithm flowchart for renal masses incorporating ultrasound, CT and MR.
Figure 4.
A diagnostic and management algorithm flowchart for renal masses incorporating ultrasound, CT and MR. AML, angiomyolipoma; ccRCC, clear cell renal cell carcinoma; CEUS, contrast-enhanced ultrasound; pRCC, papillary renal cell carcinoma; RCC, renal cell carcinoma.
Clear cell renal cell carcinoma
The ccRCC is the most common histological subtype. It arises from the epithelium of the proximal convoluted tubules and represents approximately 70% of all RCCs.39 The sarcomatoid change can be observed in 5% of cases and is correlated with poor prognosis.9 Usually, ccRCC appears as a heterogeneous exophytic lesion on NECT for the presence of necrosis, haemorrhage, calcifications (observed in 10–15% of cases) or cystic components (observed in up to 15% of cases);39,40 moreover, it is rarely multicentric and bilateral (<5%).39 The strong and heterogeneous enhancement is helpful in distinguishing ccRCC from non-clear-cell subtypes. Usually, ccRCC demonstrates strong enhancement after contrast agent administration, with a peak in the corticomedullary phase showing an enhancement of >84 HU and >44 HU in the excretory phase (with a specificity of 100% and 91%, respectively).41 On MR, ccRCC usually appears hypointense or isointense on T1w images and iso- to hyperintense on T2w images, and it is possible to see a signal drop on opposed phase images for the presence of microscopic fat.42 The ccRCC may show T1w hyperintensity due to intralesional haemorrhage, and its differentiation from proteinaceous or haemorrhagic benign cysts may be challenging.43 In these cases, the evaluation of contrast enhancement based on image subtraction could be useful.26 The main limitation of image subtraction is its susceptibility to motion and other misregistration artefacts; moreover, it is a subjective assessment.26 Nevertheless, it should be performed to reduce the risk of misinterpretation of T1w hyperintense lesions. Previous studies on dynamic contrast-enhanced (DCE) perfusion MR have demonstrated that ccRCC has greater enhancement than the renal cortex in the corticomedullary phase with washout during the nephrographic phase, whereas pRCC enhances less than the renal cortex on both post-contrastographic phases.42 Perfusion measurements obtained through DCE MRI have also shown good results in the evaluation of histological grades of ccRCC.44 Lanzman et al25 found a relationship between ccRCC tumour size and maximum tumour perfusion, without any correlation with whole-tumour perfusion. These results were considered consistent with the presence of focal areas of intense angiogenesis coexisting with low-perfused areas or necrosis in the same tumour. Moreover, ASL MRI has shown to be useful in monitoring the response to antiangiogenic therapy and radiofrequency ablation in RCC.45,46
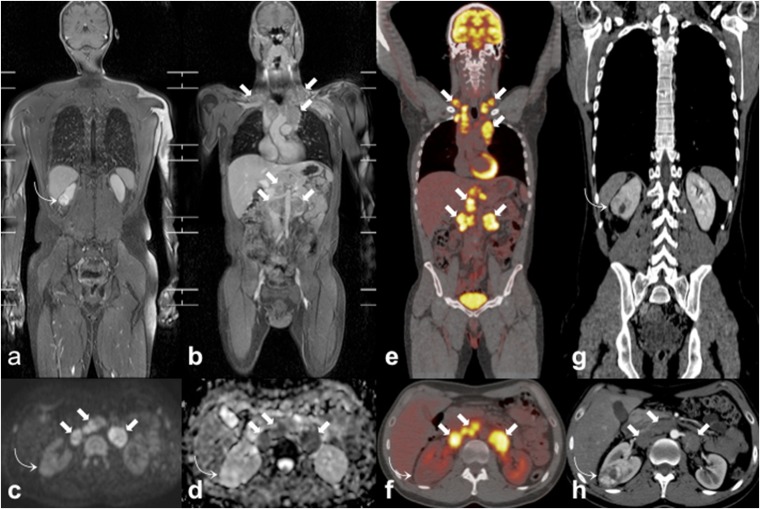
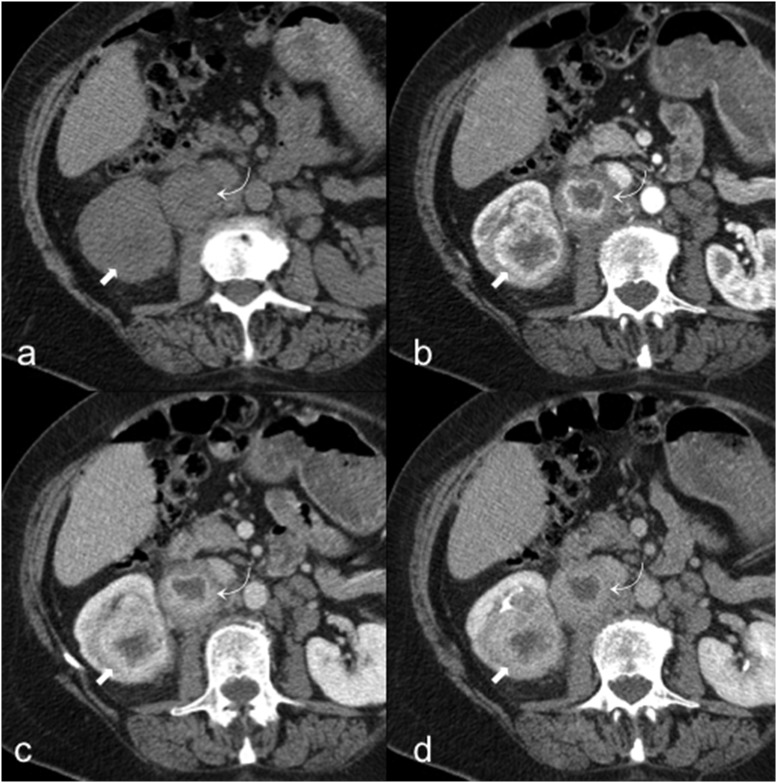
DWI may be useful to differentiate ccRCC from pRCC and cRCC; indeed, ccRCC shows higher ADC values. Furthermore, previous studies demonstrated that texture measures on ADC maps might help stage ccRCC non-invasively allowing the differentiation between low- and high-grade tumours.47 However, it is not easy to distinguish ccRCC from oncocytoma using DWI.27 Contrast-enhanced ultrasound is a good technique to demonstrate the perfusion characteristics of ccRCC. Its post-contrastographic pattern, in particular the homogeneity of enhancement and the presence of pseudocapsule sign, depends on the size of the lesion, owing to the presence of necrotic areas and small intratumoural cystic components in larger tumours.48 Some authors have reported a correlation between RCC and lymphoma, but this association is already not clear.49 It is well known that DWI enables to identify lymphomatous locations as lesions with very low ADC values.50 In our experience, we incidentally observed a solid renal mass with an unrestricted pattern of diffusion, whose biopsy revealed ccRCC, in a Hodgkin lymphoma patient who underwent a whole-body MR for staging (Figure 5). Whole-body MR is a well-established radiation-free technique in lymphoma imaging by now,51–53 but few studies have investigated its possible role in ccRCC management. Probably, the main concern is its accuracy in the detection of lung metastases,54 but it has already been demonstrated to be helpful in the follow-up of the pulmonary metastases from ccRCC.55 Patients with ccRCC have the highest risk of developing metastases. Approximately 18% of these patients are found to have metastases at diagnosis and > 50% will develop metastases during follow-up.56 The most common sites of metastases are the lung (69%), bone (43%), liver (34%), lymph node (22%), adrenal gland (19%) and brain (7%).30 Metastases usually enhance like the primary tumour, therefore ccRCC metastases are well detected on the arterial phase study56 (Figure 6). The recent use of new molecular therapies such as antiangiogenic agents with a more cytostatic than cytotoxic action makes a morphological evaluation of tumour response to therapy such as the Response Evaluation Criteria In Solid Tumors 1.1 inadequate to discriminate the progression or regression of disease. For this reason, it is necessary to apply new criteria such as attenuation, morphological and structural changes.56 The fluorine-18 (18F)-fludeoxyglucose positron emission tomography (PET)/CT has some limitations in the evaluation of urinary oncology diseases,57 and its low sensitivity in the identification of primary RCC is well known.58 However, the inhibitory effects on RCC from antiangiogenic agents can be identified with reduction in 18F-fludeoxyglucose uptake, probably related to reduction in glucose transporters.59 PET/CT with 18F-fluoromisonidazole enables the evaluation of hypoxia, which induces high secretion of the vascular endothelial growth factor and is a predictor of radio- and chemoresistance.60 A recent targeted imaging agent for PET/CT is the prostate-specific membrane antigen that seems to be highly reliable for the assessment of metastatic ccRCC.61 Another recent radiolabelled imaging agent for the evaluation of cellular proliferation is the 18F-fluorothymidine. It has been demonstrated to be useful for response assessment of treatment in metastatic RCC.62
Figure 5.
Incidentally discovered clear cell renal cell carcinoma (ccRCC) during the staging work-up of a 35-year-old male patient with Hodgkin lymphoma. Coronal whole-body MR three-dimensional fat-suppressed T1 weighted gradient recalled echo images after paramagnetic contrast administration (a, b) show an incidental right renal mass (curved arrows) and multiple enlarged lymph nodes (arrows) in bilateral supraclavicular, mediastinal and retroperitoneal regions. On axial high b-value diffusion-weighted imaging image (c) and axial apparent diffusion coefficient map (d), the ccRCC (curved arrows) does not show the restricted pattern of diffusion demonstrated by lymphomatous nodes (arrows). The ccRCC (curved arrow) also shows poor fluorine-18 fludeoxyglucose (18F-FDG) uptake on axial 18F-FDG positron emission tomography (PET)/CT (f) in respect of the locations of lymphoma (arrows) that are markedly 18F-FDG avid on coronal (e) and axial (f) 18F-FDG-PET/CT images. Coronal (g) and axial (h) portal-phase CT images demonstrate the high and inhomogeneous enhancement of the ccRCC (curved arrows) and the homogeneous and low enhancement of lymphoma (arrows).
Figure 6.
A 81-year-old male with clear cell renal cell carcinoma (ccRCC) and lymph nodal metastasis. Axial unenhanced (a), corticomedullary phase (b), nephrographic phase (c) and excretory phase (d) CT images show a right renal ccRCC (arrows) with inhomogeneous enhancement and peak on corticomedullary phase. Note also a lymph nodal metastasis in the right renal hilum (curved arrows) with the same enhancement of the ccRCC.
Papillary renal cell carcinoma
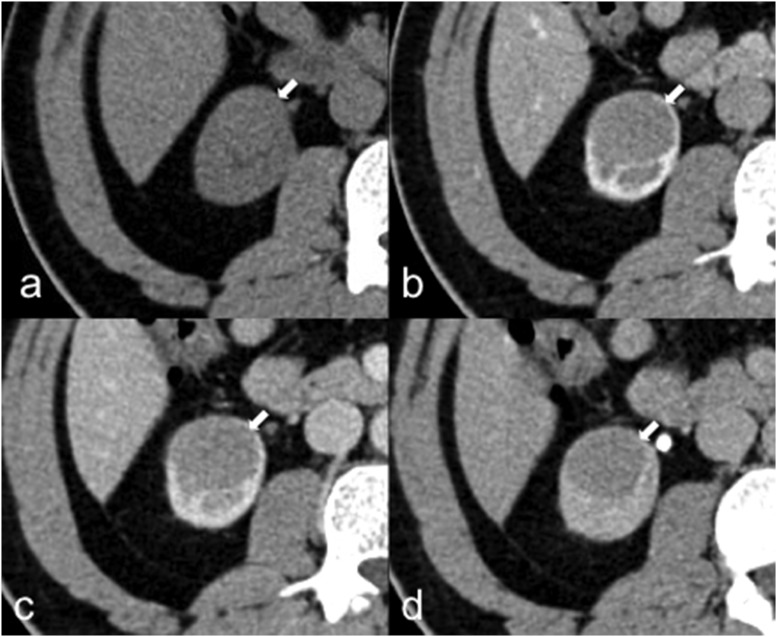
The pRCC is the second most common histological subtype. It arises from the epithelium of the proximal convoluted tubules and represents approximately 10% of all RCCs.9,63 It usually appears like a homogeneous mass; it may be heterogeneous when >3 cm for the presence of haemorrhage, calcifications or necrosis.64 It can be bilateral and multifocal more commonly than ccRCC, whereas the presence of macroscopic fat is very rare.63 There are two different types of pRCC: “Type 1” contains a monolayer of small cells with sparse cytoplasm and low-grade nuclei and is usually correlated with a better prognosis; “Type 2” is characterized by the presence of high-nuclear-grade cells with abundant eosinophilic cytoplasm and is correlated with a worse prognosis even than ccRCC.63,65 On CT, “Type 1” and “Type 2” pRCC appear similar, notably in the early stages, whereas in the advanced stage, “Type 2” pRCC usually displays indistinct margins, centripetal infiltration and tumour thrombi.65 Doshi et al66 demonstrated that MR quantitative features may also help differentiate between Type 1 and Type 2 pRCC, showing that ADC, half-fourier acquisition single-shot turbo spin-echo and contrast-enhanced entropy are greater in Type 2 pRCC. The pRCC tends to metastatize less frequently than ccRCC, and the most common sites of metastases are the brain and bone. Conversely, it is more frequent to observe lymph nodal metastasis in pRCC than in ccRCC, but nodal involvement is not correlated with a poorer prognosis in pRCC in contrast to ccRCC.67 The pRCC usually is more homogeneous and hypovascular than ccRCC. Indeed, pRCC enhances less and slower than ccRCC in post-contrastographic CT and MR phases (Figure 7). Furthermore, pRCC has a peak enhancement in the nephrographic phase images, whereas ccRCC has the peak in the corticomedullary phase.39,40 DCE MRI has shown to be a promising tool to differentiate pRCC from fat-poor AML, with pRCC showing a slower enhancement using a washin arterial index.42 The hypovascularity of pRCC, the potential pseudoenhancement of renal cysts and the eventual hyperdensity of complicated cysts on NECT may make differentiation of a renal cyst from a pRCC very hard; for this reason, it is recommended to use a small peripheral region of interest to assess the presence of enhancement.68 The high-contrast resolution of MR may be helpful in doubtful cases to differentiate cystic lesions from pRCC. On MR, pRCC usually shows as a pseudocapsule and appears hypointense on T1w and T2w images; a T2w hypointense solid renal mass is likely a pRCC or a minimal-fat AML, whereas ccRCC is hyperintense on T2w images.55,69 Regarding the possible role of ASL MRI, a potential limitation is the lower sensitivity for the evaluation of low perfused tissues in comparison to contrast-enhanced techniques. This might have some implications in the assessment of pRCC and cystic renal tumours.70
Figure 7.
A 40-year-old male with papillary renal cell carcinoma (pRCC). Axial unenhanced (a), corticomedullary phase (b), nephrographic phase (c) and excretory phase (d) CT images demonstrate a right-renal homogeneous mass (arrows) with poor and slow enhancement, typically observed in pRCC that is hypovascular in comparison with clear cell renal cell carcinoma.
Chromophobe renal cell carcinoma
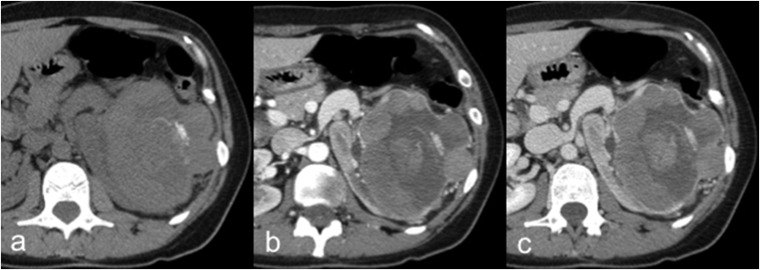
The cRCC is the third most common histological subtype, representing 5% of all RCCs, with the mean age of incidence in the sixth decade.9 It has the best prognosis of all RCCs with a 5-year survival rate of >90%. Nevertheless, cRCC has a malignant potential, and the liver is the common site of metastasis.34 On CT, cRCC may display a wide variability of features but usually appears as a well-circumscribed hypovascular and homogeneous solid mass with lower post-contrastographic enhancement than ccRCC.71 Intratumoural calcifications and cystic components are not common72 and one-third of cRCCs have a central scar or necrosis that are responsible for an inhomogeneous pattern and are associated with worse prognosis73 (Figure 8). On MR, it usually appears hypointense on T2w images and hypovascular in all post-contrastographic phases.17,39 Oncocytoma and cRCC have overlapping imaging features that are concordant with their similar pathological characteristics.74 Thus, there are no CT or MR features that enable to differentiate with certainty these two lesions.
Figure 8.
A 45-year-old female with chromophobe renal cell carcinoma (cRCC). Axial unenhanced (a), corticomedullary phase (b) and nephrographic phase (c) CT images show a large hypovascular and inhomogeneous left renal mass with intratumoural calcifications and necrotic areas. The cRCC usually demonstrates lower post-contrastographic enhancement than clear cell renal cell carcinoma.
Renal medullary carcinoma
The renal medullary carcinoma (RMC) is a rare subtype of RCC, mostly affecting patients between the second and the fifth decades.9 Its clinical presentation is usually abdominal pain, haematuria and weight loss. It is correlated almost exclusively with sickle-cell trait and with poor prognosis.9 For unknown reasons, haematuria is mainly observed when the tumour occurs in the left kidney.75 The primary lesion of RMC is located within the renal pelvis with an infiltrative grown pattern and satellite tumours within the renal cortex.76 The imaging features of RMC are not specific. On CT, it usually appears as an infiltrative heterogeneous mass due to the presence of intratumoural haemorrhage and necrosis, associated with caliectasis and extensive vascular and lymph node invasion39,77 (Figure 9). On MR, RMC is usually hypointense on T2w images and hypovascular in post-contrastographic images.39 The prognosis is severe and the median survival after surgical operation of the tumour is about 15 weeks.9 The most common metastatic sites are the lymph node, lung, adrenal gland and liver.78 RMC shares many histological features with collecting duct carcinoma, but the latter is not associated with sickle-cell trait and occurs in older males.75
Figure 9.
A 34-year-old male with renal medullary carcinoma and lymph nodal metastasis. Axial unenhanced (a), corticomedullary phase (b) and excretory phase (c) CT images show a left heterogeneous renal mass (curved arrows) with infiltrative grown pattern, ill-defined borders and intratumoural calcifications, associated with hilar lymph node invasion (arrows).
CONCLUSION
Although renal mass biopsy historically could show sampling errors, risk of seeding and of periprocedural complications, imaging-guided biopsy has led to obtain reliable percutaneous techniques with low risk of seeding and high rate of pathological diagnosis.79 To date, imaging has an important role in diagnosing, staging and follow-up of solid renal masses. The “classical AML” is the only benign renal mass that can be characterized with confidence by imaging with the detection of a fat-containing renal mass without calcifications. There is a large overlap of imaging features between benign and malignant renal masses that often makes very difficult a correct characterization of the lesions. However, it is possible to suggest a likely diagnosis based on imaging features.
Contributor Information
Massimo Galia, Email: mgalia@yahoo.com.
Domenico Albano, Email: albanodomenico@me.com.
Alberto Bruno, Email: bruno-alberto@hotmail.it.
Antonino Agrusa, Email: antonino.agrusa@unipa.it.
Giorgio Romano, Email: giorgio.romano@unipa.it.
Giuseppe Di Buono, Email: giu.dibuono@gmail.com.
Francesco Agnello, Email: fra.agnello@libero.it.
Giuseppe Salvaggio, Email: p.salvaggio@libero.it.
Ludovico La Grutta, Email: ludovicolagrutta@hotmail.it.
Massimo Midiri, Email: massimo.midiri@unipa.it.
Roberto Lagalla, Email: radpa@unipa.it.
REFERENCES
- 1.American Cancer Society. Cancer facts and figures 2016. Atlanta, GA: American Cancer Society; 2016. [Google Scholar]
- 2.Hollingsworth JM, Miller DC, Daignault S, Hollenbeck BK. Rising incidence of small renal masses: a need to reassess treatment effect. J Natl Cancer Inst 2006; 98: 1331–4. doi: https://doi.org/10.1093/jnci/djj362 [DOI] [PubMed] [Google Scholar]
- 3.Silverman SG, Israel GM, Herts BR, Richie JP. Management of the incidental renal mass. Radiology 2008; 249: 16–31. doi: https://doi.org/10.1148/radiol.2491070783 [DOI] [PubMed] [Google Scholar]
- 4.Tappouni R, Kissane J, Sarwani N, Lehman EB. Pseudoenhancement of renal cysts: influence of lesion size, lesion location, slice thickness, and number of MDCT detectors. AJR Am J Roentgenol 2012; 198: 133–7. doi: https://doi.org/10.2214/ajr.10.6057 [DOI] [PubMed] [Google Scholar]
- 5.Pooler BD, Pickhardt PJ, O'Connor SD, Bruce RJ, Patel SR, Nakada SY. Renal cell carcinoma: attenuation values on unenhanced CT. AJR Am J Roentgenol 2012; 198: 1115–20. doi: https://doi.org/10.2214/ajr.11.7587 [DOI] [PubMed] [Google Scholar]
- 6.O'Connor SD, Pickhardt PJ, Kim DH, Oliva MR, Silverman SG. Incidental finding of renal masses at unenhanced CT: prevalence and analysis of features for guiding management. AJR Am J Roentgenol 2011; 197: 139–45. doi: https://doi.org/10.2214/ajr.10.5920 [DOI] [PubMed] [Google Scholar]
- 7.Kang SK, Huang WC, Pandharipande PV, Chandarana H. Solid renal masses: what the numbers tell us. AJR Am J Roentgenol 2014; 202: 1196–206. doi: https://doi.org/10.2214/ajr.14.12502 [DOI] [PMC free article] [PubMed] [Google Scholar]
- 8.Avila NA, Kelly JA, Chu SC, Dwyer AJ, Moss J. Lymphangioleiomyomatosis: abdominopelvic CT and US findings. Radiology 2000; 216: 147–53. doi: https://doi.org/10.1148/radiology.216.1.r00jl42147 [DOI] [PubMed] [Google Scholar]
- 9.Eble JN, Sauter G, Epstein JI, Sesterhenn IA: World Health Organization classification of tumours: pathology and genetics of tumours of the urinary system and male genital organs. Lyon, France: IARC Press; 2004. [Google Scholar]
- 10.Siegel CL, Middleton WD, Teefey SA, McClennan BL. Angiomyolipoma and renal cell carcinoma: US differentiation. Radiology 1996; 198: 789–93. doi: https://doi.org/10.1148/radiology.198.3.8628873 [DOI] [PubMed] [Google Scholar]
- 11.Jinzaki M, Silverman SG, Akita H, Nagashima Y, Mikami S, Oya M. Renal angiomyolipoma: a radiological classification and update on recent developments in diagnosis and management. Abdom Imaging 2014; 39: 588–604. doi: https://doi.org/10.1007/s00261-014-0083-3 [DOI] [PMC free article] [PubMed] [Google Scholar]
- 12.Israel GM, Hindman N, Hecht E, Krinsky G. The use of opposed-phase chemical shift MRI in the diagnosis of renal angiomyolipomas. AJR Am J Roentgenol 2005; 184: 1868–72. doi: https://doi.org/10.2214/ajr.184.6.01841868 [DOI] [PubMed] [Google Scholar]
- 13.Lee-Felker SA, Felker ER, Tan N, Margolis DJ, Young JR, Sayre J, et al. Qualitative and quantitative MDCT features for differentiating clear cell renal cell carcinoma from other solid renal cortical masses. AJR Am J Roentgenol 2014; 203: W516–24. doi: https://doi.org/10.2214/AJR.14.12460 [DOI] [PubMed] [Google Scholar]
- 14.Hakim SW, Schieda N, Hodgdon T, McInnes MD, Dilauro M, Flood TA. Angiomyolipoma (AML) without visible fat: ultrasound, CT and MR imaging features with pathological correlation. Eur Radiol 2016; 26: 592–600. doi: https://doi.org/10.1007/s00330-015-3851-8 [DOI] [PubMed] [Google Scholar]
- 15.Yang CW, Shen SH, Chang YH, Chung HJ, Wang JH, Lin AT, et al. Are there useful CT features to differentiate renal cell carcinoma from lipid-poor renal angiomyolipoma? AJR Am J Roentgenol 2013; 201: 1017–28. doi: https://doi.org/10.2214/ajr.12.10204 [DOI] [PubMed] [Google Scholar]
- 16.Yamakado K, Tanaka N, Nakagawa T, Kobayashi S, Yanagawa M, Takeda K. Renal angiomyolipoma: relationships between tumor size, aneurysm formation, and rupture. Radiology 2002; 225: 78–82. doi: https://doi.org/10.1148/radiol.2251011477 [DOI] [PubMed] [Google Scholar]
- 17.Rosenkrantz AB, Hindman N, Fitzgerald EF, Niver BE, Melamed J, Babb JS. MRI features of renal oncocytoma and chromophobe renal cell carcinoma. AJR Am J Roentgenol 2010; 195: W421–7. doi: https://doi.org/10.2214/ajr.10.4718 [DOI] [PubMed] [Google Scholar]
- 18.Ljungberg B, Bensalah K, Canfield S, Dabestani S, Hofmann F, Hora M, et al. EAU guidelines on renal cell carcinoma: 2014 update. Eur Urol 2015; 67: 913–24. doi: https://doi.org/10.1016/j.eururo.2015.01.005 [DOI] [PubMed] [Google Scholar]
- 19.Ishigami K, Jones AR, Dahmoush L, Leite LV, Pakalniskis MG, Barloon TJ. Imaging spectrum of renal oncocytomas: a pictorial review with pathologic correlation. Insights Imaging 2015; 6: 53–64. doi: https://doi.org/10.1007/s13244-014-0373-x [DOI] [PMC free article] [PubMed] [Google Scholar]
- 20.Wu Y, Du L, Li F, Zhang H, Cai Y, Jia X. Renal oncocytoma: contrast-enhanced sonographic features. J Ultrasound Med 2013; 32: 441–8. doi: https://doi.org/10.7863/jum.2013.32.3.441 [DOI] [PubMed] [Google Scholar]
- 21.Sasaguri K, Takahashi N, Gomez-Cardona D, Leng S, Schmit GD, Carter RE, et al. Small (<4 cm) renal mass: differentiation of oncocytoma from renal cell carcinoma on biphasic contrast-enhanced CT. AJR Am J Roentgenol 2015; 205: 999–1007. doi: https://doi.org/10.2214/AJR.14.13966 [DOI] [PubMed] [Google Scholar]
- 22.Wobker SE, Przybycin CG, Sircar K, Epstein JI. Renal oncocytoma with vascular invasion: a series of 22 cases. Hum Pathol 2016; 58: 1–6. doi: https://doi.org/10.1016/j.humpath.2016.07.020 [DOI] [PubMed] [Google Scholar]
- 23.Lanzman RS, Wittsack HJ, Martirosian P, Zgoura P, Bilk P, Kröpil P, et al. Quantification of renal allograft perfusion using arterial spin labeling MRI: initial results. Eur Radiol 2010; 20: 1485–91. doi: https://doi.org/10.1007/s00330-009-1675-0 [DOI] [PubMed] [Google Scholar]
- 24.Pedrosa I, Rafatzand K, Robson P, Wagner AA, Atkins MB, Rofsky NM, et al. Arterial spin labeling MR imaging for characterisation of renal masses in patients with impaired renal function: initial experience. Eur Radiol 2012; 22: 484–92. doi: https://doi.org/10.1007/s00330-011-2250-z [DOI] [PubMed] [Google Scholar]
- 25.Lanzman RS, Robson PM, Sun MR, Patel AD, Mentore K, Wagner AA, et al. Arterial spin-labeling MR imaging of renal masses: correlation with histopathologic findings. Radiology 2012; 265: 799–808. doi: https://doi.org/10.1148/radiol.12112260 [DOI] [PMC free article] [PubMed] [Google Scholar]
- 26.Hecht EM, Israel GM, Krinsky GA, Hahn WY, Kim DC, Belitskaya-Levy I, et al. Renal masses: quantitative analysis of enhancement with signal intensity measurements versus qualitative analysis of enhancement with image subtraction for diagnosing malignancy at MR imaging. Radiology 2004; 232: 373–8. doi: https://doi.org/10.1148/radiol.2322031209 [DOI] [PubMed] [Google Scholar]
- 27.Hötker AM, Mazaheri Y, Wibmer A, Zheng J, Moskowitz CS, Tickoo SK, et al. Use of DWI in the differentiation of renal cortical tumors. AJR Am J Roentgenol 2016; 206: 100–5. doi: https://doi.org/10.2214/ajr.14.13923 [DOI] [PMC free article] [PubMed] [Google Scholar]
- 28.Agnello F, Roy C, Bazille G, Galia M, Midiri M, Charles T, et al. Small solid renal masses: characterization by diffusion-weighted MRI at 3 T. Clin Radiol 2013; 68: e301–8. doi: https://doi.org/10.1016/j.crad.2013.01.002 [DOI] [PubMed] [Google Scholar]
- 29.Siu W, Hafez KS, Johnston WK 3rd, Wolf JS Jr. Growth rates of renal cell carcinoma and oncocytoma under surveillance are similar. Urol Oncol 2007; 25: 115–19. doi: https://doi.org/10.1016/j.urolonc.2006.07.018 [DOI] [PubMed] [Google Scholar]
- 30.Ng CS, Wood CG, Silverman PM, Tannir NM, Tamboli P, Sandler CM. Renal cell carcinoma: diagnosis, staging, and surveillance. AJR Am J Roentgenol 2008; 191: 1220–32. doi: https://doi.org/10.2214/ajr.07.3568 [DOI] [PubMed] [Google Scholar]
- 31.Kim C, Choi HJ, Cho KS. Diagnostic value of multidetector computed tomography for renal sinus fat invasion in renal cell carcinoma patients. Eur J Radiol 2014; 83: 914–8. doi: https://doi.org/10.1016/j.ejrad.2014.02.025 [DOI] [PubMed] [Google Scholar]
- 32.Chawla SN, Crispen PL, Hanlon AL, Greenberg RE, Chen DY, Uzzo RG. The natural history of observed enhancing renal masses: meta-analysis and review of the world literature. J Urol 2006; 175: 425–31. doi: https://doi.org/10.1016/S0022-5347(05)00148-5 [DOI] [PubMed] [Google Scholar]
- 33.Smaldone MC, Kutikov A, Egleston BL, Canter DJ, Viterbo R, Chen DY, et al. Small renal masses progressing to metastases under active surveillance: a systematic review and pooled analysis. Cancer 2012; 118: 997–1006. doi: https://doi.org/10.1002/cncr.26369 [DOI] [PMC free article] [PubMed] [Google Scholar]
- 34.Doshi AM, Huang WC, Donin NM, Chandarana H. MRI features of renal cell carcinoma that predict favorable clinicopathologic outcomes. AJR Am J Roentgenol 2015; 204: 798–803. doi: https://doi.org/10.2214/ajr.14.13227 [DOI] [PubMed] [Google Scholar]
- 35.Simmons MN, Ching CB, Samplaski MK, Park CH, Gill IS. Kidney tumor location measurement using the C index method. J Urol 2010; 183: 1708–13. doi: https://doi.org/10.1016/j.juro.2010.01.005 [DOI] [PubMed] [Google Scholar]
- 36.Kutikov A, Uzzo RG. The R.E.N.A.L. nephrometry score: a comprehensive standardized system for quantitating renal tumor size, location and depth. J Urol 2009; 182: 844–53. doi: https://doi.org/10.1016/j.juro.2009.05.035 [DOI] [PubMed] [Google Scholar]
- 37.Ficarra V, Novara G, Secco S, Macchi V, Porzionato A, De Caro R, et al. Preoperative aspects and dimensions used for an anatomical (PADUA) classification of renal tumours in patients who are candidates for nephron-sparing surgery. Eur Urol 2009; 56: 786–93. doi: https://doi.org/10.1016/j.eururo.2009.07.040 [DOI] [PubMed] [Google Scholar]
- 38.Okhunov Z, Rais-Bahrami S, George AK, Waingankar N, Duty B, Montag S, et al. The comparison of three renal tumor scoring systems: C-Index, P.A.D.U.A., and R.E.N.A.L. nephrometry scores. J Endourol 2011; 25: 1921–4. doi: https://doi.org/10.1089/end.2011.0301 [DOI] [PubMed] [Google Scholar]
- 39.Dyer R, DiSantis DJ, McClennan BL. Simplified imaging approach for evaluation of the solid renal mass in adults. Radiology 2008; 247: 331–43. doi: https://doi.org/10.1148/radiol.2472061846 [DOI] [PubMed] [Google Scholar]
- 40.Prasad SR, Humphrey PA, Catena JR, Narra VR, Srigley JR, Cortez AD, et al. Common and uncommon histologic subtypes of renal cell carcinoma: imaging spectrum with pathologic correlation. Radiographics 2006; 26: 1795–806. doi: https://doi.org/10.1148/rg.266065010 [DOI] [PubMed] [Google Scholar]
- 41.Kim JK, Kim TK, Ahn HJ, Kim CS, Kim KR, Cho KS. Differentiation of subtypes of renal cell carcinoma on helical CT scans. AJR Am J Roentgenol 2002; 178: 1499–506. doi: https://doi.org/10.2214/ajr.178.6.1781499 [DOI] [PubMed] [Google Scholar]
- 42.Ramamurthy NK, Moosavi B, McInnes MD, Flood TA, Schieda N. Multiparametric MRI of solid renal masses: pearls and pitfalls. Clin Radiol 2015; 70: 304–16. doi: https://doi.org/10.1016/j.crad.2014.10.006 [DOI] [PubMed] [Google Scholar]
- 43.Davarpanah AH, Spektor M, Mathur M, Israel GM. Homogeneous T1 hyperintense renal lesions with smooth borders: is contrast-enhanced MR imaging needed? Radiology 2016; 281: 326. doi: https://doi.org/10.1148/radiol.2016164032 [DOI] [PubMed] [Google Scholar]
- 44.Palmowski M, Schifferdecker I, Zwick S, Macker-Goeppinger S, Laue H, Haferkamp A, et al. Tumor perfusion assessed by dynamic contrast-enhanced MRI correlates to the grading of renal cell carcinoma: initial results. Eur J Radiol 2010; 74: e176–80. doi: https://doi.org/10.1016/j.ejrad.2009.05.042 [DOI] [PubMed] [Google Scholar]
- 45.de Bazelaire C, Alsop DC, George D, Pedrosa I, Wang Y, Michaelson MD, et al. Magnetic resonance imaging-measured blood flow change after antiangiogenic therapy with PTK787/ZK 222584 correlates with clinical outcome in metastatic renal cell carcinoma. Clin Cancer Res 2008; 14: 5548–54. doi: https://doi.org/10.1158/1078-0432.ccr-08-0417 [DOI] [PubMed] [Google Scholar]
- 46.Boss A, Martirosian P, Schraml C, Clasen S, Fenchel M, Anastasiadis A, et al. Morphological, contrast-enhanced and spin labeling perfusion imaging for monitoring of relapse after RF ablation of renal cell carcinomas. Eur Radiol 2006; 16: 1226–36. doi: https://doi.org/10.1007/s00330-005-0098-9 [DOI] [PubMed] [Google Scholar]
- 47.Kierans AS, Rusinek H, Lee A, Shaikh MB, Triolo M, Huang WC, et al. Textural differences in apparent diffusion coefficient between low- and high-stage clear cell renal cell carcinoma. AJR Am J Roentgenol 2014; 203: W637–44. doi: https://doi.org/10.2214/ajr.14.12570 [DOI] [PubMed] [Google Scholar]
- 48.Jiang J, Chen Y, Zhou Y, Zhang H. Clear cell renal cell carcinoma: contrast-enhanced ultrasound features relation to tumor size. Eur J Radiol 2010; 73: 162–7. doi: https://doi.org/10.1016/j.ejrad.2008.09.030 [DOI] [PubMed] [Google Scholar]
- 49.Prando A, Prando D, Prando P. Renal cell carcinoma: unusual imaging manifestations. Radiographics 2006; 26: 233–44. doi: https://doi.org/10.1148/rg.261055060 [DOI] [PubMed] [Google Scholar]
- 50.Albano D, Patti C, La Grutta L, Agnello F, Grassedonio E, Mulè A, et al. Comparison between whole-body MRI with diffusion-weighted imaging and PET/CT in staging newly diagnosed FDG-avid lymphomas. Eur J Radiol 2016; 85: 313–18. doi: https://doi.org/10.1016/j.ejrad.2015.12.006 [DOI] [PubMed] [Google Scholar]
- 51.Albano D, Patti C, La Grutta L, Grassedonio E, Mulè A, Brancatelli G, et al. Osteonecrosis detected by whole body magnetic resonance in patients with Hodgkin Lymphoma treated by BEACOPP. Eur Radiol 2017; 27: 2129–36. doi: https://doi.org/10.1007/s00330-016-4535-8 [DOI] [PubMed] [Google Scholar]
- 52.Galia M, Albano D, Narese D, Patti C, Chianca V, Di Pietto F, et al. Whole-body MRI in patients with lymphoma: collateral findings. Radiol Med 2016; 121: 793–800. doi: https://doi.org/10.1007/s11547-016-0658-x [DOI] [PubMed] [Google Scholar]
- 53.Albano D, Patti C, Lagalla R, Midiri M, Galia M, Whole-body MRI, FDG-PET/CT, and bone marrow biopsy, for the assessment of bone marrow involvement in patients with newly diagnosed lymphoma. J Magn Reson Imaging 2017; 45: 1082–89. doi:https://doi.org/10.1002/jmri.25439 [DOI] [PubMed] [Google Scholar]
- 54.Albano D, La Grutta L, Grassedonio E, Patti C, Lagalla R, Midiri M, et al. Pitfalls in whole body MRI with diffusion weighted imaging performed on patients with lymphoma: what radiologists should know. Magn Reson Imaging 2016; 34: 922–31. doi: https://doi.org/10.1016/j.mri.2016.04.023 [DOI] [PubMed] [Google Scholar]
- 55.Liu J, Yang X, Li F, Wang X, Jiang X. Preliminary study of whole-body diffusion-weighted imaging in detecting pulmonary metastatic lesions from clear cell renal cell carcinoma: comparison with CT. Acta Radiol 2011; 52: 954–63. doi: https://doi.org/10.1258/ar.2011.110121 [DOI] [PubMed] [Google Scholar]
- 56.Brufau BP, Cerqueda CS, Villalba LB, Izquierdo RS, González BM, Molina CN. Metastatic renal cell carcinoma: radiologic findings and assessment of response to targeted antiangiogenic therapy by using multidetector CT. Radiographics 2013; 33: 1691–716. doi: https://doi.org/10.1148/rg.336125110 [DOI] [PubMed] [Google Scholar]
- 57.Alongi P, Caobelli F, Gentile R, Stefano A, Russo G, Albano D, et al. Recurrent bladder carcinoma: clinical and prognostic role of 18 F-FDG PET/CT. Eur J Nucl Med Mol Imaging 2017; 44: 224–33. doi: https://doi.org/10.1007/s00259-016-3500-8 [DOI] [PubMed] [Google Scholar]
- 58.Kang DE, White RL Jr, Zuger JH, Sasser HC, Teigland CM. Clinical use of fluorodeoxyglucose F 18 positron emission tomography for detection of renal cell carcinoma. J Urol 2004; 171: 1806–9. doi: https://doi.org/10.1097/01.ju.0000120241.50061.e4 [DOI] [PubMed] [Google Scholar]
- 59.Khandani AH, Rathmell WK. Positron emission tomography in renal cell carcinoma: an imaging biomarker in development. Semin Nucl Med 2012; 42: 221–30. doi: https://doi.org/10.1053/j.semnuclmed.2012.02.002 [DOI] [PMC free article] [PubMed] [Google Scholar]
- 60.Braunagel M, Graser A, Reiser M, Notohamiprodjo M. The role of functional imaging in the era of targeted therapy of renal cell carcinoma. World J Urol 2014; 32: 47–58. doi: https://doi.org/10.1007/s00345-013-1074-7 [DOI] [PubMed] [Google Scholar]
- 61.Rowe SP, Gorin MA, Hammers HJ, Som Javadi M, Hawasli H, Szabo Z, et al. Imaging of metastatic clear cell renal cell carcinoma with PSMA-targeted 18F-DCFPyL PET/CT. Ann Nucl Med 2015; 29: 877–82. doi: https://doi.org/10.1007/s12149-015-1017-z [DOI] [PMC free article] [PubMed] [Google Scholar]
- 62.Horn KP, Yap JT, Agarwal N, Morton KA, Kadrmas DJ, Beardmore B, et al. FDG and FLT-PET for early measurement of response to 37.5 mg daily sunitinib therapy in metastatic renal cell carcinoma. Cancer Imaging 2015; 15: 15. doi: https://doi.org/10.1186/s40644-015-0049-x [DOI] [PMC free article] [PubMed] [Google Scholar]
- 63.Vikram R, Ng CS, Tamboli P, Tannir NM, Jonasch E, Matin SF, et al. Papillary renal cell carcinoma: radiologic-pathologic correlation and spectrum of disease. Radiographics 2009; 29: 741–54; discussion 755–7. doi: https://doi.org/10.1148/rg.293085190 [DOI] [PubMed] [Google Scholar]
- 64.Herts BR, Coll DM, Novick AC, Obuchowski N, Linnell G, Wirth SL, et al. Enhancement characteristics of papillary renal neoplasms revealed on triphasic helical CT of the kidneys. AJR Am J Roentgenol 2002; 178: 367–72. doi: https://doi.org/10.2214/ajr.178.2.1780367 [DOI] [PubMed] [Google Scholar]
- 65.Yamada T, Endo M, Tsuboi M, Matsuhashi T, Takase K, Higano S, et al. Differentiation of pathologic subtypes of papillary renal cell carcinoma on CT. AJR Am J Roentgenol 2008; 191: 1559–63. doi: https://doi.org/10.2214/ajr.07.3181 [DOI] [PubMed] [Google Scholar]
- 66.Doshi AM, Ream JM, Kierans AS, Bilbily M, Rusinek H, Huang WC, et al. Use of MRI in differentiation of papillary renal cell carcinoma subtypes: qualitative and quantitative analysis. AJR Am J Roentgenol 2016; 206: 566–72. doi: https://doi.org/10.2214/ajr.15.15004 [DOI] [PubMed] [Google Scholar]
- 67.Margulis V, Tamboli P, Matin SF, Swanson DA, Wood CG. Analysis of clinicopathologic predictors of oncologic outcome provides insight into the natural history of surgically managed papillary renal cell carcinoma. Cancer 2008; 112: 1480–8. doi: https://doi.org/10.1002/cncr.23322 [DOI] [PubMed] [Google Scholar]
- 68.Rosenkrantz AB, Matza BW, Portnoy E, Melamed J, Taneja SS, Wehrli NE. Impact of size of region-of-interest on differentiation of renal cell carcinoma and renal cysts on multi-phase CT: preliminary findings. Eur J Radiol 2014; 83: 239–44. doi: https://doi.org/10.1016/j.ejrad.2013.10.020 [DOI] [PubMed] [Google Scholar]
- 69.Roy C, Sauer B, Lindner V, Lang H, Saussine C, Jacqmin D. MR imaging of papillary renal neoplasms: potential application for characterization of small renal masses. Eur Radiol 2007; 17: 193–200. doi: https://doi.org/10.1007/s00330-006-0271-9 [DOI] [PubMed] [Google Scholar]
- 70.Adey GS, Pedrosa I, Rofsky NM, Sanda MG, DeWolf WC. Lower limits of detection using magnetic resonance imaging for solid components in cystic renal neoplasms. Urology 2008; 71: 47–51. doi: https://doi.org/10.1016/j.urology.2007.09.016 [DOI] [PubMed] [Google Scholar]
- 71.Raman SP, Johnson PT, Allaf ME, Netto G, Fishman EK. Chromophobe renal cell carcinoma: multiphase MDCT enhancement patterns and morphologic features. AJR Am J Roentgenol 2013; 201: 1268–76. doi: https://doi.org/10.2214/ajr.13.10813 [DOI] [PubMed] [Google Scholar]
- 72.Zhang J, Lefkowitz RA, Ishill NM, Wang L, Moskowitz CS, Russo P, et al. Solid renal cortical tumors: differentiation with CT. Radiology 2007; 244: 494–504. doi: https://doi.org/10.1148/radiol.2442060927 [DOI] [PubMed] [Google Scholar]
- 73.Brinker DA, Amin MB, de Peralta-Venturina M, Reuter V, Chan DY, Epstein JI. Extensively necrotic cystic renal cell carcinoma: a clinicopathologic study with comparison to other cystic and necrotic renal cancers. Am J Surg Pathol 2000; 24: 988–95. doi: https://doi.org/10.1097/00000478-200007000-00010 [DOI] [PubMed] [Google Scholar]
- 74.Tickoo SK, Amin MB. Discriminant nuclear features of renal oncocytoma and chromophobe renal cell carcinoma: analysis of their potential utility in the differential diagnosis. Am J Clin Pathol 1998; 110: 782–7. doi: https://doi.org/10.1093/ajcp/110.6.782 [DOI] [PubMed] [Google Scholar]
- 75.Khan A, Thomas N, Costello B, Jobling L, deKretser D, Broadfield E, et al. Renal medullary carcinoma: sonographic, computed tomography, magnetic resonance and angiographic findings. Eur J Radiol 2000; 35: 1–7. doi: https://doi.org/10.1016/s0720-048x(99)00101-1 [DOI] [PubMed] [Google Scholar]
- 76.Davis CJ Jr, Mostofi FK, Sesterhenn IA. Renal medullary carcinoma: the seventh sickle cell nephropathy. Am J Surg Pathol 1995; 19: 1–11. doi: https://doi.org/10.1097/00000478-199501000-00001 [DOI] [PubMed] [Google Scholar]
- 77.Baig MA, Lin YS, Rasheed J, Mittman N. Renal medullary carcinoma. J Natl Med Assoc 2006; 98: 1171–4. [PMC free article] [PubMed] [Google Scholar]
- 78.Prasad SR, Humphrey PA, Menias CO, Middleton WD, Siegel MJ, Bae KT, et al. Neoplasms of the renal medulla: radiologic-pathologic correlation. Radiographics 2005; 25: 369–80. doi: https://doi.org/10.1148/rg.252045073 [DOI] [PubMed] [Google Scholar]
- 79.Wang R, Wolf JS Jr, Wood DP Jr, Higgins EJ, Hafez KS. Accuracy of percutaneous core biopsy in management of small renal masses. Urology 2009; 73: 586–90. doi: https://doi.org/10.1016/j.urology.2008.08.519 [DOI] [PubMed] [Google Scholar]


