

Abstract
Cancer cell invasion is an adaptive process based on cell-intrinsic properties to migrate individually or collectively, and their adaptation to encountered tissue structure acting as barrier or providing guidance. Whereas molecular and physical mechanisms of cancer invasion are well-studied in 3D in vitro models, their topographic relevance, classification and validation toward interstitial tissue organization in vivo remain incomplete. Using combined intravital third and second harmonic generation (THG, SHG), and three-channel fluorescence microscopy in live tumors, we here map B16F10 melanoma invasion into the dermis with up to 600 µm penetration depth and reconstruct both invasion mode and tissue tracks to establish invasion routes and outcome. B16F10 cells preferentially develop adaptive invasion patterns along preformed tracks of complex, multi-interface topography, combining single-cell and collective migration modes, without immediate anatomic tissue remodeling or destruction. The data suggest that the dimensionality (1D, 2D, 3D) of tissue interfaces determines the microanatomy exploited by invading tumor cells, emphasizing non-destructive migration along microchannels coupled to contact guidance as key invasion mechanisms. THG imaging further detected the presence and interstitial dynamics of tumor-associated microparticles with submicron resolution, revealing tumor-imposed conditioning of the microenvironment. These topographic findings establish combined THG, SHG and fluorescence microscopy in intravital tumor biology and provide a template for rational in vitro model development and context-dependent molecular classification of invasion modes and routes.
Keywords: third harmonic generation, second harmonic generation, tumor invasion, tumor microenvironment, microparticles, melanoma, myofiber, adipocyte, intravital multiphoton microscopy
Introduction
Tumor cell invasion into adjacent tissues is a key step of cancer cell dissemination toward locoregional and systemic metastasis. 1 , 2 Invasive migration of individual cells through 3D connective tissue depends upon a sequence of physicochemical steps that generate polarized cell interaction with the tissue substrate and force transmission. Actin-driven protrusion of the leading edge is followed by focalized cell-matrix adhesion, proteolysis of extracellular matrix constraints and actomyosin mediated contractions of the cell body, which together mediate a cycle of forward protrusion and rear retraction. 3 Besides individual cell migration, collective invasion of multiple cells occurs when moving cells maintain functional cell-cell adhesion, leading to a “supracellular” organization of the actin cytoskeleton and multicellular polarity, protrusion and traction force generation. 4 Single-cell and collective invasion are interconvertible, dependent on the up- or downregulation of cell-cell junctions and supracellular coordination; consequently, in cancer lesions invasion patterns range from broad multicellular masses with intact cell-cell connections to small multicellular files and fully individualized cells. 5
The cellular and molecular mechanisms driving different types of cancer invasion are commonly studied in vitro using reconstituted 2D or 3D environments with relatively uniform but controllable structural pattern and composition. 6 , 7 In connective tissue in vivo, tumor cells however face more complex and structurally heterogeneous 3D tissue architecture consisting of molecular and physical interfaces of different composition, length scale and stiffness, that provide space and guidance or act as a physical barrier and restrict cell motility. 8 , 9 Thereby, multiple cell and ECM parameters are integrated by migrating cells to determine type, direction, efficiency, and protease-dependence of migration. 5 , 8
Traditionally, the guidance mechanisms of cancer cell invasion are deduced from histological tissue samples or defined in vitro environments, resulting in the concepts of barrier function of connective tissue as well as its guidance principles. 5 , 10 In vitro models have allowed to establish the mechanisms of contact guidance, chemotaxis, guidance by gradients of adhesive substrates (haptotaxis) and substrate rigidity (durotaxis), and the de novo track generation by proteolytic remodeling of tissue structures. 3 , 11 , 12 In vivo, deduced from histopathological analysis of tumor samples, cancer invasion preferentially occurs along tracks of least resistance such as perineural, perimuscular and perivascular invasion, 9 however the relative contribution of molecular and biophysical guidance mechanisms, such as matrix guidance vs. barrier function, remain to be determined.
As complement to histological studies which provide a static and two-dimensional view on a dynamic and three-dimensional biological process and further suffers from structural artifacts due to tissue fixation and processing, intravital microscopy provides direct access to the three-dimensional cell and tissue morphology and function at cellular resolution and over time. Thereby, multiphoton-excited second and third harmonic imaging allows to visualize 3D topography of tissue structures 13 , 14 and delivers comprehensive insight into cell invasion and topographic guidance by tissues. 10 , 15 - 17 Second harmonic generation (SHG) results from the near-simultaneous arrival of two photons at dense, non-centrosymmetric structures to be combined into one emitted photon of half the wavelength. 14 , 18 In interstitial tissues, SHG is elicited by collagen fibers and striated muscle myosin, 18 detecting tumor-associated remodeling of collagen-rich ECM. 10 , 19 Third harmonic generation (THG) is sensitive to local differences in third-order nonlinear susceptibility, refractive index and dispersion, resulting in unification of three near-simultaneously arriving photons to one emitted photon of triple frequency. 20 In tissues, third harmonic signals are particularly generated by water-lipid or water-protein scaffold interfaces and media of optical heterogeneity, including lipid bodies, fat cells, nerve fibers as well as cell membranes and intracellular vesicles. 21 - 23 Similar to SHG, THG is a predominantly forward scattering signal, the optimized detection of which requires excitation by a strong pulsed infrared laser and forward detection, amenable to transparent samples or organisms including embryos of Zebrafish, Drosophila, C. elegans or mouse. 24 - 27 As caveat of THG imaging in thick and optically challenging samples, such as collagen-rich connective tissue and tumors, the high laser intensities required for backward detection of scattered signal may introduce phototoxicity and compromise cell and tissue function. Consequently, examples for backward THG in interstitial tissues are rare, except for imaging of thin or poorly absorbing samples, such as the mouse cremaster muscle, 22 lung surface 28 and mouse spinal cord 23 or brain tissue. 29 Thus, the potential of THG imaging in thick and scattering tissues and disease states, such as progressing tumors, remains uncertain.
Using infrared multiphoton microscopy (MPM), 30 we establish the efficacy and tolerability of backward THG compared with SHG and fluorescence detection in tumor-free and B16F10 melanoma-bearing tissue in live mice. The data establish THG as important complement to SHG and fluorescence imaging for the longitudinal monitoring of cancer biology in living tissue and the detection of migration-enhancing and –impeding tissue structures, particularly to tumor invasion routes, secondary tissue remodeling and microenvironment conditioning by microparticles.
Results
Model set up for backward third harmonic generation (THG) microscopy
A tandem near-infrared and infrared MPM set-up was used for simultaneous excitation of THG, SHG, and fluorophores GFP, E2-Crimson and AlexaFluor750 for both, forward and backward detection (Fig. 1A and B). To optimize THG efficacy, 3D collagen lattices containing homogeneously distributed single cells were used to detect backward and forward THG and SHG emission from collagen fibers and cells at increasing excitation power (Fig. 1B, left). THG and SHG emission were significantly stronger in forward compared with backward direction (SHG: ~5 times, THG: ~25 times) and showed respective third- and second order dependence (Fig. 1C), as described. 20 , 22

Figure 1. Beam path and efficiency of forward and backward third- and second-harmonic generation. (A) Beam path and main components of the multiphoton microscope including detectors (D) and numerical aperture (A). (B) Detection of THG and backward scattered emission from thick light-absorbing in vivo samples (right), compared with THG detection of most in vitro or thin ex vivo samples (left). (C) THG and SHG emission from mouse fibrosarcoma (MCA-101) cells embedded in collagen matrix, as a function of excitation power. Emission was detected in the forward (fwd) and backward (bwd) direction. To separate emission from the background, images were background subtracted and thresholded before the average intensity was calculated in regions of interest containing SHG or THG emitting structures (collagen, intracellular vesicles). THG emission showed best fit with a model function dependent on the third-order of the excitation power (reduced-Chi-sqr = 5 and 52 for forward and backward detection, respectively; dashed lines; 5% relative error in excitation power), whereas SHG emission showed best fit with second-order excitation (Chi-sqr = 0.58 and 360 for forward and backward detection, respectively). (D) THG and SHG excitation spectra of the structures of the mouse dermis in backward direction (compare to Fig. 3). Images were acquired using a custom Python script, controlling OPO wavelength, attenuator and tube lens settings to maintain constant excitation power (100 mW) and focal plane over the scanned wavelength range (1130–1220 nm). Curves were normalized to take fluctuations of the laser power into account.
To determine an optimized wavelength for simultaneous THG and SHG, excitation spectra were obtained by intravital imaging of mouse dermis at constant laser power (80 mW under the objective) and the backscatter of both signals was collected by rearward detection, showing peak efficacies at excitation with 1190 nm and 1130 nm wavelengths, respectively (Fig. 1D). The poor THG efficiency at emission wavelengths below 390 nm (corresponding to THG excitation wavelength of 1170 nm) is consistent with the limited UV transmission of barium fluoride glass components in the beam path. Because weak THG signals are rate-limiting in backward direction, 1180 nm excitation for highest THG efficacy was used subsequently. Signal selectivity and separation were verified by the narrow filter bandwidth (FF01 395/8 (THG) and FF01 593/11 (SHG) and by the type and topography of emitting structures (Fig. 1C; Vid. S1 ).
Backward THG imaging in vivo: Tissue penetration and phototoxicity
The invasion of B16F10 melanoma cells was monitored using the dorsal skin-fold chamber model for multiphoton-excited THG, SHG and fluorescence intensity detection in backward direction in established tumors. 16 Because surgery is performed only prior to tumor implantation but not required at the day of imaging, this model allows live-tumor observations without surgery-imposed disturbance of tissue anatomy including perfusion, cell viability and motility, and thus provides sufficient tissue stability for high-resolution time-lapse studies and particle-tracking.
To establish the depth efficacy of backward THG compared with SHG and NIR fluorescence (AlexaFluor750) detection in the mouse dermis, the respective intensities retrieved with increasing imaging depth were estimated from a deep z-stack reaching 870 µm into the dermis. THG was retrieved for a significant tissue volume, ranging from deep to mid dermis with peak intensities caused by dense collagen and a fat cell layer located at 500 to 600 µm and sufficient THG signal-to-noise ratio reached to 650 µm in depth (Fig. 2A; Vid. S1 ). Likewise, SHG and NIR fluorescence were retrieved with similar profile and maximum depths of up to 650 µm (Fig. 2A). Thus, despite its emission in the blue range which shows higher absorption by tissue structures compared with red signal, the sensitive setup allowed to detect backward THG at depths beyond 600 µm.

Figure 2. Depth efficiency and phototoxicity of backward THG. (A) THG, SHG and AlexaFluor750 signal intensity as function of depth obtained from a 870 µm deep z-stack into the mouse dermis (*, level of the cover glass above the tissue). Images were acquired with a z-resolution of 10 µm, excitation wavelength of 1180 nm and an excitation power of 150mW under the objective. Images were background subtracted and average intensity of THG/SHG or AlexaFluor750 signals over the z-profile was plotted. THG (cyan) was detected up to 650 µm, similarly to SHG (red) and AlexaFluor750 (yellow). (B) Representative time points of THG (cyan) and SHG (red) during time-lapse recording of dermal tissue [λ(excitation) = 1180nm; 110mW excitation power under the objective]. Z-scans of 80 µm tissue volume were acquired with z-steps of 5 µm and frame intervals of 60 sec (230 frames; 3.8 h observation period). Unperturbed tissue structures, including fat cells (asterisks), muscle fibers (arrowheads) and erythrocyte flow in capillaries (dotted line). (C) Erythrocyte flow (temporal color coded) morphology of adipocytes (asterisk). (a) Continuous exposure of small (60 µm × 70 µm) scan field for 60 frames (frame rate: 1.1/sec) at 1180nm excitation and 130mW excitation intensity. (b and c) Doubling of the frame rate (0.6/sec) followed by tissue damage, detected by swelling of adipocytes (asterisk) and intravascular coagulation and perturbed erythrocyte flow (arrowheads). Scale bars, 20µm.
Because of the high laser power required to obtain THG in backward direction (100 to 150 mW under the objective), we addressed the risk of laser-induced tissue damage using continuous exposure and time-lapse monitoring of potentially sensitive tissue structures, such as highly absorbing fat cells and capillaries. Using a typical time-lapse setting with 60 sec time interval between individual z-scans, tissue integrity remained unperturbed for a 3.8 h observation period (230 frames), including normal morphology of fat cells, collagen fibers and striated myofibers, as well as regular erythrocyte flow indicating lack of heat-induced blood clotting with erythrocyte stasis (Fig. 2B, Vid. S2 ). To test the toxicity limits of time-lapse THG microscopy, a small scan field was exposed to continuous scanning of the same focal plane (130 mW laser power under the objective; frame rate 1.1/sec). Regular erythrocyte flow persisted for 60 sec (60 frames), but with doubling of the frame rate (0.6/sec) tissue damage including swelling of fat cells (Fig. 2C, asterisk), intravascular coagulation and perturbed erythrocyte flow (Fig. 2C, arrowheads) were rapidly induced. Thus, with sufficient time intervals between individual imaging scans, even high infrared laser intensities required for generating backward THG are well tolerated by dermal tissues, whereas conditions requiring small imaging fields and continuous or high-speed exposure may be challenged by photodamage.
Interfaces of the tumor-free deep dermis
THG is an interface signal particularly suited to detect cell membranes and tissue discontinuities. 14 , 22 In the deep dermis of tumor-free mice, backward THG was generated by interfaces of cells and ECM while SHG was confined to fibrillar collagen and actomyosin structures, similar to mouse cremaster tissue. 22 With progressing imaging depth, tissue structures eliciting THG included the loose connective tissue of the deep dermis (Fig. 2A; Vid. S2 ), a muscle layer, perfused blood vessels and nerves of the mid-dermis (Fig. 3A), and adipocytes with adjacent collagen bundles of the upper mid-dermis (Fig. 3B). Strongest THG was elicited by thick collagen bundles (Fig. 3C and D), peripheral nerves (Fig. 3D), adipocytes (Fig. 3E), striated muscle fibers (Fig. 3F) and perfused blood vessels (Fig. 3F).

Figure 3. THG/SHG 3D reconstruction of tissue interfaces in native dermis. Backward THG/SHG were acquired at 1180nm excitation and 100–130mW laser intensity under the objective. THG was generated by cellular interfaces of fat cells (A, B and E); flowing erythrocytes labeling perfused blood vessels (A and B; arrowheads); cell bodies interspersed in loose connective tissue (C; arrowheads); matrix interfaces including collagen fiber bundles (C and D); peripheral nerves (A, D); striated muscles (F) and outer membranes of myofibers (F; arrowhead). SHG was confined to collagen bundles (A, B and D) and striated muscle fibers (A and F). Combined THG/SHG revealed tissue tracks and spaces available for tumor cell invasion (examples highlighted in C-F as dotted lines). Scale bars, 50µm. F, fat cells; m, myofiber; n, nerve; c, collagen.
Combined with SHG and fluorescence signal, THG delivered quantitative information on the 3D anatomy of connective tissue, including pre-existing tissue tracks and barriers that may impact tumor cell invasion. Collagen networks were heterogeneous in organization, including randomly organized loose collagen networks (Fig. 3C; space diameter up to 30 µm) and aligned and more densely structured collagen bundles bordered by longitudinal, fissure-like tracks (Fig. 3D; 5–10 µm diameter). Spaces between fat cells included interspersed collagen bundles and showed heterogeneous widths, ranging from narrow clefts (1–2 µm) to wider gaps (up to 10 µm in cross-section) (Fig. 3E). Perineural tracks defined by nerve strands eliciting strong THG and adjacent collagen bundles generating both SHG and THG were linear in shape with 2–5 µm in diameter (Fig. 3D). Similar longitudinal interface signals were present along and between myofibers, revealing narrow tracks (up to 5 µm in cross-section) or imposing as interface signal without apparent track lumen (Fig. 3F, dotted lines). Thus, complementary THG/SHG imaging allows detailed 3D reconstructions of anatomic tissue structures and interfaces, suggesting a constitutive range of collapsed and non-collapsed tracks.
Interfaces guiding invasion of B16F10 melanoma cells
B16F10 melanoma tumors expressing a mixture of H2B-eGFP single and H2B-eGFP/E2-Crimson double positive cells ( Fig. S1A ) were implanted in the dorsal skin-fold chamber and growth and invasion dynamics were monitored over up to 13 d. The growth curve of the main tumor, after an initial lag phase of 2 to 3 d, showed exponential growth starting day 4–5, (Fig. 1A)as described for other tumor types. 16 The onset of invasion was observed in most tumors 1 to 4 d after implantation, resulting by day 8 in multicellular elongated strands of up to 120 densely arranged cells with several hundred micrometer in length (Fig. 4B). Dependent on the guiding tissue structures, two types of collective invasion were observed, (1) linear multicellular files headed by one or two leading tip cells (Fig. 4A-D), and (2) broad collective invasion zones lead by multiple tip cells (Fig. 4E).

Figure 4. B16F10 melanoma invasion along dermal tissue interfaces. (A) B16F10 tumor volume growth over time. Error bars, mean ± SD (n = 8). (B) File-like collective invasion of mosaic tumors (compare to Fig. S2 ) into the deep dermis. Invasion strands progressed on average 70 µm/d (right graph) and appeared as coherent and tightly organized cell strains of near-constant diameter, except for occasional detachment of single cells or small cell files at the tip of the strands (B, inset). (C) Time-lapse microscopy and single-nucleus tracking show high intra-strand dynamics in rearward and forward direction (a) with median velocities of 0.25 µm/min (b). During migration individual tumor cells remained within the 3D spaces defined by tissue interfaces (C, dotted lines) with leading edges strongly adapted to tissue confinement (D and E; dotted lines). Linear, aligned tracks along muscle fibers and nerves guiding file-like collective invasion (D), while irregular shaped spaces within fat tissue supported broad and diffusely organized collective invasion patterns (E). Invading tip cells preferentially moved along tissue interfaces such as linear perimuscular (F; dotted lines) and perineural (G; dotted lines) tracks, and irregular trails consisting of adipocyte interfaces (H) or collagen fiber networks (I). Cell body adapting to existing matrix spaces (F–I; arrowheads). Backward THG/SHG, E2-Crimson and AlexaFluor750 were excited with 1180nm (100–130mW), eGFP was excited with 910nm (20–40 mW). Color scale: yellow, E2-Crimson (tumor cytoplasm); blue, histone-2B/eGFP (tumor nuclei); green, AlexaFluor750 (blood vessels); red, SHG; cyan, THG. Scale bars, 50 µm.
Linear invasion strands were composed of coherent, tightly organized cell strains of uniform 3–5 cells in diameter, consistent with collective invasion,16 and detachment of single cells or small cell files was observed at the tips of a subset of invasion strands (Fig. 4B, inset). Despite their compact organization, time-lapse recording and single-cell tracking revealed high intra-strand dynamics of individual B16F10 cells within multicellular strands maintaining median velocities of 0.25 µm/min in forward and, occasionally, rearward direction (Fig. 4C; Vid. S3 ). Thereby, linear invasion strands recapitulated the orientation of confined 3D spaces present in the tissue, particularly aligned muscle fibers, small blood vessels, and perineural tracks detected by THG/SHG (Fig. 4D). Perimuscular invasion followed the outline of myofibers precisely, often accompanied by tumor cell deformation to adapt to the given narrow tracks between adjacent myofibers or myofiber and blood vessel (Fig. 5A). Occasionally, invading tumor strands entirely wrapped around the complete circumference of the myofiber with the nuclei in outward direction and inward-oriented cell extensions, consistent with cell polarization toward the myofiber interface (Fig. 4F; Fig. S2B) . Remarkably, melanoma-cell containing paths were thereby widened to a caliber of 1 to 3 cells without apparent destruction of muscle integrity (Fig. 4D and F). Likewise, perineural space guided linear tumor cell strands with tumor cells oriented between lining collagen bundles and the nerve fiber, resulting in thin files (Fig. 4G, dotted line).
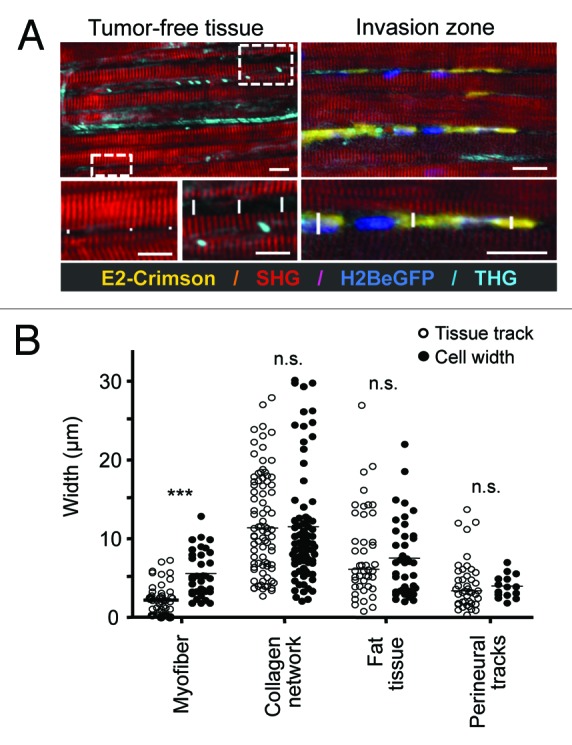
Figure 5. Quantification of native tissue spaces and tumor cell adaptation to pre-existing tissue tracks. (A) The diameter of tumor-free tissue tracks quantified from THG and SHG imaging (left) was compared with the diameter of invading cells, visualized by fluorescence of the cytoplasm and/or the nucleus. As example, perimuscular invasion is shown. Scale bar: 20µm. (B) Diameters of THG-/SHG-negative spaces and tracks in native, tumor-free tissue, compared with the diameter of tumor cell bodies during invasion. Tracks along myofibers were significantly widened by tumor cell infiltration (two-tailed Mann-Whitney test; *** = p < 0.0001), while all other tissue tracks maintained their original dimensions and required tumor cell adaptation (n.s., not significant). For each condition, at least three independent tissue samples were quantified.
Diffuse collective invasion into the irregular spaces of fat tissue and collagen networks consisted of two morphological zones. First, multiple “leader” cells formed an invasive front infiltrating with thin lamella-like protrusions along the interfaces between adipocyte surfaces and adipocyte and collagen bundles (Fig. 4H, arrowheads). This invasion front was followed by a broad multicellular mass which surrounded adipocytes and concomitantly widened existing spaces without obvious adipocyte destruction, but the SHG signal of collagen bundles between adipocytes somewhat weakened (Fig. 4E).
A similar diffuse invasion with often single-cell or loosely connected multicellular pattern occurred along and into collagen networks, characterized by a broad, loosely interconnected leading edge of multiple tip cells followed by a multicellular group, aligned parallel to collagen fibers (Fig. 4L; Fig. S2 ). When encountering narrow pores in the collagen network, cells deformed and adapted their shape to the given trail diameters (Fig. 4L).
To estimate the reciprocal adaptation of tumor cells and tissue tracks and obtain insight into the extent of tissue remodeling secondary to invasion, track widths in tumor-free tissues, i.e., before invasion, were compared with the diameter of invading B16F10 cells, as measured for the space consumed between tissue boundaries (Fig. 5A). Near-identical constitutive track widths and diameters of infiltrating tumor cell bodies were found for collagen networks, perineural and adipose tissue invasion, suggesting lack of microscopic tissue deformation or degeneration at leading fronts of invasion (Fig. 5B). In contrast, track widening by 5 to 10 µm was detected for perimuscular invasion, suggesting either proteolytic degradation of boundaries or non-proteolytic track widening by passive by outward pushing and space expansion. Cell diameters were largely unaltered in loose collagen tissue, besides occasional cell bodies squeezing through narrow matrix pores resulting in localized cell deformation (Fig. 4L, arrowhead; 2–5 µm in cross-section). Likewise, perimuscular, perineural, and fat tissue invasion resulted in similar deformation of cell bodies with diameters of cell bodies ranging from 3–10 µm (Fig. 5B). Thus, SHG/THG imaging of tissue scaffolds, together with fluorescence detection of cell body and nucleus allow to establish a quantitative map of constitutive tissue tracks before and during cell invasion. The data suggest that the leader cells of collective tumor invasion preferentially exploit pre-existing tissue tracks and adapt their shape to the space available; thereby perimuscular tracks receive minor and other tracks no widening, without evidence for large-scale de-novo track generation or tissue destruction.
Conditioning of the tumor microenvironment by microparticles
Whereas little immediate remodeling of tissue structures was noted during invasion, THG revealed altered tissue composition via strongly THG-positive tumor-associated microvesicles or microparticles. Using THG as measure, the size of microparticles ranged from below 1 µm in diameter (corresponding to 1–2 pixels in lateral diameter) to larger particles of up to 8 µm in diameter (Fig. 6A, B). In the B16/F10 live-cell models in vitro and in vivo, microparticles commonly lacked cytosolic fluorescence of E2-Crimson, in contrast to intact cells, larger macroaggregates and cell debris ( Figs. S3, S4 and Vid. S6 ). Microvesicles are shed from a variety of cells including tumor cells during invasion 31 (data not shown), and have been implicated in intercellular communication, with variable function depending on the cellular origin and cargo contained. 32 To monitor the kinetics of microparticles in vivo, time-lapse microscopy was performed and the diffusion dynamics of THG-positive particles were compared with marker regions of the SHG-positive collagen network (Fig. 6A). Tracking of microparticle mobility showed at last three distinct subsets, including non-moving, randomly moving and directionally moving particles (Fig. 6C). The velocity and diffusion constant distributions of mobile THG-positive particles (filled bars) exceeded the dynamics of collagen reference points (open bars) reaching velocities of 9 µm/h, whereas a subset of particles showed overlapping velocity and diffusion constant consistent with immobilization (Fig. 6C and D). These observations suggest that the majority of THG-positive microparticles are mobile and independent of small tissue drifts which are intrinsic to live-tissue dynamics during intravital microscopy. These mobility characteristics of THG-positive particles showed regional variability suggesting that either random or directional movement, or immobilization depend upon properties of tissue micro-regions (Fig. 6A and C), the diverging nature of which remain to be identified. Thus, THG is suited to visualize the dynamics of tumor-associated microparticles in vivo, including locally tethered and slowly drifting subsets.

Figure 6. In vivo detection of microparticle location and dynamics. (A) Overview of THG emitting randomly distributed microparticles (white arrowheads) and aggregated, likely intracellular vesicles (asterisks) detected at the border of a B16F10 tumor (d13) nearby collagen fiber-containing stroma. (B) The distribution of particle sizes determined from the cross-section of the THG signal. (C) Representative tracks of individual microparticles over 49 frames (98 min) showed subpopulations of immobilization (x, immobilized on cells or on collagen fibers), or random or directed diffusion kinetics. (D) Distribution of microparticle velocities (gray bars, 82 trajectories) relative to the distribution of velocities of individually tracked marker regions on collagen fibers (empty bars, 137 trajectories). (E) Logarithmic distribution of diffusion constant of individual trajectories from microparticles (gray bars) and second harmonic generating spots on collagen fibers (empty bars). Bars, 50µm (left image) or 5µm (right images and trajectories).
Discussion
Multimodal multiphoton microscopy combining THG, SHG and fluorescence intensity detection allows structure-function studies of cancer cell invasion in non-processed, live tissue with high penetration depth, submicron resolution and acceptable toxicity. Thereby, SHG excited by non-centrosymmetric structures, including collagen and striated actomyosin, and THG elicited by cell and tissue interfaces, including adipocytes, nerve fibers, perfused blood vessels, collagen fiber bundles, and cell-derived particles deliver complementary read-out of the native tissue anatomy and function. While THG was previously used in thin transparent samples and organisms, 22 we show here the strengths of backward THG in collagen-rich, optically dense and scattering tissue reaching detection depths similar to SHG and NIR fluorescence. Combined THG/SHG/fluorescence imaging provides yet unprecedented 3D insight into the tissue structures guiding tumor-cell invasion and the kinetics of tumor-cell derived microparticles.
Cancer invasion into interstitial tissue is thought to require proteolytic degeneration of tissue barriers and to ultimately cause tissue destruction, consistent with upregulation of MMPs and extensive tissue remodeling detected upon histopathological analysis of advanced lesions. 33 The concept of de novo trail formation during invasion is strengthened by in vitro models showing proteolytic micro- and macro-patterning of dense 3D invasion models for tumor cells or fibroblasts. 8 , 34 , 35 Using THG/SHG/fluorescence detection of both 3D tissue anatomy and invading cells, comparison of tumor-free and tumor-cell invaded tissue strongly suggests that invading cells follow pre-existing tracks bordered by cell or ECM interfaces and, rather than generating neo-trails, show remarkable adaptation of cell shape and invasion mode in response to tissue organization.
Two topographic types of track systems were identified, (1) discontinuous, loosely confined spaces within fibrillar collagen networks (Fig. 7A ad B) and (2) irregular- or linear-shaped tracks confined by 2D interfaces (Fig. 7C and D). The trails composed of fibrillar collagen networks consist of small fibrils or thicker fiber bundles bordering discontinuous spaces of 5–30 µm in diameter in random or aligned order, which support the invasion of individual or loosely connected cells oriented in parallel to the matrix structure (Fig. 7A and B). Irregular microtracks identified by THG/SHG imaging in fat tissue are composed of neighboring adipocytes, with occasional interspersed collagen bundles, forming irregular-shaped 3D clefts of 2–10 µm in diameter and polygonal, random organization (Fig. 7C). These tracks support multiple tip cells leading diffuse, irregularly shaped collective invasion as broad amorphous mass. Conversely, regular-shaped, aligned trails between myofibers, nerves and blood vessels are linear in organization, uniform in width and promote directionally persistent file-like collective invasion led by one or two tip cells (Fig. 7D). In tumor-free tissue, such aligned tracks either show a constitutive diameter range of 2 to 5 µm, as along nerves and myofibers or between myofibers and blood vessels. Alternatively, linear tracks are detectable as singular interphase along myofibers, possibly representing collapsed but preexisting space, which becomes moderately expanded by invading cells without apparent change of tissue structure, similar to cell-imposed but non-proteolytic widening of experimental microtracks in 3D collagen scaffolds. 36

Figure 7. Classification of in vivo scaffold organization and corresponding migration modes in the B16F10 model. Both, connective tissue composed of predominantly fibrillar collagen or surrounding cell structures may show random or aligned organization, with impact on the invasion mode of B16F10 cells. Blue, THG-/SHG-positive scaffold; red, basement membrane, not detected by MPM of native tissue structures; yellow, tumor cells. 3D topography corresponds to either 1D (migration along a single fiber) 2D topography (migration along a surface) and 3D (when the cell bodies are confined by additional tissue structures apically or laterally interfaces, or move between multiple collagen fibers).
Using mosaic-type tumors to visualize leading edges of invasion within a complex tumor mass, combined THG/SHG/fluorescence imaging allows to categorize tissue geometry and its impact on the mode of migration. Invasion into collagen-rich interstitial tissue occurs along fibrillar meshworks of collagen fibers bordering discontinuous, heterogeneous spaces, thus representing migration in 1D when cells move predominantly along a singular fiber, 11 3D when three-dimensionally surrounded and touched by multiple fibers, 3 and 1D/3D combinations depending of alternating ECM porosity and alignment (Fig. 7A and B). By contrast, confined tracks consist of often simple-shaped 2D interfaces, such as the linear surface of myofibers or nerve strands, or the curved but nonetheless 2D surfaces of adipocytes. Because migrating cells engage with one interface scaffold and, with their apical pole, touch the counter-scaffold, here the adjacent myofiber, vessel, or collagen bundle, the tissue topography combines elements of 2D and 3D migration (Fig. 7C and D), similar to the continuous 3D environment that confines individual cells migrating between opposing 2D interfaces (“chimneying”). 37 Myofibers, peripheral nerves and adipocytes are covered by a basement membrane consisting of type IV collagen, laminin, nidogen/entactin, and perlecan, 38 and collagen fibers and bundles consist of fibrillar collagens, predominantly collagen type I and III; thus each invasion routes provides a variety of 1D fibrils, 2D surfaces of basement membrane and/or bundled collagen, and complex fibrillar and multi-surface 3D geometries in close vicinity which are employed by cells in a versatile, adaptive and often simultaneous manner.
In 2D models, surfaces coated with both basement membrane components and fibrillar collagens provide bona-fide substrate for cell polarization along the surface, engagement of integrins for mechano-sensing and -transduction for haptokinetic migration. 39 , 40 Likewise, B16F10 cells during 1D, 2D and/or 3D migration show preferential orientation along the preexisting tissue topography, consistent with contact guidance of in vivo invasion. 11 Similar ECM-directed guidance of tumor-cell invasion occurs along radially aligned collagen fiber bundles surrounding breast tumors in perpendicular orientation. 11 , 12 , 19 Besides tissue topography and spaces of least resistance, the stiffness of such 2D/3D tissue scaffolds may support directional cell migration by reinforcing cell protrusions, formation of focal adhesions, and high-traction force for elongated cell movement. 41 , 42 The stiffness of skin tissue components varies between deformable collagen networks (elastic modulus 1–3 kPa), 43 more rigid muscle fibers (elastic modulus ~12 kPa) 44 and fat tissue (elastic modulus 5–25 kPa), 45 thus providing different mechanical strengths for haptotactic and durotactic guidance cues in conjunction with 1D, 2D and 3D topography.
Collective invasion is a multicellular migration mode dependent on cell-cell cohesion, supracellular organization, and the capacity to proteolytically degrade ECM and generate tracks. 34 , 35 THG/SHG/fluorescence imaging further suggests that the shape, extend and speed of collective invasion is strongly impacted by the type and shape of encountered tissue. Linear microtracks, such as along muscle fibers, support fast (70 µm/d), directionally persistent and laterally confined collective invasion in B16F10 cells. Conversely, irregularly shaped, discontinuous tracks within fat tissues result in comparably slow, poorly organized multicellular mass invasion with multiple tip cells advancing slowly (estimated speed 10 to 15 µm/day; data not shown). Thus, besides cell-intrinsic features, the topography and composition of connective tissue strongly impact the shape, distribution and efficacy of collective invasion with preference for tissue topography matching 2D/3D organization along flat and relatively rigid surfaces.
As unexpected finding, THG imaging visualized (sub)micrometer sized tumor-associated particles in the tumor microenvironment and allowed estimations of size distribution, location and dynamics. Tumor microparticles are detectable using fluorescence labeling from in vitro or ex vivo samples, 46 but have not been visualized yet in native state in vivo. THG thus facilitates the visualization of native microvesicles in live tissue without fluorescence labeling requirement or tissue processing which delivers robust microparticle signal, in contrast to intra-vesicle fluorescence which may be degraded or leak out through membrane defects. As important technical limitation, due to the diffraction limit of infrared excited multiphoton excitation (lateral point-spread function above 650 nm 30 ) the size of very small particles is either overestimated (toward the micron range) or particles below 200 nm in diameter may remain undetected. 47 Tumor cells produce a heterogeneous mixture of small vesicular structures of submicrometer size which are implicated in cancer progression, , by a dual mechanistic function. Microparticles may enhance progression by mediating intercellular communication and oncogenic conditioning of local and systemic microenvironmental niches and thereby promote tumor invasion and metastasis, angiogenesis and drug resistance. 32 , 48 Conversely, microparticles serve as antigen carriers and after uptake by antigen-presenting cells may enhance anti-tumor immune reactions. 49 Time-lapse THG imaging shows distinct subsets of immobilized as well as randomly or directionally moving particles, likely in response to respective immobilization at collagen fibers or convection with interstitial fluid drifts. 50 Thus, THG may serve as supportive approach to monitor particle dynamics in vivo under physiological conditions and disease states.
Materials and Methods
Cells and cell culture
B16F10 mouse melanoma cells were cultured in RPMI1640 medium (GIBCO, 21875) supplemented with 10% FCS (SIGMA, F7524), 1% sodium pyruvate (GIBCO, 11360) and 1% penicillin and streptomycin (PAA, P11–010). Dual color cell lines were generated using the following constructs: pLenti6.2/V5-DEST™ Gateway® (Invitrogen, V36820) containing histone2B/eGFP and pCMV-E2-Crimson (Clontech, 632556). 56 Stable histone-2B/eGFP expressing cell lines were obtained by lentiviral transduction and blasticidin selection (10 µg/ml). Subsequently, stable dual color lines expressing histone-2B/eGFP and cytoplasmic E2-Crimson were created by electroporation followed by G418 selection (100µg/ml) and fluorescence activated cell sorting of the double positive population.
Tumor implantation and and intravital monitoring
Dorsal skin-fold chambers were transplanted on 8 to 14-week-old male C57/Bl6 J mice (Charles River), as described. 16 The dorsal skin-fold chamber is mounted on a skin-flap to cover the deep dermis after surgically removing the opposite side of the skin, as described. 51 One day post-surgery, two small tumors per chamber were implanted by injecting a cell pellet of histone-2B/eGFP and E2-Crimson expressing B16F10 cells (5 × 10⁴–2 × 10⁵ cells) with a 30G needle into the dermis nearby the deep dermal vascular plexus. 16 Tumor growth was then monitored for up to 13 d by epifluorescence and multi-photon microscopy. For intravital microscopy, mice were anesthesized with isoflurane (1–3% in oxygen) and the skin-fold chamber was stably mounted on the temperature-controlled stage (37°C). Blood vessels were visualized by intravenous injection of AlexaFluor®750 labeled 70kDa-dextran (2 mg/mouse).
All animal experiments were approved by the Ethical Committee on Animal Experiments and performed in the Central Animal Laboratory of the Radboud University, Nijmegen, in accordance with the Dutch Animal Experimentation Act and the European FELASA protocol (www.felasa.eu/guidelines.php).
Two-photon system setup and image acquisition
Imaging was performed on a customized multiphoton microscope (TriMScope-II, LaVision BioTec), equipped with three tunable Ti:Sa (Coherent Ultra II Titanium:Sapphire) lasers and an Optical Parametric Oscillator (OPO PP Automatic equipped with a PP800 crystal; Coherent APE; typical pulse width 200 fs, repetition rate 80 MHz; peak output power of 500–650 mW at 1180 nm). THG imaging was performed with an Olympus XLUMPlanFl 206/0.95W objective at a wavelength of 1180 nm resulting in a maximum intensity of 190 mW below the objective, which for imaging living tissue was commonly attenuated to 100–130 mW in the sample. During in vivo measurements, emission was backward detected by 4 PMTs in standard position (blue/THG, FF417/60 or FF01 395/8; green, ET525/50; red ET620/60, FF01 593/11 or FF01 593/40 and far-red FF01 675/67, ET710/75x or ET810/90 m FF filters: Semrock, Inc., ET filters: Chroma Technology Inc.). For high-sensitivity in vitro measurements, emission was also collected in the forward direction using a 1.4NA condensor and two detection channels (FF417/60 or FF01 395/8; and FF01 593/11 respectively). Ultrasensitive gallium arsenide phosphide, blue and red sensitive PMTs (Hamamatsu, H7422–40, H6780–01 and H6780–20 respectively) were used for backward detection using an ultasensitive port directly adjacent to the objective. For THG forward detection, blue and red sensitive PMTs were used.
Image processing, single particle tracking and analysis
Images were processed using Fiji (http://pacific.mpi-cbg.de/wiki/index.php/Fiji). Mosaic images were stitched using the Fiji 2D/3D stitching plugin 52 and drifts in time-lapse recordings were corrected using the StackReg plugin. 53 Quantitative analysis of tumor microvesicle dynamics was performed by single particle tracking, as described. 54 Two-dimensional trajectories in the plane of focus were reconstructed using IDL-based colloidal particle tracking software 55 which has been translated to MATLAB (Daniel Blair and Eric Dufresne, http://physics.georgetown.edu/matlab/) and modified for tracing of heterogeneously distributed, low-intensity fluorescent spots. During tracking a maximum frame-to-frame displacement of 3 or 2 pixels (1.5 and 1 µm) was allowed for THG and SHG reference spots, respectively. The cross section of a tracked particle has been calculated by determination of the radius of gyration, around its local intensity maximum, in the first frame of the trajectory. Mean square displacement (MSD) curves were generated for each trajectory with a minimum length of 21 frames, and the short time lag diffusion coefficient D used in the histogram of Figure 6D was retrieved by linear fitting of the first 4 points of the MSD plot. To generate histograms of microvesicle velocity distribution, the first 1/4th of the points of the MSD plot of individual trajectories was fitted with a model function for directed diffusion: < r(t) 2 > = 4Dt + (Vt), 2 where < r(t) 2 > is the mean square displacement for time lag t and V equals the velocity component.
Colocalization analysis was performed using the Colocalization Highlighter plugin of ImageJ software (NIH). Images were background corrected, thresholded using automatically settings of the threshold tool, and ratio of intensity was set at 50%. Two points were considered as colocalized when their respective intensities were above threshold and the ratio of their intensities above 0.5.
Supplementary Material
Acknowledgments
We acknowledge Esther Wagena for outstanding assistance and technical support. This work was supported by the Dutch Cancer Foundation (KWF 2008–4031), the FP7 of the European Union (ENCITE HEALTH TH-15–2008–208142) and the Netherlands Science Organization (NWO-VICI 918.11.626).
Glossary
Abbreviations:
- THG
third harmonic generation
- SHG
second harmonic generation
- DSFC
dorsal skin-fold chamber
- ECM
extracellular matrix
- MPM
multiphoton microscopy
Submitted
06/01/12
Accepted
06/21/12
Disclosure of Potential Conflicts of Interest
No potential conflicts of interest were disclosed.
References
- 1. Sahai E. . Illuminating the metastatic process. Nat Rev Cancer 2007; 7:737 - 49; http://dx.doi.org/ 10.1038/nrc2229; PMID: 17891189 [DOI] [PubMed] [Google Scholar]
- 2. Bravo-Cordero JJ, Hodgson L, Condeelis J. . Directed cell invasion and migration during metastasis. Curr Opin Cell Biol 2012; 24:277 - 83; http://dx.doi.org/ 10.1016/j.ceb.2011.12.004; PMID: 22209238 [DOI] [PMC free article] [PubMed] [Google Scholar]
- 3. Wolf K, Mazo I, Leung H, Engelke K, von Andrian UH, Deryugina EI, et al. . Compensation mechanism in tumor cell migration: mesenchymal-amoeboid transition after blocking of pericellular proteolysis. J Cell Biol 2003; 160:267 - 77; http://dx.doi.org/ 10.1083/jcb.200209006; PMID: 12527751 [DOI] [PMC free article] [PubMed] [Google Scholar]
- 4. Friedl P, Gilmour D. . Collective cell migration in morphogenesis, regeneration and cancer. Nat Rev Mol Cell Biol 2009; 10:445 - 57; http://dx.doi.org/ 10.1038/nrm2720; PMID: 19546857 [DOI] [PubMed] [Google Scholar]
- 5. Friedl P, Wolf K. . Plasticity of cell migration: a multiscale tuning model. J Cell Biol 2010; 188:11 - 9; http://dx.doi.org/ 10.1083/jcb.200909003; PMID: 19951899 [DOI] [PMC free article] [PubMed] [Google Scholar]
- 6. Carey SP, Kraning-Rush CM, Williams RM, Reinhart-King CA. . Biophysical control of invasive tumor cell behavior by extracellular matrix microarchitecture. Biomaterials 2012; 33:4157 - 65; http://dx.doi.org/ 10.1016/j.biomaterials.2012.02.029; PMID: 22405848 [DOI] [PMC free article] [PubMed] [Google Scholar]
- 7. Wolf K, Friedl P. . Extracellular matrix determinants of proteolytic and non-proteolytic cell migration. Trends Cell Biol 2011; 21:736 - 44; http://dx.doi.org/ 10.1016/j.tcb.2011.09.006; PMID: 22036198 [DOI] [PubMed] [Google Scholar]
- 8. Sabeh F, Shimizu-Hirota R, Weiss SJ. . Protease-dependent versus -independent cancer cell invasion programs: three-dimensional amoeboid movement revisited. J Cell Biol 2009; 185:11 - 9; http://dx.doi.org/ 10.1083/jcb.200807195; PMID: 19332889 [DOI] [PMC free article] [PubMed] [Google Scholar]
- 9. Gritsenko PG, Ilina O, Friedl P. . Interstitial guidance of cancer invasion. J Pathol 2012; 226:185 - 99; http://dx.doi.org/ 10.1002/path.3031; PMID: 22006671 [DOI] [PubMed] [Google Scholar]
- 10. Goetz JG, Minguet S, Navarro-Lérida I, Lazcano JJ, Samaniego R, Calvo E, et al. . Biomechanical remodeling of the microenvironment by stromal caveolin-1 favors tumor invasion and metastasis. Cell 2011; 146:148 - 63; http://dx.doi.org/ 10.1016/j.cell.2011.05.040; PMID: 21729786 [DOI] [PMC free article] [PubMed] [Google Scholar]
- 11. Petrie RJ, Doyle AD, Yamada KM. . Random versus directionally persistent cell migration. Nat Rev Mol Cell Biol 2009; 10:538 - 49; http://dx.doi.org/ 10.1038/nrm2729; PMID: 19603038 [DOI] [PMC free article] [PubMed] [Google Scholar]
- 12. Provenzano PP, Inman DR, Eliceiri KW, Knittel JG, Yan L, Rueden CT, et al. . Collagen density promotes mammary tumor initiation and progression. BMC Med 2008; 6:11; http://dx.doi.org/ 10.1186/1741-7015-6-11; PMID: 18442412 [DOI] [PMC free article] [PubMed] [Google Scholar]
- 13. Oheim M, Michael DJ, Geisbauer M, Madsen D, Chow RH. . Principles of two-photon excitation fluorescence microscopy and other nonlinear imaging approaches. Adv Drug Deliv Rev 2006; 58:788 - 808; http://dx.doi.org/ 10.1016/j.addr.2006.07.005; PMID: 17055106 [DOI] [PubMed] [Google Scholar]
- 14.Friedl P, Wolf K, von Andrian UH, Harms G. Biological second and third harmonic generation microscopy. Curr Protoc Cell Biol 2007; Chapter 4:Unit 4.15. [DOI] [PubMed] [Google Scholar]
- 15. Provenzano PP, Inman DR, Eliceiri KW, Trier SM, Keely PJ. . Contact guidance mediated three-dimensional cell migration is regulated by Rho/ROCK-dependent matrix reorganization. Biophys J 2008; 95:5374 - 84; http://dx.doi.org/ 10.1529/biophysj.108.133116; PMID: 18775961 [DOI] [PMC free article] [PubMed] [Google Scholar]
- 16. Alexander S, Koehl GE, Hirschberg M, Geissler EK, Friedl P. . Dynamic imaging of cancer growth and invasion: a modified skin-fold chamber model. Histochem Cell Biol 2008; 130:1147 - 54; http://dx.doi.org/ 10.1007/s00418-008-0529-1; PMID: 18987875 [DOI] [PubMed] [Google Scholar]
- 17. Condeelis J, Segall JE. . Intravital imaging of cell movement in tumours. Nat Rev Cancer 2003; 3:921 - 30; http://dx.doi.org/ 10.1038/nrc1231; PMID: 14737122 [DOI] [PubMed] [Google Scholar]
- 18. Bianchini P, Diaspro A. . Three-dimensional (3D) backward and forward second harmonic generation (SHG) microscopy of biological tissues. J Biophotonics 2008; 1:443 - 50; http://dx.doi.org/ 10.1002/jbio.200810060; PMID: 19343670 [DOI] [PubMed] [Google Scholar]
- 19. Provenzano PP, Eliceiri KW, Campbell JM, Inman DR, White JG, Keely PJ. . Collagen reorganization at the tumor-stromal interface facilitates local invasion. BMC Med 2006; 4:38; http://dx.doi.org/ 10.1186/1741-7015-4-38; PMID: 17190588 [DOI] [PMC free article] [PubMed] [Google Scholar]
- 20. Débarre D, Beaurepaire E. . Quantitative characterization of biological liquids for third-harmonic generation microscopy. Biophys J 2007; 92:603 - 12; http://dx.doi.org/ 10.1529/biophysj.106.094946; PMID: 17085492 [DOI] [PMC free article] [PubMed] [Google Scholar]
- 21. Débarre D, Supatto W, Pena A-M, Fabre A, Tordjmann T, Combettes L, et al. . Imaging lipid bodies in cells and tissues using third-harmonic generation microscopy. Nat Methods 2006; 3:47 - 53; http://dx.doi.org/ 10.1038/nmeth813; PMID: 16369553 [DOI] [PubMed] [Google Scholar]
- 22. Rehberg M, Krombach F, Pohl U, Dietzel S. . Label-free 3D visualization of cellular and tissue structures in intact muscle with second and third harmonic generation microscopy. PLoS One 2011; 6:e28237; http://dx.doi.org/ 10.1371/journal.pone.0028237; PMID: 22140560 [DOI] [PMC free article] [PubMed] [Google Scholar]
- 23. Farrar MJ, Wise FW, Fetcho JR, Schaffer CB. . In vivo imaging of myelin in the vertebrate central nervous system using third harmonic generation microscopy. Biophys J 2011; 100:1362 - 71; http://dx.doi.org/ 10.1016/j.bpj.2011.01.031; PMID: 21354410 [DOI] [PMC free article] [PubMed] [Google Scholar]
- 24. Olivier N, Luengo-Oroz MA, Duloquin L, Faure E, Savy T, Veilleux I, et al. . Cell lineage reconstruction of early zebrafish embryos using label-free nonlinear microscopy. Science 2010; 329:967 - 71; http://dx.doi.org/ 10.1126/science.1189428; PMID: 20724640 [DOI] [PubMed] [Google Scholar]
- 25. Supatto W, Débarre D, Moulia B, Brouzés E, Martin J-L, Farge E, et al. . In vivo modulation of morphogenetic movements in Drosophila embryos with femtosecond laser pulses. Proc Natl Acad Sci U S A 2005; 102:1047 - 52; http://dx.doi.org/ 10.1073/pnas.0405316102; PMID: 15657140 [DOI] [PMC free article] [PubMed] [Google Scholar]
- 26. Tserevelakis GJ, Filippidis G, Megalou EV, Fotakis C, Tavernarakis N. . Cell tracking in live Caenorhabditis elegans embryos via third harmonic generation imaging microscopy measurements. J Biomed Opt 2011; 16:046019; http://dx.doi.org/ 10.1117/1.3569615; PMID: 21529088 [DOI] [PubMed] [Google Scholar]
- 27. Watanabe T, Thayil A, Jesacher A, Grieve K, Debarre D, Wilson T, et al. . Characterisation of the dynamic behaviour of lipid droplets in the early mouse embryo using adaptive harmonic generation microscopy. BMC Cell Biol 2010; 11:38; http://dx.doi.org/ 10.1186/1471-2121-11-38; PMID: 20525231 [DOI] [PMC free article] [PubMed] [Google Scholar]
- 28. Lee W-J, Yu C-H, Tai S-P, Huang H-Y, Sun S-K. . Acetic Acid as a Cell Nucleus Contrast Agent in Third-harmonic Generation Microscopy. Journal of Medical and Biological Engineering 2007; 27:161 - 4 [Google Scholar]
- 29. Witte S, Negrean A, Lodder JC, de Kock CPJ, Testa Silva G, Mansvelder HD, et al. . Label-free live brain imaging and targeted patching with third-harmonic generation microscopy. Proc Natl Acad Sci U S A 2011; 108:5970 - 5; http://dx.doi.org/ 10.1073/pnas.1018743108; PMID: 21444784 [DOI] [PMC free article] [PubMed] [Google Scholar]
- 30. Andresen V, Alexander S, Heupel W-M, Hirschberg M, Hoffman RM, Friedl P. . Infrared multiphoton microscopy: subcellular-resolved deep tissue imaging. Curr Opin Biotechnol 2009; 20:54 - 62; http://dx.doi.org/ 10.1016/j.copbio.2009.02.008; PMID: 19324541 [DOI] [PubMed] [Google Scholar]
- 31. Mayer C, Maaser K, Daryab N, Zänker KS, Bröcker EB, Friedl P. . Release of cell fragments by invading melanoma cells. Eur J Cell Biol 2004; 83:709 - 15; http://dx.doi.org/ 10.1078/0171-9335-00394; PMID: 15679115 [DOI] [PubMed] [Google Scholar]
- 32. Muralidharan-Chari V, Clancy JW, Sedgwick A, D’Souza-Schorey C. . Microvesicles: mediators of extracellular communication during cancer progression. J Cell Sci 2010; 123:1603 - 11; http://dx.doi.org/ 10.1242/jcs.064386; PMID: 20445011 [DOI] [PMC free article] [PubMed] [Google Scholar]
- 33. Hofmann UB, Westphal JR, Waas ET, Zendman AJ, Cornelissen IM, Ruiter DJ, et al. . Matrix metalloproteinases in human melanoma cell lines and xenografts: increased expression of activated matrix metalloproteinase-2 (MMP-2) correlates with melanoma progression. Br J Cancer 1999; 81:774 - 82; http://dx.doi.org/ 10.1038/sj.bjc.6690763; PMID: 10555745 [DOI] [PMC free article] [PubMed] [Google Scholar]
- 34. Wolf K, Wu YI, Liu Y, Geiger J, Tam E, Overall C, et al. . Multi-step pericellular proteolysis controls the transition from individual to collective cancer cell invasion. Nat Cell Biol 2007; 9:893 - 904; http://dx.doi.org/ 10.1038/ncb1616; PMID: 17618273 [DOI] [PubMed] [Google Scholar]
- 35. Gaggioli C, Hooper S, Hidalgo-Carcedo C, Grosse R, Marshall JF, Harrington K, et al. . Fibroblast-led collective invasion of carcinoma cells with differing roles for RhoGTPases in leading and following cells. Nat Cell Biol 2007; 9:1392 - 400; http://dx.doi.org/ 10.1038/ncb1658; PMID: 18037882 [DOI] [PubMed] [Google Scholar]
- 36. Ilina O, Bakker G-J, Vasaturo A, Hofmann RM, Friedl P. . Two-photon laser-generated microtracks in 3D collagen lattices: principles of MMP-dependent and -independent collective cancer cell invasion. Phys Biol 2011; 8:015010; http://dx.doi.org/ 10.1088/1478-3975/8/1/015010; PMID: 21301056 [DOI] [PubMed] [Google Scholar]
- 37. Malawista SE, de Boisfleury Chevance A. . Random locomotion and chemotaxis of human blood polymorphonuclear leukocytes (PMN) in the presence of EDTA: PMN in close quarters require neither leukocyte integrins nor external divalent cations. Proc Natl Acad Sci U S A 1997; 94:11577 - 82; http://dx.doi.org/ 10.1073/pnas.94.21.11577; PMID: 9326652 [DOI] [PMC free article] [PubMed] [Google Scholar]
- 38. LeBleu VS, Macdonald B, Kalluri R. . Structure and function of basement membranes. Exp Biol Med (Maywood) 2007; 232:1121 - 9; http://dx.doi.org/ 10.3181/0703-MR-72; PMID: 17895520 [DOI] [PubMed] [Google Scholar]
- 39. Lugassy C, Barnhill RL. . Angiotropic melanoma and extravascular migratory metastasis: a review. Adv Anat Pathol 2007; 14:195 - 201; http://dx.doi.org/ 10.1097/PAP.0b013e31805048d9; PMID: 17452816 [DOI] [PubMed] [Google Scholar]
- 40. Sroka IC, Anderson TA, McDaniel KM, Nagle RB, Gretzer MB, Cress AE. . The laminin binding integrin alpha6beta1 in prostate cancer perineural invasion. J Cell Physiol 2010; 224:283 - 8; http://dx.doi.org/ 10.1002/jcp.22149; PMID: 20432448 [DOI] [PMC free article] [PubMed] [Google Scholar]
- 41. Ulrich TA, de Juan Pardo EM, Kumar S. . The mechanical rigidity of the extracellular matrix regulates the structure, motility, and proliferation of glioma cells. Cancer Res 2009; 69:4167 - 74; http://dx.doi.org/ 10.1158/0008-5472.CAN-08-4859; PMID: 19435897 [DOI] [PMC free article] [PubMed] [Google Scholar]
- 42. Peyton SR, Kim PD, Ghajar CM, Seliktar D, Putnam AJ. . The effects of matrix stiffness and RhoA on the phenotypic plasticity of smooth muscle cells in a 3-D biosynthetic hydrogel system. Biomaterials 2008; 29:2597 - 607; http://dx.doi.org/ 10.1016/j.biomaterials.2008.02.005; PMID: 18342366 [DOI] [PMC free article] [PubMed] [Google Scholar]
- 43. Hadjipanayi E, Mudera V, Brown RA. . Guiding cell migration in 3D: a collagen matrix with graded directional stiffness. Cell Motil Cytoskeleton 2009; 66:121 - 8; http://dx.doi.org/ 10.1002/cm.20331; PMID: 19170223 [DOI] [PubMed] [Google Scholar]
- 44. Engler AJ, Griffin MA, Sen S, Bönnemann CG, Sweeney HL, Discher DE. . Myotubes differentiate optimally on substrates with tissue-like stiffness: pathological implications for soft or stiff microenvironments. J Cell Biol 2004; 166:877 - 87; http://dx.doi.org/ 10.1083/jcb.200405004; PMID: 15364962 [DOI] [PMC free article] [PubMed] [Google Scholar]
- 45. Van Houten EEW, Doyley MM, Kennedy FE, Weaver JB, Paulsen KD. . Initial in vivo experience with steady-state subzone-based MR elastography of the human breast. J Magn Reson Imaging 2003; 17:72 - 85; http://dx.doi.org/ 10.1002/jmri.10232; PMID: 12500276 [DOI] [PubMed] [Google Scholar]
- 46. Hood JL, San RS, Wickline SA. . Exosomes released by melanoma cells prepare sentinel lymph nodes for tumor metastasis. Cancer Res 2011; 71:3792 - 801; http://dx.doi.org/ 10.1158/0008-5472.CAN-10-4455; PMID: 21478294 [DOI] [PubMed] [Google Scholar]
- 47. Débarre D, Supatto W, Beaurepaire E. . Structure sensitivity in third-harmonic generation microscopy. Opt Lett 2005; 30:2134 - 6; http://dx.doi.org/ 10.1364/OL.30.002134; PMID: 16127934 [DOI] [PubMed] [Google Scholar]
- 48. Lee TH, D’Asti E, Magnus N, Al-Nedawi K, Meehan B, Rak J. . Microvesicles as mediators of intercellular communication in cancer--the emerging science of cellular ‘debris’. Semin Immunopathol 2011; 33:455 - 67; http://dx.doi.org/ 10.1007/s00281-011-0250-3; PMID: 21318413 [DOI] [PubMed] [Google Scholar]
- 49. Zeelenberg IS, van Maren WWC, Boissonnas A, Van Hout-Kuijer MA, Den Brok MH, Wagenaars JA, et al. . Antigen localization controls T cell-mediated tumor immunity. J Immunol 2011; 187:1281 - 8; http://dx.doi.org/ 10.4049/jimmunol.1003905; PMID: 21705625 [DOI] [PubMed] [Google Scholar]
- 50. Shieh AC, Swartz MA. . Regulation of tumor invasion by interstitial fluid flow. Phys Biol 2011; 8:015012; http://dx.doi.org/ 10.1088/1478-3975/8/1/015012; PMID: 21301060 [DOI] [PubMed] [Google Scholar]
- 51. Koehl GE, Gaumann A, Geissler EK. . Intravital microscopy of tumor angiogenesis and regression in the dorsal skin fold chamber: mechanistic insights and preclinical testing of therapeutic strategies. Clin Exp Metastasis 2009; 26:329 - 44; http://dx.doi.org/ 10.1007/s10585-008-9234-7; PMID: 19190882 [DOI] [PubMed] [Google Scholar]
- 52. Preibisch S, Saalfeld S, Tomancak P. . Globally optimal stitching of tiled 3D microscopic image acquisitions. Bioinformatics 2009; 25:1463 - 5; http://dx.doi.org/ 10.1093/bioinformatics/btp184; PMID: 19346324 [DOI] [PMC free article] [PubMed] [Google Scholar]
- 53. Thévenaz P, Ruttimann UE, Unser M. . A pyramid approach to subpixel registration based on intensity. IEEE Trans Image Process 1998; 7:27 - 41; http://dx.doi.org/ 10.1109/83.650848; PMID: 18267377 [DOI] [PubMed] [Google Scholar]
- 54.Bakker GJ, Eich C. Torreno-Pina J a., Diez-Ahedo R, Perez-Samper G, van Zanten T S, et al. Lateral mobility of individual integrin nanoclusters orchestrates the onset for leukocyte adhesion. Proceedings of the National Academy of Sciences 2012;1-6doi:10.1073/pnas.1116425109 [DOI] [PMC free article] [PubMed]
- 55. Crocker, John C and Grier D G. Methods of Digital Video Microscopy for Colloidal Studies. J Colloid Interface Sci 1996; 310:298 - 310 [Google Scholar]
- 56. Strack RL, Hein B, Bhattacharyya D, Hell SW, KeenanRJ, Glick BS. A rapidly maturing far-red derivative of DsRed-Express2 for whole-cell labeling.. Biochemistry 2009; 48:8279 - 81; http://dx.doi.org/ 10.1021/bi900870u [DOI] [PMC free article] [PubMed] [Google Scholar]
Associated Data
This section collects any data citations, data availability statements, or supplementary materials included in this article.