

Abstract
This study compares the ability of an elevated triglyceride/high-density lipoprotein cholesterol (TG/HDL-C) ratio, using sex-specific cut-points, to identify insulin-resistant individuals within a population without known cardiac disease or diabetes with that obtained using the diagnostic criteria of the metabolic syndrome (MetS). Measurements were made of waist circumference (WC), systolic and diastolic blood pressure, fasting plasma glucose, fasting plasma insulin (FPI), plasma TG and plasma HDL-C concentrations in 1102 women and 464 men. These data were used to classify subjects as being insulin resistant (FPI concentration in the upper quartile) and having the MetS or an elevated TG/HDL-C ratio (>2.5 and >3.5 for women and men, respectively). The sensitivity and specificity with which the two indices identified insulin-resistant subjects were similar (43% and 81% for TG/HDL-C ratio and 45% and 82% for MetS), as the number of individuals was found with either an elevated TG/HDL-C ratio (n = 386) or the MetS (n = 384). Eighty-one per cent of the individuals were identified concordantly. Cardio-metabolic risk profiles in ‘low-risk’ individuals identified by a low TG/HDL-C ratio were comparable to those who did not have the MetS, and this was also the case when comparing ‘high-risk’ groups identified by having the MetS or an elevated TG/HDL-C ratio. These findings suggest that TG/HDL-C concentration ratio is as adequate as MetS diagnosis to identify insulin-resistant subjects.
Keywords: triglyceride/high-density lipoprotein cholesterol ratio, insulin resistance, cardio-metabolic risk, metabolic syndrome
Introduction
Insulin-mediated glucose disposal varies more than sixfold in apparently healthy individuals,1 and at least 25% of the most insulin-resistant members of this population are at increased risk to develop type 2 diabetes and coronary heart disease.2–4 It would obviously be helpful to identify insulin- resistant subjects before the appearance of clinical disease, and one approach5 has been to see if they merit a diagnosis of the metabolic syndrome (MetS). It has also been suggested that the plasma concentration ratio of triglyceride (TG)/high-density lipoprotein cholesterol (HDL-C) can serve the same purpose with the advantage of being simpler, more widely available and based on two standardized measurements.6,7 Both plasma TG and HDL-C concentrations are independently associated with insulin sensitivity,8 and the plasma TG/HDL-C concentration ratio is significantly related to a direct measure of insulin-mediated glucose disposal.6,7 In the best of our knowledge, there are no direct comparisons between both strategies to identify the most insulin-resistant individuals.
However, clinical use of the TG/HDL-C ratio as a means of identifying insulin-resistant individuals, at increased cardio-metabolic risk, is complicated by the fact that comparisons in non-Hispanic Whites, Mexican-Americans and non-Hispanic Blacks have shown that the most clinically effective ratio will vary as a function of racial group,9 and results of a study in a population predominantly of European origin indicated that the most clinically useful TG/HDL-C ratio was also different in men and women.10
The purpose of this study was to extend the clinical evaluation of the TG/HDL-C ratio, using sex-specific cut- points, and had two major goals: (1) to quantify the ability with which the TG/HDL-C ratio identified insulin-resistant individuals within a population without known cardiac or metabolic disease, as well as the cardio-metabolic risk profile in that subset and (2) to compare the clinical information evolving from these efforts with that obtained using the newly harmonized diagnostic criteria of the MetS.5
Methods
As part of community intervention programmes addressing cardiovascular disease risk factors, epidemiological studies focused on hypertension, renal disease and other cardio- metabolic risk factors were conducted in Rauch city (RAUCH project, province of Buenos Aires, Argentina, 36° 45′ 00″ south latitude and 59° 04′ 00″ west longitude) and San Andrés de Giles city (PROCER project, province of Buenos Aires, Argentina, 34° 26′ 30.52″ south latitude and 59° 26′ 37.29″ west longitude). According to the last national census available, there were 8246 and 13,922 inhabitants ≥15 years old in the urban area of Rauch and San Andrés de Giles, respectively. Both cities lie in a rural area in the Centre-Southeast region of the province of Buenos Aires. Their population is primarily of European origin, with similar socioeconomics features,10–12 and the annual average temperature in both cities is ~14°C.
Both projects were performed in cohorts based on random samples obtained from subjects living in chosen blocks. The methodology of the sample, the socioeconomic features and the prevalence of cardiovascular disease risk factors of both populations have been published previously.10–12 In brief, blood pressure was measured sitting, after a minimum resting period of 5 min, using a mercury sphygmomanometer. Phase-I and Phase-V Korotkoff sounds were used to identify systolic blood pressure (SBP) and diastolic blood pressure (DBP), respectively; SBP and DBP values were an average of three different measurements separated by 2 min from one another. Weight was determined with individuals wearing light clothes and no shoes. Height was also measured without shoes, using a metallic metric tape; waist circumference (WC) was measured with a relaxed abdomen using a metallic metric tape on a horizontal plane above the iliac crest. Body mass index (BMI) was calculated (kg/m2), and the concentrations of plasma glucose, TG, HDL-C and fasting plasma insulin (FPI) were determined after an overnight (12 h) fast. Plasma for the insulin measurements was extracted by centrifugation (15 min at 3000 r/min) and frozen at −20°C until assayed. FPI concentrations in the Rauch population were determined using an immunoradiometric assay, with two monoclonal antibodies against two different epitopes of the insulin molecule. The inter- and intra-assay coefficients of variation (CV) were 8.0% and 3.8%, respectively, with the lowest detectable level of 1.4 pmol/L. FPI concentrations in the San Andrés de Giles population were determined using a solid-phase chemiluminescent assay, using commercially available kits (Immulite; Diagnostic Products Co, Los Angeles, CA, USA) with an analytical sensitivity of 1.4 pmol/L, inter- and intra-assay CV of less than 8%, and proinsulin cross-reactivity of less than 8.5%. Measurements of insulin concentration were available in the first sampling of the San Andrés de Giles population but only in the second sampling of the longitudinal follow-up of the Rauch group. Consequently, the mean age of the Rauch population was greater.
To avoid the potential confounding impact of extreme outliers, subjects with TG concentrations >5.7 mmol/L (500 mg/dL) and/or HDL-C concentrations >2.6 mmol/L (100 mg/dL) were excluded from the analysis, as were participants with a history of cardiovascular disease and/or diabetes or a fasting glucose concentration ≥7 mmol/L (126 mg/dL).13 The study population consisted of 1102 women (45 ± 18 years) and 464 men (46 ± 18 years) who had all the necessary measurements for the diagnosis of MetS and insulin resistance (IR). As published previously,10 we deter- mined that TG/HDL-C plasma concentration ratios (both expressed in mg/dL) ≥2.5 and 3.5 were able to separate the 25% of women and men, respectively, with the highest ratio from the remaining experimental group. These ratios were also comparable in terms of their sensitivity and specificity in identifying insulin-resistant individuals, as well as in the associated cardio-metabolic risk factors.10 Consequently, these sex-specific values of TG/HDL-C will be compared to a diagnosis of the MetS in the ability to identify insulin- resistant individuals, as well as values of cardio-metabolic risk factors associated with IR. Criteria for diagnosing the MetS are those outlined in the ‘harmonized’ version of the Adult Treatment Panel III (ATP III) and International Diabetes Federation (IDF), in which three of the following five criteria must be satisfied:5 (1) WC ≥ 102 cm in men and WC ≥ 88 cm in women, (2) HDL-C < 1 mmol/L (40 mg/dL) in men and HDL-C < 1.3 mmol/L (50 mg/dL) in women, (3) TG ≥ 1.7 mmol/L (150 mg/dL), (4) SBP ≥ 130 mmHg or DBP ≥ 85 mmHg and (5) glucose ≥ 5.6 mmol/L (100 mg/dL). FPI quartiles were calculated separately for each sex and for each population sample, and subjects were assigned to a given FPI quartile according to their relative positions in the FPI distribution curve (men and women, with data from Rauch and San Andrés de Giles analysed separately).14 IR was defined as being in the quartile of individuals with the highest FPI concentrations. Furthermore, the homeostasis model assessment of insulin resistance (HOMA-IR) was calculated with the formula [(Insulin (μU/mL) × glucose (mmol/L))/22.5], and IR was alternatively defined as being in the upper quartile of HOMA-IR. The concordance coefficient (κ) between both definitions was very high [κ = 0.9, standard deviation (SD)= 0.01, p < 0.001], we have used the FPI criteria as our assessment of IR. Moreover, we have recently demonstrated, using the same database, that the predicative ability of the TG/HDL-C ratio was almost identical, irrespective of whether IR was defined by the top quartile of FPI or the top quartile of HOMA-IR.10
Sensitivity and specificity of the TG/HDL-C ratio and MetS to identify insulin-resistant individuals were calculated using the following formula: sensitivity = true positives/(true positives + false negatives) and specificity = true negative/(true negative + false positive). To evaluate the agreement between both criteria, high TG/HDL-C ratio and MetS, we used coefficient of concordance (κ). Receiver operating characteristic (ROC) curves were constructed in order to provide a graphic representation of the relationship between false-positive (i.e. 1-specificity) and true-positive (sensitivity) detection rates for both, using the categorical MetS components and the TG/HDL-C ratio as continuous variables. The area under the ROC curves and 95% confidence interval (95% CI) was used to compare the two indices.
Student’s t-test for independent samples was used to compare age, FPI, BMI, WC, SBP, DBP, glucose, TG and HDL-C between individuals considered as ‘high’ and ‘low’ risk based on use of either the TG/HDL-C ratio or MetS. All the statistical analyses performed using SPSS software (SPSS Inc., Chicago, IL, USA) were two-tailed, and p values <0.05 were considered to be statistically significant.
Results
Table 1 presents the demographic and metabolic characteristics of the men and women in the two population groups. Although individuals from San Andrés de Giles were somewhat younger on the average, values in neither men nor women varied substantially as a function of group. In particular, it should be noted that the FPI concentrations and HOMA-IR values were not different in men and women in either population. However, in most other instances, risk factors were greater in men than in women, with men having higher values for blood pressure, glucose and TG concentrations, with lower HDL-C concentrations. As a result, men had significantly higher TG/HDL-C concentration ratios.
Table 1.
Demographic and metabolic characteristics of the two populations.
| Variable | Rauch | San Andrés de Giles | ||||
|---|---|---|---|---|---|---|
|
|
||||||
| Women (n = 465) | Men (n = 209) | Women (n = 637) | Men (n = 255) | |||
| Mean (SD) | Mean (SD) | p* | Mean (SD) | Mean (SD) | p* | |
| Age (years) | 52 (16) | 53 (15) | 0.58 | 40 (17) | 40 (16) | 0.99 |
| FPI (pmol/L) | 52.0 (29.2) | 52.8 (37.5) | 0.80 | 58.33 (43.8) | 56.25 (61.8) | 0.65 |
| HOMA-IR | 1.7 (1.0) | 1.8 (1.4) | 0.31 | 2.0 (1.6) | 2.0 (2.1) | 0.96 |
| BMI (Kg/m2) | 25.5 (4.8) | 26.4 (3.7) | 0.01 | 27.9 (6.5) | 27.5 (5.1) | 0.27 |
| WC (cm) | 92 (13) | 96 (10) | <0.001 | 92 (15) | 94 (14) | 0.11 |
| SBP (mmHg) | 131 (19) | 136 (18) | <0.001 | 122 (20) | 125 (18) | 0.07 |
| DBP (mmHg) | 81 (11) | 85 (12) | <0.001 | 73 (13) | 74 (13) | 0.10 |
| Glucose (mmol/L) | 4.89 (0.55) | 5.10 (0.66) | <0.001 | 5.28 (0.61) | 5.50 (0.55) | <0.001 |
| TG (mmol/L) | 1.40 (0.70) | 1.71 (0.90) | <0.001 | 1.35 (0.57) | 1.59 (0.87) | <0.001 |
| HDL-C (mmol/L) | 1.58 (0.31) | 1.42 (0.31) | <0.001 | 1.66 (0.39) | 1.48 (0.37) | <0.001 |
| TG/HDL-C ratio | 2.17 (1.44) | 2.93 (1.91) | <0.00 | 2.01 (1.19) | 2.75 (2.13) | <0.00 |
SD: standard deviation; BMI: body mass index; SBP: systolic blood pressure; DBP: diastolic blood pressure; FPI: fasting plasma insulin; HOMA-IR: homeostasis model assessment of insulin resistance; HDL-C: high-density lipoprotein cholesterol; TG: triglycerides; WC: waist circumference. Data are expressed as mean ± SD.
Student’s t-test for independent samples.
The relative abilities of the TG/HDL-C ratio and the MetS to identify insulin-resistant individuals are compared in Table 2. Values for both sensitivity and specificity are similar in the two populations, irrespective of which approach is used. Furthermore, the sensitivity and specificity with which insulin-resistant individuals are identified with the TG/HDL-C ratio seem almost identical to those seen when the MetS is used for this purpose, in both instances with relatively modest degrees of sensitivity but greater specificity. Finally, as shown in Figure 1, the area under the ROC curves was identical, 0.69 (95% CI = 0.66–0.72) for TG/HDL-C ratio and 0.69 (95% CI = 0.66-0.72) for MetS.
Table 2.
Sensitivity and specificity of identifying insulin-resistant individuals.
| TG/HDL-C ratio
|
MetS
|
|||
|---|---|---|---|---|
| Sensitivity | Specificity | Sensitivity | Specificity | |
| Rauch (n = 674) | 43 | 77 | 42 | 80 |
| San Andrés de Giles (n = 892) | 43 | 85 | 47 | 84 |
| Both samples (n = 1566) | 43 | 81 | 45 | 82 |
HDL-C: high-density lipoprotein cholesterol; TG: triglycerides; MetS: metabolic syndrome.
Figure 1.
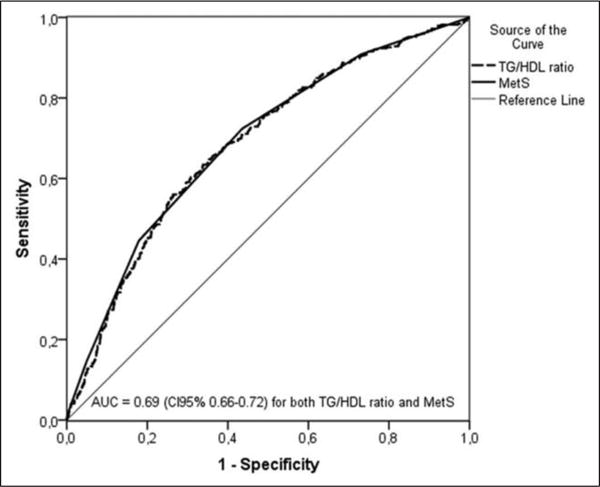
Receiver operating characteristic curves of the triglyceride/high-density lipoprotein cholesterol (TG/HDL-C) ratio and the metabolic syndrome criteria (MetS) for prediction of insulin resistance.
TG/HDL-C: triglyceride/high-density lipoprotein cholesterol; MetS: metabolic syndrome criteria; AUC: area under the curve.
Since the data in Tables 1 and 2 demonstrate that the two experimental populations appear comparable, in the remainder of the analysis they are combined. Table 3 presents the number of individuals who are identified as being insulin resistant (IR: Yes) with either the TG/HDL-C ratio or the MetS, as well as those who are only identified with one or other of the indices, 81% of the sample (1276/1566) was concordantly at ‘high’ or ‘low’ risk by both definitions. Furthermore, 386 and 384 individuals, representing ~25% of the entire population, are identified as being insulin resistant by the TG/HDL-C ratio and the MetS, respectively. It can also be seen that approximately two-thirds of those classified as being insulin resistant overlap with the two approaches, whereas approximately one-third are only identified with one or the other of the two indices (κ = 0.50).
Table 3.
Number of Individuals Classified as Insulin Resistant (IR –Yes).
| Met S | ||||
|---|---|---|---|---|
|
|
||||
| No | Yes | |||
| High TG/HDL | No | 1036 | 144 | 1180 |
| Yes | 146 | 240 | 386 | |
| 1182 | 384 | 1566 | ||
HDL-C: high-density lipoprotein cholesterol, TG: triglycerides, MetS: metabolic syndrome.
Table 4 presents the cardio-metabolic risk profiles that result when the TG/HDL-C ratio or the MetS diagnostic criteria are used to separate individuals into ‘low’ and ‘high’ risk groups. In view of the large proportion of individuals identified by both indices, tests of statistical significance comparing the cardio-metabolic profiles resulting from use of the TG/HDL-C versus the MetS were not performed.
Table 4.
Cardio-metabolic risk profile identified by the TG/ HDL-C ratio versus the MetS.
| A.‘Low’ risk individuals, mean (SD)
| ||
|---|---|---|
| Variable | Low TG/HDL-C ratio (n = 1180) | MetS negative (n = 1182) |
| Age (years) | 44 (18) | 42 (17) |
| FPI (pmol/L) | 49.3 (39.6) | 49.31 (41.0) |
| HOMA-IR | 1.6 (1.4) | 1.6 (1.4) |
| BMI (Kg/m2) | 26.2 (5.4) | 25.7 (5.1) |
| WC (cm) | 91 (14) | 90 (13) |
| SBP (mmHg) | 125 (19) | 123 (17) |
| DBP (mmHg) | 76 (13) | 74 (12) |
| Glucose (mmol/L) | 5.11 (0.61) | 5.00 (0.56) |
| TG (mmol/L) | 1.15 (0.36) | 1.24 (0.54) |
| HDL-C (mmol/dL) | 1.68 (0.34) | 1.63 (0.34) |
|
B. ‘High’ risk individuals, mean (SD) | ||
| Variable | High TG/HDL-C ratio (n = 386) | MetS positive (n = 384) |
|
| ||
| Age (years) | 50 (15) | 55 (14) |
| FPI (pmol/L) | 74.3 (46.5) | 74.3 (43.7) |
| HOMA-IR | 2.6 (1.7) | 2.7 (1.7) |
| BMI (Kg/m2) | 29.1 (5.4) | 30.8 (5.3) |
| WC (cm) | 99 (13) | 103 (10) |
| SBP (mmHg) | 133 (20) | 141 (19) |
| DBP (mmHg) | 81 (13) | 86 (12) |
| Glucose (mmol/L) | 5.27 (0.67) | 5.61 (0.67) |
| TG (mmol/L) | 2.35 (0.81) | 2.09 (0.87) |
| HDL-C (mmol/L) | 1.30 (0.29) | 1.42 (0.36) |
SD: standard deviation; BMI: body mass index; SBP: systolic blood pressure; DBP: diastolic blood pressure; FPI: fasting plasma insulin; HOMA-IR: homeostasis model assessment of insulin resistance; HDL- C: high-density lipoprotein cholesterol; TG: triglycerides; WC: waist circumference; MetS: metabolic syndrome.
Results in Table 4 (A: ‘Low’ risk individuals) indicate that values in a ‘low’ risk group identified by the TG/ HDL-C are almost identical to those individuals who do not have the MetS. Comparison of the data in Table 4 (A: ‘Low’ risk individuals; B: ‘High’ risk individuals) demonstrates that individuals identified as ‘high’ risk, irrespective of the criteria used (TG/HDL-C ratio or MetS), had higher values for FPI, HOMA-IR, BP, BMI, WC, glucose and TG and lower HDL-C concentrations than those identified as ‘low’ risk individuals (p < 0.001 for all variables). It should be emphasized that FPI concentrations and HOMA-IR values are the same, irrespective of using the TG/HDL-C ratio or a diagnosis of the MetS to identify those at ‘high’ risk. In the most general sense, the cardio- metabolic risk profiles of individuals identified as ‘high’ risk by either the TG/HDL-C ratio or the MetS did not seem to differ substantially. Furthermore, what minor differences in absolute values do exist is consistent with the elements used in constructing the two indices. Thus, subjects who meet diagnostic criteria for the MetS tended to be more obese, 5 years older on the average, with somewhat higher values for blood pressure and glucose concentration. However, TG concentrations are somewhat higher and HDL-C concentrations somewhat lower in those deemed at ‘high’ risk on the basis of their TG/ HDL-C ratio.
Discussion
The rationale for this study is that IR/compensatory hyperinsulinemia, and associated metabolic abnormalities, increases the risk of developing a number of clinical syndromes, including type 2 diabetes and coronary heart disease.2–5,15,16 It is generally agreed that identifying individuals manifesting the consequences of IR prior to the appearance of Frank disease would be of clinical benefit, providing information to support interventions aimed at prevention.
A diagnosis of the MetS,5 based on a number of abnormalities associated with IR/hyperinsulinemia, is an example of such an effort, and the presence of the MetS has been shown to predict both type 2 diabetes and coronary heart disease.17,18 The TG/HDL-C plasma concentration ratio may serve as an alternant, and simpler, method than the MetS to identify insulin-resistant individuals at increased cardio-metabolic risk,6,7 and the results of this study provide support for this possibility.
In this study, we have compared the clinical utility of the TG/HDL-C ratio and the MetS at three levels, and the results demonstrate that the two indices perform to a com- parable degree in each instance. First, the sensitivity and the specificity with which the TG/HDL-C cut-points identified insulin-resistant individuals were essentially identical to those using diagnostic criteria for the MetS (Table 2, Figure 1), in each case having relatively modest sensitivity and greater specificity. The sensitivity values found in this study were similar to those previously communicated for the former 2001 ATP III criteria,19,20 and it is obvious that the low sensitivity of both approaches limits their utility as population screening tools. The low sensitivity could be due to the wide spectrum of diseases/conditions associated with IR, and some other markers have been proposed to improve the identification of apparently healthy individuals at high cardio-metabolic risk. For example, it has been proposed that fatty liver might be used as an additional MetS criteria in order to improve the diagnostic sensitivity,21 but the need of an ultrasound (highly operator dependent) renders this no longer a ‘simple’ approach, thereby greatly decreasing its clinical utility. C-reactive protein (CRP), an inflammatory marker correlated to insulin sensitivity,22 has been proposed as a clinical criteria for MetS.23 However, CRP might be increased by a broad spectrum of infectious and inflammatory diseases, and to the best of our knowledge, the diagnostic accuracy to identify IR has not been evaluated. However, the acceptable specificity of TG/ HDL-C ratio (equivalent to MetS diagnosis) suggests that it could be a simpler and useful clinical tool since it provides reasonable confidence that a particular patient is insulin resistant if he or she has a ratio value above the sex-specific cut-points.
Second, Table 3 shows that an equal number of individuals were identified as being insulin resistant by exceeding the TG/HDL-C ratio cut-points (n = 386) as had the MetS (n = 384). It should also be noted that equal numbers (approximately one-third of the population) were identified as being insulin resistant by one or the other of the indices, whereas approximately two-thirds were classified as insulin resistant with either approach.
Third, and of greatest clinical relevance, results in Table 4 demonstrate that the cardio-metabolic risk profiles of individuals identified by use of the TG/HDL-C ratio or the MetS criteria did not differ substantially. It is worth emphasizing that this was the case, irrespective of whether the identified populations were considered to be at either ‘low’ (Table 4, A: ‘Low’ risk individuals) or ‘high’ cardio-metabolic risk (Table 4, B: ‘High’ risk individuals).
If it is granted that the TG/HDL-C ratio and the MetS perform to an equivalent degree as a clinical approach to identify IR and increased cardio-metabolic risk in a population without known disease, does it matter which one is used? One important difference is outcome data showing that a diagnosis of the MetS predicts development of type 2 diabetes and coronary heart disease,17,18 and there is less information attesting to the ability of the TG/HDL-C ratio to accomplish the same task. However, there is published evidence that the TG/HDL-C ratio has been successfully used in predicting the development of diabetes,24 coronary heart disease,25 cardiovascular events and all-cause mortality.26 Furthermore, abdominal obesity, one of the MetS diagnostic criteria, varies as a function of sex and ethnicity,5 and questions remain as to what values should be used and in what populations.
An obvious advantage of using the TG/HDL-C ratio to identify insulin-resistant individuals with a ‘high’ cardio- metabolic risk profile is its simplicity, relying on two commonly used laboratory measurements. In the same context, it does not require a measurement of abdominal obesity, a procedure that is neither routinely performed in most clinical situations nor characterized by a high degree of repro- ducibility.27 However, and similar to the MetS, sex-specific and racial-specific cut-points should be used to maximize performance of the TG/HDL-C ratio.
The most obvious weakness of our study is that it is cross-sectional, and although the TG/HDL-C ratio and the MetS seem to function to a similar degree in identifying cardio-metabolic risk, we cannot conclude that the TG/ HDL-C ratio will be as effective in predicting clinical outcomes as the MetS. Furthermore, the experimental population was primarily of European ancestry, thus neither the particular TG/HDL-C cut-points used in this study nor the clinical comparability with the MetS can be generalized to other ethnic/racial groups. Despite these limitations, the simplicity of this approach has obvious advantages, and we hope that our findings will encourage other investigators to further evaluate the clinical utility of the TG/HDL-C ratio as a way to identify insulin-resistant individuals at high cardio-metabolic risk.
Acknowledgments
This study could not have been conducted without the help of the nurses from the ‘Hospital Municipal of San Andrés de Giles’ and the ‘Hospital Municipal of Rauch’.
Funding
This research received no specific grant from any funding agency in the public, commercial or not-for-profit sectors.
Footnotes
Conflict of interest
The authors declare that there is no conflict of interest.
References
- 1.Yeni-Komshian H, Carantoni M, Abbasi F, et al. Relationship between several surrogate estimates of insulin resistance and quantification of insulin-mediated glucose disposal in 490 healthy nondiabetic volunteers. Diabetes Care. 2000;23:171–175. doi: 10.2337/diacare.23.2.171. [DOI] [PubMed] [Google Scholar]
- 2.Zavaroni I, Bonini L, Gasparini P, et al. Hyperinsulinemia in a normal population as a predictor of non-insulin-dependent diabetes mellitus, hypertension, and coronary heart disease: the Barilla factory revisited. Metabolism. 1999;48:989–994. doi: 10.1016/s0026-0495(99)90195-6. [DOI] [PubMed] [Google Scholar]
- 3.Yip J, Facchini FS, Reaven GM. Resistance to insulin- mediated glucose disposal as a predictor of cardiovascular disease. J Clin Endocrinol Metab. 1998;83:2773–2776. doi: 10.1210/jcem.83.8.5005. [DOI] [PubMed] [Google Scholar]
- 4.Facchini FS, Hua N, Abbasi F, et al. Insulin resistance as a predictor of age-related diseases. J Clin Endocrinol Metab. 2001;86:3574–3578. doi: 10.1210/jcem.86.8.7763. [DOI] [PubMed] [Google Scholar]
- 5.Alberti KG, Eckel RH, Grundy SM, et al. International Diabetes Federation Task Force on Epidemiology and Prevention; National Heart, Lung, and Blood Institute; American Heart Association; World Heart Federation; International Atherosclerosis Society; International Association for the Study of Obesity Harmonizing the metabolic syndrome: a joint interim statement of the International Diabetes Federation Task Force on Epidemiology and Prevention; National Heart, Lung, and Blood Institute; American Heart Association; World Heart Federation; International Atherosclerosis Society; International Association for the Study of Obesity. Circulation. 2009;120:1640–1645. doi: 10.1161/CIRCULATIONAHA.109.192644. [DOI] [PubMed] [Google Scholar]
- 6.McLaughlin T, Abbasi F, Cheal K, et al. Use of metabolic markers to identify overweight individuals who are insulin resistant. Ann Intern Med. 2003;139:802–809. doi: 10.7326/0003-4819-139-10-200311180-00007. [DOI] [PubMed] [Google Scholar]
- 7.McLaughlin T, Reaven G, Abbasi F, et al. Is there a simple way to identify insulin-resistant individuals at increased risk of cardiovascular disease? Am J Cardiol. 2005;96:399–404. doi: 10.1016/j.amjcard.2005.03.085. [DOI] [PubMed] [Google Scholar]
- 8.Laws A, Reaven GM. Evidence for an independent relationship between insulin resistance and fasting plasma HDL- cholesterol, triglyceride and insulin concentrations. J Intern Med. 1992;231:25–30. doi: 10.1111/j.1365-2796.1992.tb00494.x. [DOI] [PubMed] [Google Scholar]
- 9.Li C, Ford ES, Meng YX, et al. Does the association of the triglyceride to high-density lipoprotein cholesterol ratio with fasting serum insulin differ by race/ethnicity? Cardiovasc Diabetol. 2008;7:4. doi: 10.1186/1475-2840-7-4. [DOI] [PMC free article] [PubMed] [Google Scholar]
- 10.Salazar MR, Carbajal HA, Espeche WG, et al. Relation among the plasma triglyceride/high-density lipoprotein cholesterol concentration ratio, insulin resistance, and associated cardio-metabolic risk factors in men and women. Am J Cardiol. 2012;109:1749–1753. doi: 10.1016/j.amjcard.2012.02.016. [DOI] [PubMed] [Google Scholar]
- 11.Salazar MR, Carbajal HA, Curciarello JO, et al. Alanine- aminotransferase: an early marker for insulin resistance? Medicina (B Aires) 2007;67:125–130. [PubMed] [Google Scholar]
- 12.Salazar MR, Carbajal HA, Marillet AG, et al. Glomerular filtration rate, cardiovascular risk factors and insulin resistance. Medicina (B Aires) 2009;69:541–546. [PubMed] [Google Scholar]
- 13.Sumner AE, Harman JL, Buxbaum SG, et al. The triglyceride/high-density lipoprotein cholesterol ratio fails to predict insulin resistance in African-American women: an analysis of Jackson Heart Study. Metab Syndr Relat Disord. 2010;8:511–514. doi: 10.1089/met.2010.0028. [DOI] [PMC free article] [PubMed] [Google Scholar]
- 14.Salazar MR, Carbajal HA, Espeche WG, et al. Relationships among insulin resistance, obesity, diagnosis of the metabolic syndrome and cardio-metabolic risk. Diab Vasc Dis Res. 2011;8:109–116. doi: 10.1177/1479164111403170. [DOI] [PubMed] [Google Scholar]
- 15.Després JP, Lamarche B, Mauriège P, et al. Hyperinsulinemia as an independent risk factor for ischemic heart disease. N Engl J Med. 1996;334:952–957. doi: 10.1056/NEJM199604113341504. [DOI] [PubMed] [Google Scholar]
- 16.Reaven GM. Insulin resistance: from bit player to centre stage. CMAJ. 2011;183:536–537. doi: 10.1503/cmaj.101430. [DOI] [PMC free article] [PubMed] [Google Scholar]
- 17.Ford ES. Risks for all-cause mortality, cardiovascular disease, and diabetes associated with the metabolic syndrome: a summary of the evidence. Diabetes Care. 2005;28:1769–1778. doi: 10.2337/diacare.28.7.1769. [DOI] [PubMed] [Google Scholar]
- 18.Wilson PW, D’Agostino RB, Parise H, et al. Metabolic syndrome as a predictor of cardiovascular disease and type 2 diabetes. Circulation. 2005;112:3066–3072. doi: 10.1161/CIRCULATIONAHA.105.539528. [DOI] [PubMed] [Google Scholar]
- 19.Liao Y, Kwon S, Shaughnessy S, et al. Critical evaluation of adult treatment panel III criteria in identifying insulin resistance with dyslipidemia. Diabetes Care. 2004;27:978–983. doi: 10.2337/diacare.27.4.978. [DOI] [PubMed] [Google Scholar]
- 20.Sierra-Johnson J, Johnson BD, Allison TG, et al. Correspondence between the adult treatment panel III criteria for metabolic syndrome and insulin resistance. Diabetes Care. 2006;29:668–672. doi: 10.2337/diacare.29.03.06.dc05-0970. [DOI] [PubMed] [Google Scholar]
- 21.Musso G, Gambino R, Bo S, et al. Should nonalcoholic fatty liver disease be included in the definition of metabolic syndrome? A cross-sectional comparison with Adult Treatment Panel III criteria in nonobese nondiabetic subjects Diabetes Care. 2008;31:562–568. doi: 10.2337/dc07-1526. [DOI] [PubMed] [Google Scholar]
- 22.Festa A, D’Agostino R, Jr, Howard G, et al. Chronic sub- clinical inflammation as part of the insulin resistance syndrome: the Insulin Resistance Atherosclerosis Study (IRAS) Circulation. 2000;102:42–47. doi: 10.1161/01.cir.102.1.42. [DOI] [PubMed] [Google Scholar]
- 23.Ridker PM, Wilson PW, Grundy SM. Should C-reactive protein be added to metabolic syndrome and to assessment of global cardiovascular risk? Circulation. 2004;109:2818–2825. doi: 10.1161/01.CIR.0000132467.45278.59. [DOI] [PubMed] [Google Scholar]
- 24.De León AC, Coello SD, González DA, et al. Impaired fasting glucose, ancestry and waist-to-height ratio: main predictors of incident diagnosed diabetes in the Canary Islands. Diabet Med. 2012;29:399–403. doi: 10.1111/j.1464-5491.2011.03420.x. [DOI] [PubMed] [Google Scholar]
- 25.Hadaegh F, Khalili D, Ghasemi A, et al. Triglyceride/HDL- cholesterol ratio is an independent predictor for coronary heart disease in a population of Iranian men. Nutr Metab Cardiovasc Dis. 2009;19:401–408. doi: 10.1016/j.numecd.2008.09.003. [DOI] [PubMed] [Google Scholar]
- 26.Bittner V, Johnson BD, Zineh I, et al. The triglyceride/ high-density lipoprotein cholesterol ratio predicts all-cause mortality in women with suspected myocardial ischemia: a report from the Women’s Ischemia Syndrome Evaluation (WISE) Am Heart J. 2009;157:548–555. doi: 10.1016/j.ahj.2008.11.014. [DOI] [PMC free article] [PubMed] [Google Scholar]
- 27.The Emerging Risk Factors Collaboration. Separate and combined associations of body-mass index and abdominal adiposity with cardiovascular disease: collaborative analysis of 58 prospective studies. Lancet. 2011;377:1085–1095. doi: 10.1016/S0140-6736(11)60105-0. [DOI] [PMC free article] [PubMed] [Google Scholar]