Abstract
Human clear cell renal cell carcinoma (ccRCC) is the most common solid lesion within kidney, and its prognostic is influenced by the progression covering a complex network of gene interactions. In our study, we screened differential expressed genes, and constructed protein-protein interaction (PPI) network and a weighted gene co-expression network to identify key genes and pathways associated with the progression of ccRCC (n = 56). Functional and pathway enrichment analysis demonstrated that upregulated differentially expressed genes (DEGs) were significantly enriched in response to wounding, positive regulation of immune system process, leukocyte activation, immune response and cell activation. Downregulated DEGs were significantly enriched in oxidation reduction, monovalent inorganic cation transport, ion transport, excretion and anion transport. In the PPI network, top 10 hub genes were identified (TOP2A, MYC, ALB, CDK1, VEGFA, MMP9, PTPRC, CASR, EGFR and PTGS2). In co-expression network, 6 ccRCC-related modules were identified. They were associated with immune response, metabolic process, cell cycle regulation, angiogenesis and ion transport. In conclusion, our study illustrated the hub genes and pathways involved in the progress of ccRCC, and further molecular biological experiments are needed to confirm the function of the candidate biomarkers in human ccRCC.
Keywords: clear cell renal cell carcinoma (ccRCC), differentially expressed genes (DEGs), biomarker, weighted gene co-expression network analysis (WGCNA), protein-protein interaction (PPI)
Introduction
Renal cell carcinoma (RCC), which makes up approximately 3% of all adult malignancies and 90-95% of adult kidney neoplasm, is being diagnosed with increasing incidence and mortality rates worldwide 1. Clear cell renal cell carcinoma (ccRCC) is the most common tumor in kidney. However, its prognostic is influenced by the progression covering a complex network of gene interactions. As the most common pathological type of renal cancer, apart from surgery, it is both radiotherapy and chemotherapy resistant. At present, biomarkers for early detection and follow-up of the disease are not available. Therefore, targeted therapies are the best choices of non-surgical treatment for ccRCC 2. Many studies revealed that targeted therapies, such as multipotase inhibitors, anti-VEGF antibodies and mTOR, had been approved for clinical use 3. However, identification of novel therapeutic targets or biomarkers for prognostic, diagnostic or predictive use remains a priority.
Currently, gene expression profiles have been used to identify genes associated with progression of renal cancer 4-7. Meanwhile, some researchers also used integrated approach to screen changes in renal carcinogenesis 8, 9. However, most studies just focused on the screening of differentially expressed genes and ignored the high degree of interconnection between genes, although genes with similar expression patterns may be functionally related. Weighted gene expression network analysis (WGCNA) is a systems biology method for describing the correlation patterns among genes across microarray or RNA Sequence data, and it is an algorithm used for finding clusters (modules) of highly correlated genes as well as identifying phenotype related modules or genes clusters 10. Nowadays, there are various studies revealing the phenotypes-related genes via WGCNA method, especially in cancers 11, 12. For example, Zhou et al. found that TOP2A could be used as the potential prognostic and progression biomarker for pancreatic ductal adenocarcinoma 12. Wang et al. revealed that ASPM could cause cirrhosis and eventually led to hepatocellular carcinoma 13. In this study, we attempt to firstly screen differential expressed genes, construct protein-protein interaction networks and a co-expression network of relationships between genes through a systematic biology method based on WGCNA and to identify key genes and pathways participating in the carcinogenesis of ccRCC 13, 14.
Materials and Methods
Data collection
Gene expression profile was downloaded from Gene Expression Omnibus (GEO) database (http://www.ncbi.nlm.nih.gov/geo/). Dataset GSE53000 performed on Affymetrix Human Gene 1.0 ST Array [transcript (gene) version] (Affymetrix, Santa Clara, CA, USA) was used to screen differential expressed genes, construct protein-protein interaction networks and co-expression networks and identify hub genes and pathways in this study. This dataset included 56 clear cell renal cell carcinoma samples (including 2 lymph node metastasis samples and 1 venous thrombus samples) and 6 normal kidney samples.
Study design and data preprocessing
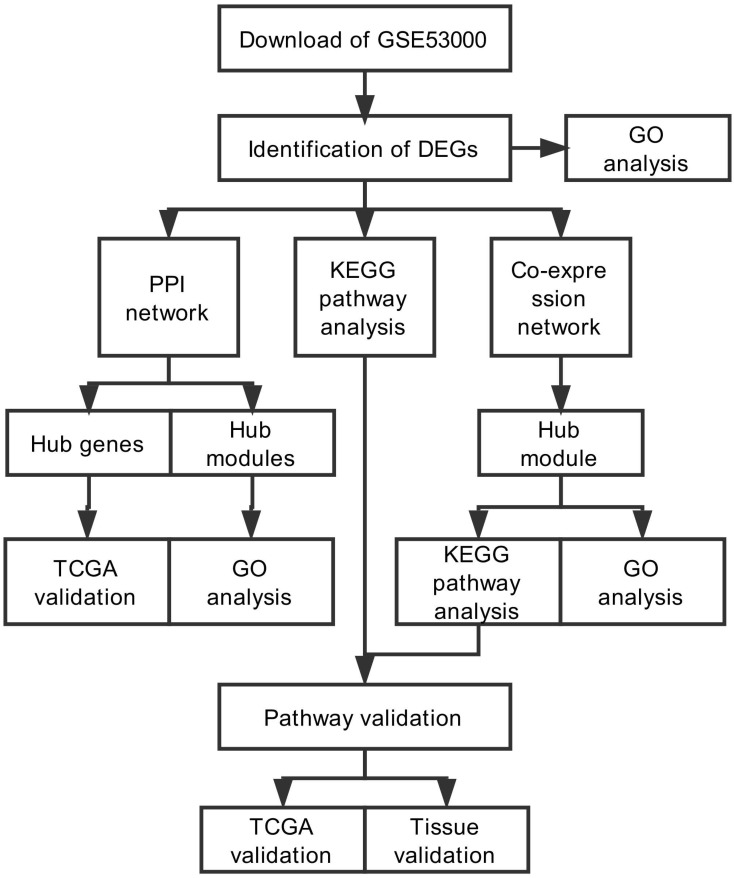
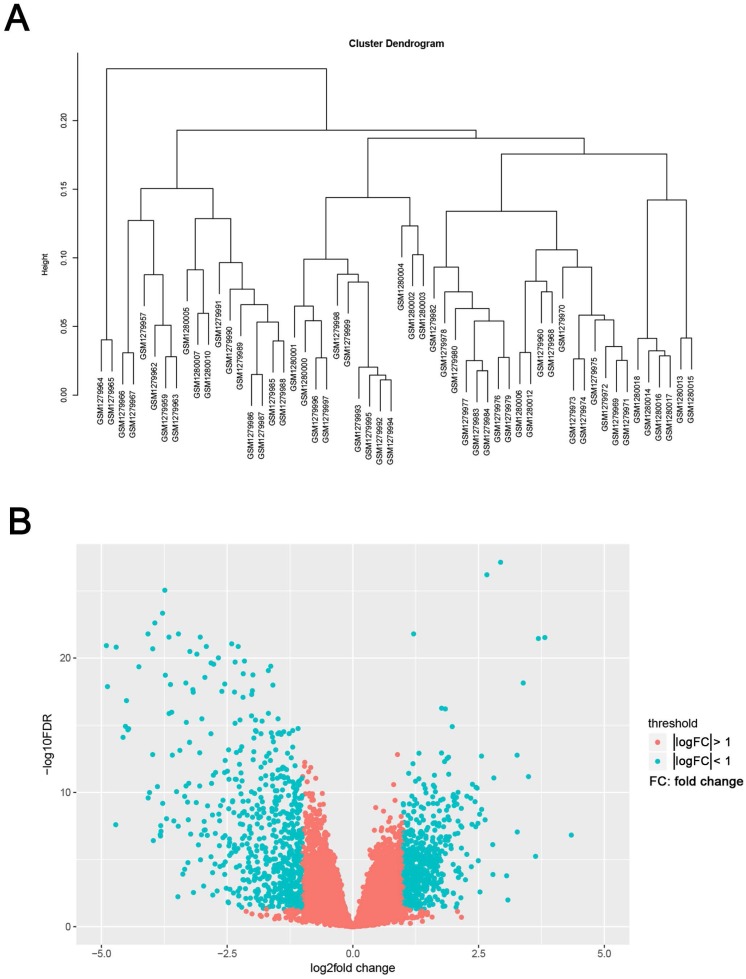
The study design was performed in a flow diagram (Fig. 1). Raw expression data were calculated following the pre-processing procedures: RMA background correction, log2transformation, quantile normalization and median polish algorithm summarization using the “affy” R package. Probes were annotated by the Affymetrix annotation files. Microarray quality was assessed by sample clustering according to the distance between different samples in Pearson's correlation matrices. No samples were removed from subsequent analysis in the test dataset (Fig. 2A).
Figure 1.
Flow diagram of study. Data preparing, processing and analysis was shown in the flow diagram.
Figure 2.
Samples clustering and identification of differentially expressed genes (DEGs) in ccRCC tissues. (A) Samples clustering of GSE53000 to detect outliers. (B) The volcano plot of all DEGs.
Differentially expressed genes (DEGs) screening
We use the “limma” R package to screen the DEGs between ccRCC samples and normal kidney samples. The FDR (false discovery rate) < 0.05 and |log2fold change (FC)| > 1 were chosen as the cut-off criteria (Fig. 2B). Furthermore, we chose the same condition and screened differentially expressed genes between ccRCC samples and metastasis samples.
Functional and pathway enrichment analysis
The Database for Annotation, Visualization and Integrated Discovery (DAVID) (http://david.abcc.ncifcrf.gov/) is an online program providing a comprehensive set of functional annotation tools for investigators to understand biological meaning behind large list of genes 15. Enriched biological themes of DEGs, particularly GO terms and visualization of those on KEGG pathway maps were performed using DAVID database, p < 0.05 was set as the cut-off criterion.
PPI network construction
We used Search Tool for the Retrieval of Interacting Genes (STRING) Database (STRING) (http://www.string-db.org/) to assess protein-protein interaction (PPI) information 16. In addition, to evaluate the interrelationships of DEGs, we used STRING database for analysis and Cytoscape software for visualization 17. Confidence score > 0.4 was set as significant.
Hub module selection and functional analysis
We used plug-in Molecular Complex Detection (MCODE) to select hub modules of PPI network in Cytoscape 18. Meanwhile, degree = 5, node score = 0.2, k-core = 2, and max. depth = 100 were used as cut-off criteria. Then we uploaded the genes in hub module to DAVID database to perform functional analysis.
Co-expression network construction and module functional analysis
Firstly, expression data profile of DEGs was tested to check if they were the good samples and good genes. Then, we used the “WGCNA” package in R to construct co-expression network for the DEGs 19, 20. At first, the Pearson's correlation matrices were both performed for all pair-wise genes. Then, a weighted adjacency matrix was constructed using a power function amn = |cmn|β (cmn = Pearson's correlation between gene m and gene n; amn = adjacency between gene m and gene n). β was a soft-thresholding parameter that could emphasize strong correlations between genes and penalize weak correlations. Next, the adjacency was transformed into topological overlap matrix (TOM), which could measure the network connectivity of a gene defined as the sum of its adjacency with all other genes for network generation. To classify genes with similar expression profiles into gene modules, average linkage hierarchical clustering was conducted according to the TOM-based dissimilarity measure with a minimum size (gene group) of 50 for the genes dendrogram. To further analyze the module, we calculated the dissimilarity of module eigengenes, chose a cut line for module dendrogram and merged some modules, after which we performed GO enrichment analysis and KEGG pathway enrichment analysis on gene modules to characterize modules related to ccRCC.
Hub genes and pathway validation
Here, we chose genes with the most connectivities as hub genes and used TCGA KIRC data to perform validation using GEPIA database 21. Common pathways in all modules were chosen to perform validation on both TCGA data and patients tissues.
Preparation for human ccRCC samples
The ccRCC and paracancerous tissues samples were collected from patients after surgery at Zhongnan Hospital of Wuhan University. The histology diagnosis was confirmed by two pathologists independently. The ccRCC and paracancerous tissues were immediately frozen and stored in liquid nitrogen or fixed in 4 % PFA after collection. The study using ccRCC and paracancerous tissue samples for total RNA isolation and qRT-PCR analysis was approved by the Ethics Committee at Zhongnan Hospital of Wuhan University (approval number: 2015029). Informed consent was obtained from all subjects.
Total RNA isolation
Total RNA from ccRCC tissues were isolated using RNeasy Mini Kit (Cat. #74101, Qiagen, Germany) according to the manufacturer's instruction. DNase I digestion (Cat. #79254, Qiagen, Germany) was used in each RNA preparation to remove genomic DNA. After that, total RNA quantity was measured using NanoPhotometer (Cat. #N60, Implen, Germany).
Quantitative real time PCR (qRT-PCR)
The cDNA was synthesized using 1 µg of total RNA isolated from patients tissues by ReverTra Ace qPCR RT Kit (Toyobo, China) and qRT-PCR was performed using 400 ng cDNA per 25 μl reaction. Each reaction was conducted with iQTM SYBR® Green Supermix (Bio-Rad, China) using 400 or 500 ng of cDNA in a final volume of 25 µl. Primers sequences and annealing temperature were summarized in Supplementary Tab. S1.
Statistical analyses
All analyses were performed three times and represent data from three individual experiments. Two-tailed Student's t-test was used for significance of differences between subgroups. Statistical analyses were performed with SPSS 16.0. Statistical significance was set at probability values of p < 0.05.
Results
Identification of DEGs in ccRCC tissues
The gene expression profiling of GSE53000 including 56 ccRCC tissues and 6 normal kidney tissues were analysed. Using “limma” package of R software, selecting p < 0.05 and |log2fold change (FC)| > 1 as the cut-off criteria, 1175 DEGs were identified, of which, 533 were upregulated and 642 were downregulated (Supplementary Tab. S2). The volcano plot of all DEGs is shown in Fig. 2B. Meanwhile, we screened 11 genes differentially expressed in metastasis samples compared with primary ccRCC (Supplementary Tab. S3).
Functional enrichment analysis of DEGs
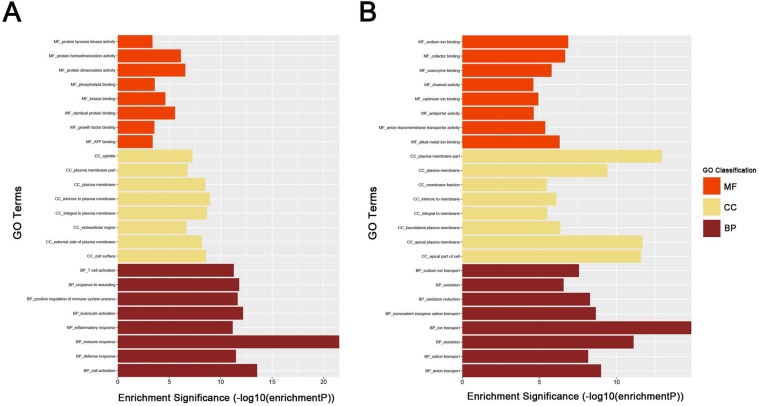
To obtain further insight into the function of DEGs of ccRCC, the up- and downregulated DEGs were respectively uploaded to the DAVID database. GO analysis results showed as to biological process (BP), the upregulated DEGs significantly enriched in response to wounding, positive regulation of immune system process, leukocyte activation, immune response and cell activation, and the downregulated DEGs significantly enriched in oxidation reduction, monovalent inorganic cation transport, ion transport, excretion and anion transport. For molecular function (MF), the upregulated DEGs significantly enriched in protein homodimerization activity, protein dimerizetion activity, phospholipid binding, kinase binding and identical protein binding, and downregulated DEGs significantly enriched in sodium ion binding, cofactor binding, alkali metal ion binding, coenzyme binding and anion transmembrane transporter activity. About cellular component, the upregulated DEGs significantly enriched in intrinsic to plasma membrane, integral to plasma membrane, cell surface, plasma membrane and external side of plasma membrane, and downregulated DEGs significantly enriched in plasma membrane part, apical plasma membrane, apical part of cell, plasma membrane and basolateral plasma membrane (Fig. 3A-B). These significantly enriched GO terms could help us a lot to further understand the role of DEGs played in ccRCC development and progression.
Figure 3.
GO analysis of DEGs. (A) upregulated DEGs with fold change > 2. (B) downregulated DEGs with fold change < -2. BP: biological process, CC: cellular component, MF: molecular function.
KEGG pathway enrichment analysis of DEGs
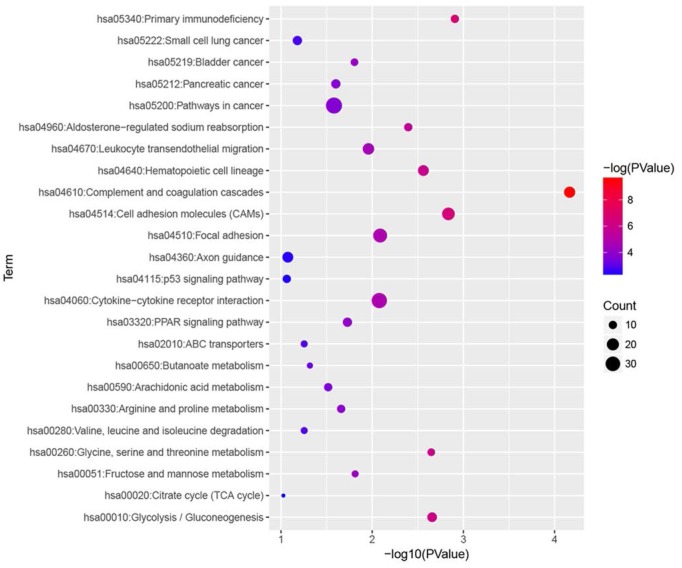
KEGG pathway analysis was performed for all DEGs, and we found that complement and coagulation cascades, primary immunodeficiency, cell adhesion molecules (CAMs), glycolysis / gluconeogenesis and glycine, serine and threonine metabolism were most significantly enriched (Fig. 4).
Figure 4.
KEGG enrichment analysis of all DEGs with |fold change| > 2. All differentially expressed genes (DEGs) were analysed by KEGG enrichment. Fold change > 2 was set as cut-off value.
PPI network construction
Based on the string profile obtained from STRING analysis tool (Supplementary Tab. S3), the PPI network of DEGs consisted of 949 nodes and 4774 edges, including 367 upregulated genes and 414 downregulated genes. We considered the top 10 DEGs with high degree of connectivity as the hub genes of ccRCC (TOP2A, MYC, ALB, CDK1, VEGFA, MMP9, PTPRC, CASR, EGFR and PTGS2), which may play a critical role in tumorogenesis and proliferation.
Hub module selection and validation
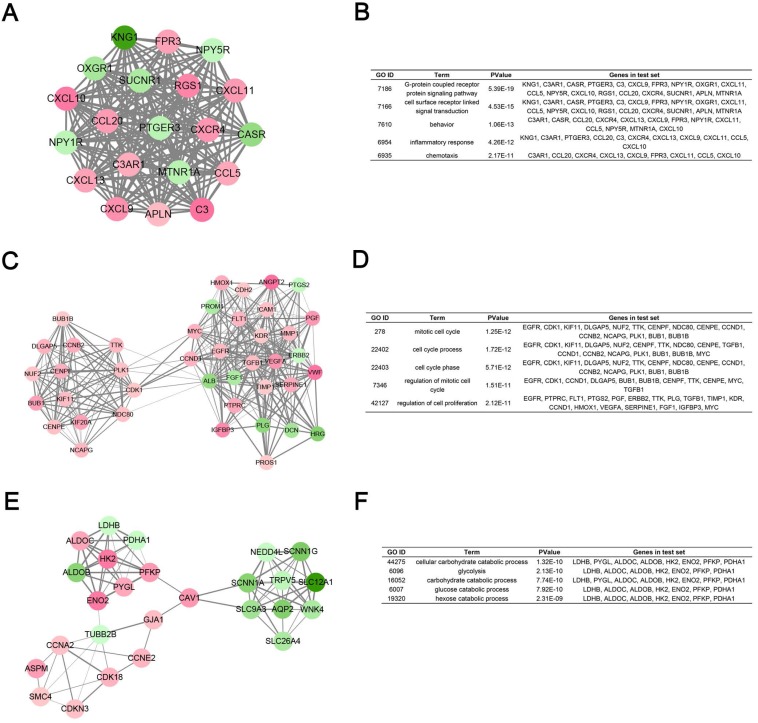
Degree cut-off = 5, node score cut-off = 0.2, k-core = 2, and max. depth = 100 as the criterion, top 3 significant modules were selected by using plug-in MCODE. Gene Ontology analysis of each module was performed in DAVID database (Fig. 5).
Figure 5.
Module analysis of PPI network. (A) Module rank 1. (B) GO enrichment analysis of module rank 1. (C) Module rank 2. (D) GO enrichment analysis of module rank 2. (E) Module rank 3. (F) GO enrichment analysis of module rank 3.
Weighted co-expression network construction and analysis
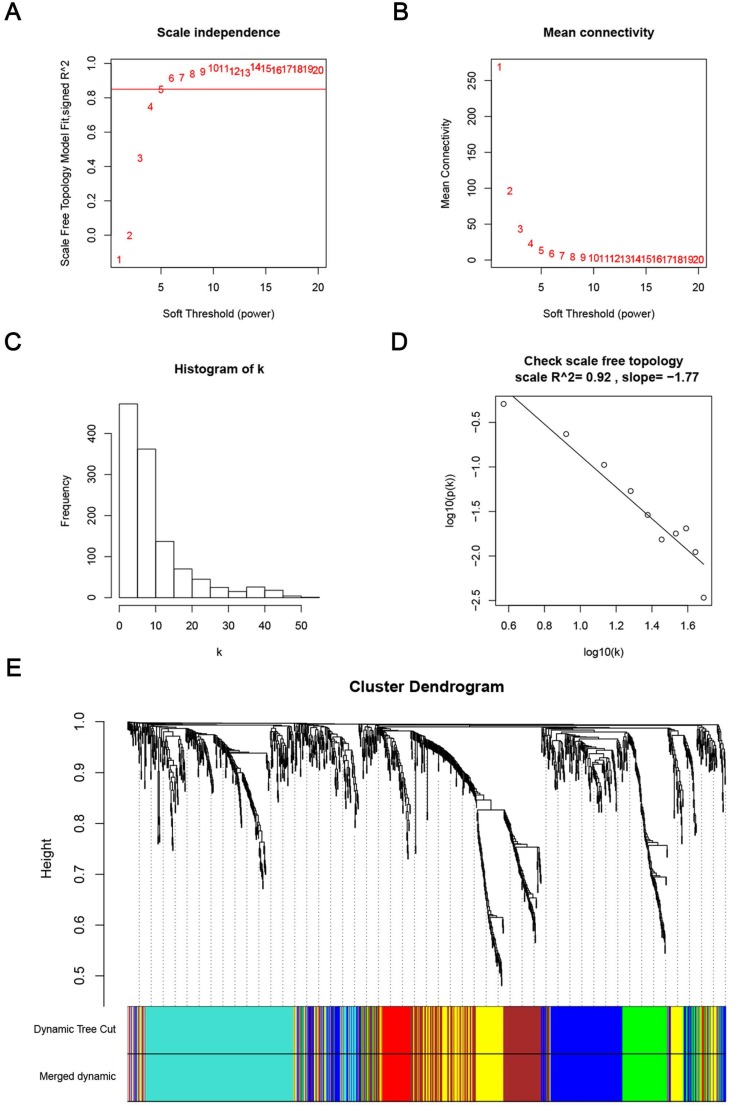
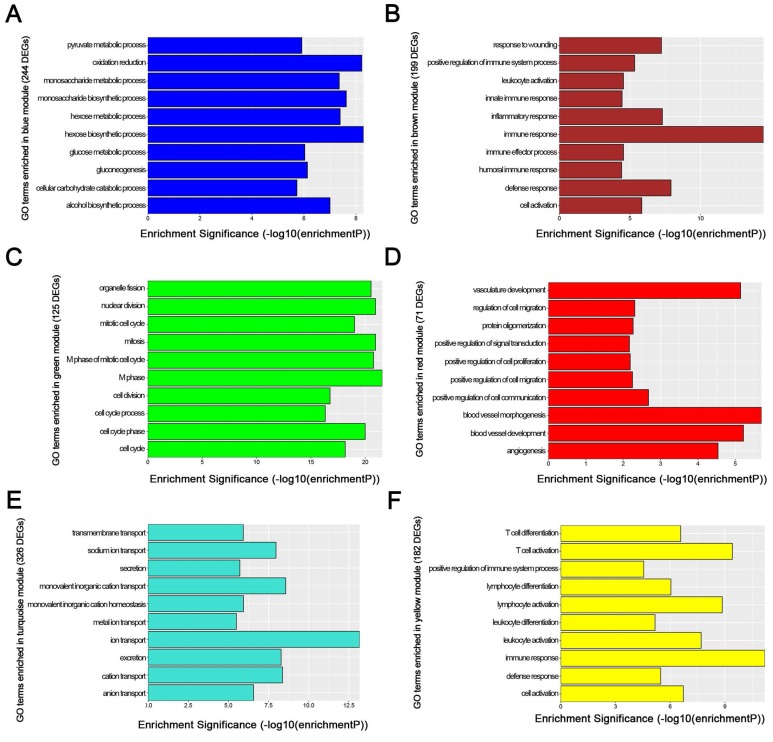
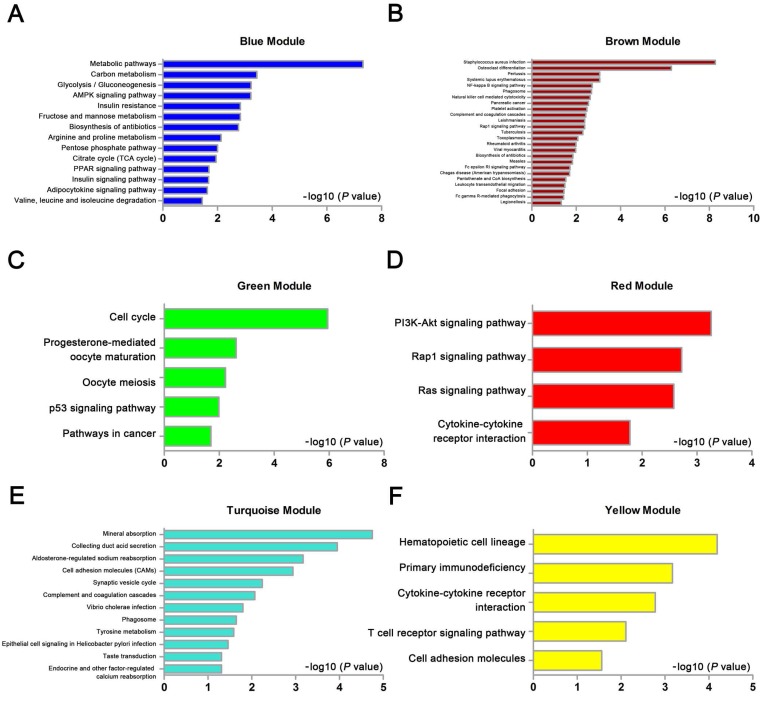
We used “WGCNA” package in R, after the quality assessment for expression data matrix of GSE53000, select the power of β = 6 (scale free R2 = 0.92) to ensure a scalefree network (Fig. 6A-D). After putting the DEGs with similar expression patterns into modules by average linkage clustering, a total of 7 modules were identified (Fig. 6E). Except grey module, Gene Ontology was performed for other 6 modules so as to explore the underlying biological process correlated to ccRCC. In Fig. 7, we could find that DEGs in blue module significantly enriched in hexose biosynthetic process, oxidation reduction and monosaccharide biosynthetic process. In brown module, DEGs were enriched in immune response, defense response and inflammatory response. In green module, DEGs were enriched in M phase, nuclear division and mitosis. In red module, DEGs were enriched in blood vessel morphogenesis, blood vessel development and vasculature development. In turquoise module, DEGs were enriched in ion transport, monovalent inorganic cation transport and cation transport. In yellow module, DEGs were enriched in immune response, T cell activation and lymphocyte activation. In Fig. 8, we found the common pathways related to renal carcinoma: PI3K/AKT pathway, Rap1 pathway, NF-kappa B pathway and insulin associated pathways.
Figure 6.
Determination of soft-thresholding power in the weighted gene co-expression network analysis (WGCNA). (A) Analysis of the scale-free fit index for various soft-thresholding powers (β). (B) Analysis of the mean connectivity for various soft-thresholding powers. (C) Histogram of connectivity distribution when β = 6. (D) Checking the scale free topology when β = 6. (E) Dendrogram of all differentially expressed genes clustered based on a dissimilarity measure (1-TOM).
Figure 7.
GO enrichment analysis of 6 genes modules. (A) blue module, (B) brown module, (C) green module, (D) red module, (E) turquoise module and (F) yellow module.
Figure 8.
KEGG pathway enrichment analysis of 6 genes modules. (A) blue module, (B) brown module, (C) green module, (D) red module, (E) turquoise module and (F) yellow module.
Hub genes and pathway validation
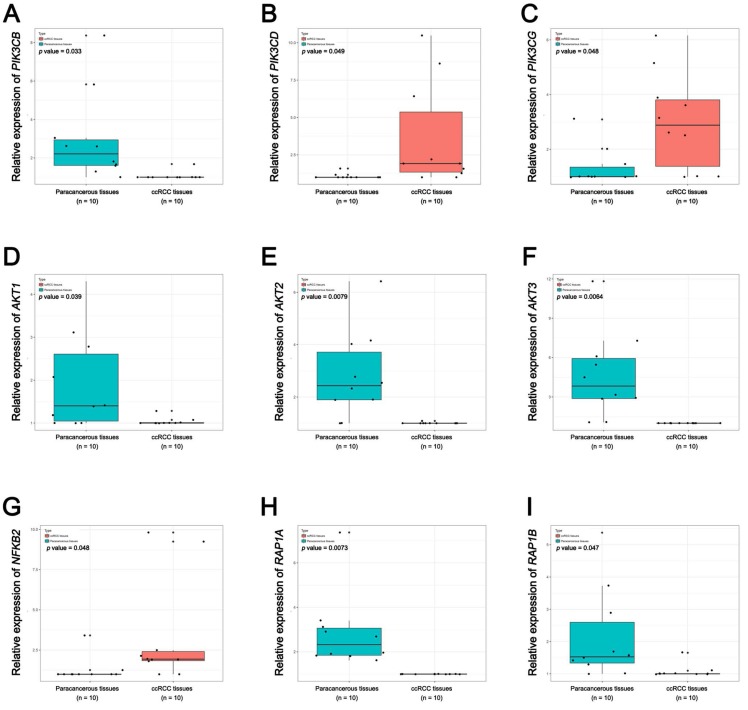
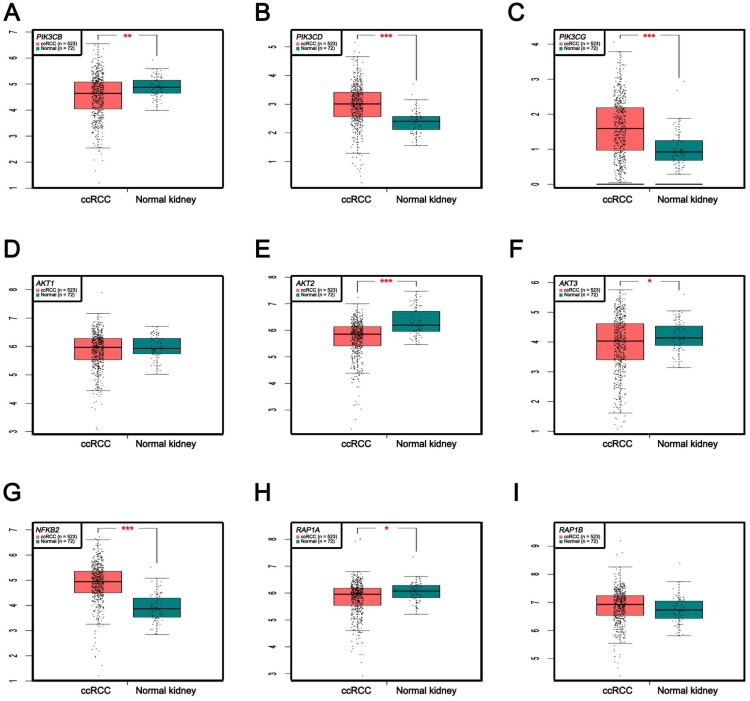
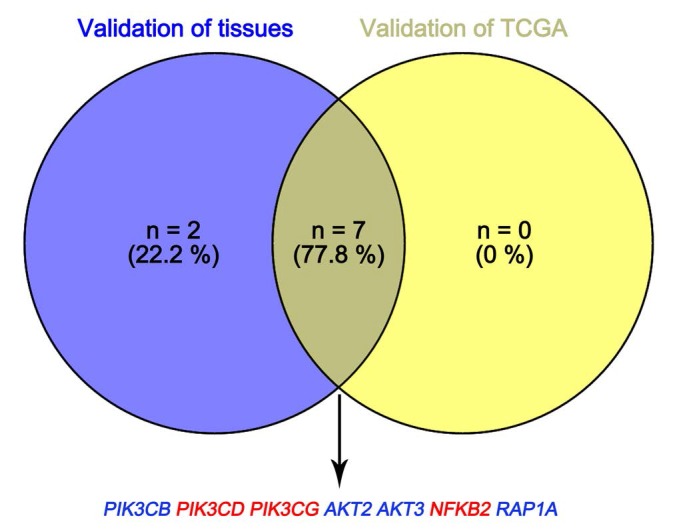
In Supplementary Fig. S1-2, we performed validation of hub genes using TCGA KIRC data and microarray data (GSE53000). We found that CASR and PTGS2 were tumor suppressors in both microarray and RNA-Seq data; CDK1, EGFR, MMP9, MYC, PTPRC, TOP2A and VEGFA were oncogenes in the common expression data. To perform the pathway validation, we chose the common pathway related to renal carcinogenesis and validated the key molecules using qRT-PCR. We found PIK3CD, PIK3CG and NFKB2 were upregulated in tumor samples and PIK3CB, AKT1, AKT2, AKT3, RAP1A and RAP1B were downregulated in tumor samples (Fig. 9). To further validate the pathway, we use TCGA KIRC data to perform the validation as well (Fig. 10). And we found that there were 7 genes deregulated in common validation sets (PIK3CB, PIK3CD, PIK3CG, AKT2, AKT3, NFKB2, RAP1A, Fig. 11).
Figure 9.
Pathway validation using qRT-PCR analysis. (A) PIK3CB, (B) PIK3CD, (C) PIK3CG, (D) AKT1, (E) AKT2, (F) AKT3, (G) NFKB2, (H) RAP1A and (I) RAP1B.
Figure 10.
Pathway validation using TCGA KIRC data. (A) PIK3CB, (B) PIK3CD, (C) PIK3CG, (D) AKT1, (E) AKT2, (F) AKT3, (G) NFKB2, (H) RAP1A and (I) RAP1B (* p < 0.05; ** p < 0.01; *** p <0.001).
Figure 11.
Venn plot of common deregulated genes. Blue: downregulated genes; red: upregulated genes.
Discussion
Clear cell renal cell carcinoma is biologically heterogeneous and has variable clinical courses, therefore, it is essential to understand the molecular mechanism for better diagnosis and treatment of ccRCC. In this study, we investigated the gene expression profile of GSE53000, including 56 clear cell renal cell carcinoma samples (including 2 lymph node metastasis samples and 1 venous thrombus samples) and 6 normal kidney samples to explore the molecular mechanism of ccRCC and find some biomarkers, which might be helpful therapeutic targets by using bioinformatics analysis.
In this study, results showed that expressions of total 1175 genes were altered between normal kidney tissues and ccRCC tissues at FDR < 0.05. Among the 1175 DEGs, 533 were upregulated and 642 were downregulated. PPI network analysis and WGCNA analysis were performed to identify protein-protein interactions and gene co-expression modules related with the clinical features of ccRCC. In addition, functional and pathway analysis were also performed to find ccRCC-related biological process and pathways.
According to the GO analysis of DEGs, we found that upregulated DEGs were significantly enriched in immune response, cell activation, leukocyte activation and positive regulation of immune system process; downregulated DEGs were significantly enriched in ion transport, monovalent inorganic cation transport, cation transport and anion transport. Giraldo NA et al. investigated that the infiltration and the localization of DC, and the expression of immune checkpoints (PD-1, LAG-3, PD-L1, and PD-L2) in relation with prognosis in the tumor microenvironment modulated the clinical impact of CD8(+) T cells in ccRCC 22. In addition, Balan M et al. also reported that c-Met can promote increased survival of renal cancer cells through the regulation of HO-1 and PD-L1 23. Ciarimboli G et al. found that OCT2 played a decisive role in the renal secretion of creatinine and the process could be inhibited by OCT2 substrates 24. Pochini L et al. also discovered that OCTN cation transporters were associated with several pathologies 25. Meanwhile, KEGG pathway analysis revealed those glycolysis/gluconeogenesis and glycine, serine and threonine metabolisms were significantly enriched. Many studies illustrated that carcinogenesis could have very closely correlation with metabolism 26-28. As to renal carcinoma, significant progress had been made to understand the metabolic derangements present, which had been derived through translational, in vitro, and in vivo studies. So far, von Hippel-Lindau (VHL) loss was the well-characterized metabolic features linked to renal cancer 29. And several metabolic pathways were altered, including glycolysis and oxidative phosphorylation due to VHL loss and the influence caused by increasing expression of hypoxia-inducible factor 30-35.
Furthermore, protein-protein interaction network analysis demonstrated that TOP2A, MYC, ALB, CDK1, VEGFA, MMP9, PTPRC, CASR, EGFR and PTGS2 had the highest degree of connectivity among DEGs. TOP2A and CDK1 played an important role in regulation of cell cycle, which might modulate the tumor proliferation 36-38. MYC, as an oncogene, encoded a transcription factor, triggered selective gene expression amplification to promote cell growth and proliferation 39. Shroff EH et al. demonstrated that MYC overexpression causes RCC and pointed to the inhibition of glutamine metabolism 40. ALB was reported to be an independent prognostic factor for patients with mRCC treated with angiogenesis-targeted therapy 41. VEGFA, as a member of PDGF/VEGF growth factor family, induced proliferation and migration of vascular endothelial cells, and was essential for both physiological and pathological angiogenesis, which played a vital role in renal carcinogenesis 42, 43. MMP9 (matrix metalloproteinase-9) was reported to have a strong correlation with tumor invasion and migration 44-46. PTPRC, as an essential regulator of T- and B-cell antigen receptor signaling, might influence tumor proliferation via immune regulation 47. CASR was a robust promoter of differentiation in colonic epithelial cells and functions as a tumor suppressor in colon cancer 48. EGFR, upregulated in ccRCC, was a receptor tyrosine kinase involved in many important aspects of cell biology that are related to tumorigenesis 49-51. PTGS2 was reported to be an prognostic biomarker for poor clinical outcome of upper tract urothelial cancer 52.
WGCNA analysis found six modules with highly relevant expression pattern. Then Gene Ontology enrichment analysis was performed to explore the biological process of each module. Blue module including 244 DEGs was involved in glycometabolic process such as hexose biosynthetic process, monosaccharide biosynthetic process and hexose metabolic process. Many studies had mentioned the close relationship between metabolism and renal carcinoma 53, 54. Brown module including 199 DEGs was associated with immune response. Meanwhile, yellow module including 182 DEGs also participated in immune response, which revealed the correlation between renal cancer and immune regulation. 125 DEGs in green module were enriched in cell cycle regulation, playing a critical role in tumor proliferation. Red module including 71 DEGs was closely related to angiogenesis and vascular repair, relating to the prognosis of ccRCC. Turquoise module including 326 DEGs has a strong correlation to ion transport, which might participated in the tumor migration and invasion.
In conclusion, by using a series of bioinformatics analysis, we have illustrated the hub genes and pathways which may be involved in the progress of ccRCC, based on differentially expressed genes between ccRCC samples and normal kidneys. However, further molecular biological experiments are needed to confirm the function of the candidate biomarkers in ccRCC.
Supplementary Material
Supplementary figures and tables.
Acknowledgments
The excellent technical assistance of Yuan Zhu, Shanshan Zhang and Danni Shan at Zhongnan Hospital of Wuhan University is gratefully acknowledged. This study was supported in part by grants from Zhongnan Hospital of Wuhan University Science, Technology and Innovation Seed Fund (grant number: cxpy20160010 and cxpy20160031), Wuhan Clinical Cancer Research Center of Urology and Male Reproduction (grant number 303-230100055) and National Natural Science Foundation of China (grant number 81772730). The funders had no role in study design, data collection and analysis, decision to publish, or preparation of the manuscript.
Abbreviations
- ccRCC
Clear Cell Renal Cell Carcinoma
- WGCNA
Weighted Gene Co-expression Network Analysis
- TCGA
The Cancer Genome Atlas
- DEGs
Differentially Expressed Genes
- TOM
Topological Overlap Matrix
- STRING
Search Tool for the Retrieval of Interacting Genes
- PPI
Protein-Protein Interaction
- DAVID
Database for Annotation, Visualization and Integrated Discovery.
References
- 1.Siegel RL, Miller KD, Jemal A. Cancer Statistics, 2017. CA Cancer J Clin. 2017;67:7–30. doi: 10.3322/caac.21387. [DOI] [PubMed] [Google Scholar]
- 2.Vera-Badillo FE, Templeton AJ, Duran I. et al. Systemic therapy for non-clear cell renal cell carcinomas: a systematic review and meta-analysis. Eur Urol. 2015;67:740–9. doi: 10.1016/j.eururo.2014.05.010. [DOI] [PubMed] [Google Scholar]
- 3.Heng DY, Mackenzie MJ, Vaishampayan UN. et al. Primary anti-vascular endothelial growth factor (VEGF)-refractory metastatic renal cell carcinoma: clinical characteristics, risk factors, and subsequent therapy. Ann Oncol. 2012;23:1549–55. doi: 10.1093/annonc/mdr533. [DOI] [PMC free article] [PubMed] [Google Scholar]
- 4.Dahinden C, Ingold B, Wild P. et al. Mining tissue microarray data to uncover combinations of biomarker expression patterns that improve intermediate staging and grading of clear cell renal cell cancer. Clin Cancer Res. 2010;16:88–98. doi: 10.1158/1078-0432.CCR-09-0260. [DOI] [PubMed] [Google Scholar]
- 5.Gerlinger M, Horswell S, Larkin J. et al. Genomic architecture and evolution of clear cell renal cell carcinomas defined by multiregion sequencing. Nat Genet. 2014;46:225–33. doi: 10.1038/ng.2891. [DOI] [PMC free article] [PubMed] [Google Scholar]
- 6.Yang W, Yoshigoe K, Qin X. et al. Identification of genes and pathways involved in kidney renal clear cell carcinoma. BMC Bioinformatics. 2014;15(Suppl 17):S2. doi: 10.1186/1471-2105-15-S17-S2. [DOI] [PMC free article] [PubMed] [Google Scholar]
- 7.Yuan L, Chen L, Qian K, Qian G, Wu CL, Wang X, Xiao Y. Co-expression network analysis identified six hub genes in association with progression and prognosis in human clear cell renal cell carcinoma (ccRCC) Genom Data. 2017;14:132–40. doi: 10.1016/j.gdata.2017.10.006. [DOI] [PMC free article] [PubMed] [Google Scholar]
- 8.White NM, Newsted DW, Masui O, Romaschin AD, Siu KW, Yousef GM. Identification and validation of dysregulated metabolic pathways in metastatic renal cell carcinoma. Tumour Biol. 2014;35:1833–46. doi: 10.1007/s13277-013-1245-6. [DOI] [PubMed] [Google Scholar]
- 9.Furge KA, Tan MH, Dykema K, Kort E, Stadler W, Yao X, Zhou M, Teh BT. Identification of deregulated oncogenic pathways in renal cell carcinoma: an integrated oncogenomic approach based on gene expression profiling. Oncogene. 2007;26:1346–50. doi: 10.1038/sj.onc.1210256. [DOI] [PubMed] [Google Scholar]
- 10.Langfelder P, Horvath S. WGCNA: an R package for weighted correlation network analysis. BMC Bioinformatics. 2008;9:559. doi: 10.1186/1471-2105-9-559. [DOI] [PMC free article] [PubMed] [Google Scholar]
- 11.Yuan L, Shu B, Chen L. et al. Overexpression of COL3A1 confers a poor prognosis in human bladder cancer identified by co-expression analysis. Oncotarget. 2017;8:70508–20. doi: 10.18632/oncotarget.19733. [DOI] [PMC free article] [PubMed] [Google Scholar]
- 12.Zhou Z, Liu S, Zhang M, Zhou R, Liu J, Chang Y, Zhao Q. Overexpression of Topoisomerase 2-Alpha Confers a Poor Prognosis in Pancreatic Adenocarcinoma Identified by Co-Expression Analysis. Dig Dis Sci. 2017;62(10):2790–2800. doi: 10.1007/s10620-017-4718-4. [DOI] [PubMed] [Google Scholar]
- 13.Wang F, Chang Y, Li J, Wang H, Zhou R, Qi J, Liu J, Zhao Q. Strong correlation between ASPM gene expression and HCV cirrhosis progression identified by co-expression analysis. Dig Liver Dis. 2017;49:70–6. doi: 10.1016/j.dld.2016.10.017. [DOI] [PubMed] [Google Scholar]
- 14.Clarke C, Madden SF, Doolan P. et al. Correlating transcriptional networks to breast cancer survival: a large-scale coexpression analysis. Carcinogenesis. 2013;34:2300–8. doi: 10.1093/carcin/bgt208. [DOI] [PubMed] [Google Scholar]
- 15.Dennis G Jr, Sherman BT, Hosack DA, Yang J, Gao W, Lane HC, Lempicki RA. DAVID: Database for Annotation, Visualization, and Integrated Discovery. Genome Biol. 2003;4:P3. [PubMed] [Google Scholar]
- 16.Szklarczyk D, Franceschini A, Wyder S. et al. STRING v10: protein-protein interaction networks, integrated over the tree of life. Nucleic Acids Res. 2015;43:D447–52. doi: 10.1093/nar/gku1003. [DOI] [PMC free article] [PubMed] [Google Scholar]
- 17.Shannon P, Markiel A, Ozier O, Baliga NS, Wang JT, Ramage D, Amin N, Schwikowski B, Ideker T. Cytoscape: a software environment for integrated models of biomolecular interaction networks. Genome Res. 2003;13:2498–504. doi: 10.1101/gr.1239303. [DOI] [PMC free article] [PubMed] [Google Scholar]
- 18.Bader GD, Hogue CW. An automated method for finding molecular complexes in large protein interaction networks. BMC Bioinformatics. 2003;4:2. doi: 10.1186/1471-2105-4-2. [DOI] [PMC free article] [PubMed] [Google Scholar]
- 19.Mason MJ, Fan G, Plath K, Zhou Q, Horvath S. Signed weighted gene co-expression network analysis of transcriptional regulation in murine embryonic stem cells. BMC Genomics. 2009;10:327. doi: 10.1186/1471-2164-10-327. [DOI] [PMC free article] [PubMed] [Google Scholar]
- 20.Horvath S, Dong J. Geometric interpretation of gene coexpression network analysis. PLoS Comput Biol. 2008;4:e1000117. doi: 10.1371/journal.pcbi.1000117. [DOI] [PMC free article] [PubMed] [Google Scholar]
- 21.Tang Z, Li C, Kang B, Gao G, Li C, Zhang Z. GEPIA: a web server for cancer and normal gene expression profiling and interactive analyses. Nucleic Acids Res; 2017. doi: 10.1093/nar/gkx247. [Epub ahead of print] [DOI] [PMC free article] [PubMed] [Google Scholar]
- 22.Giraldo NA, Becht E, Pages F. et al. Orchestration and Prognostic Significance of Immune Checkpoints in the Microenvironment of Primary and Metastatic Renal Cell Cancer. Clin Cancer Res. 2015;21:3031–40. doi: 10.1158/1078-0432.CCR-14-2926. [DOI] [PubMed] [Google Scholar]
- 23.Balan M, Mier y Teran E, Waaga-Gasser AM, Gasser M, Choueiri TK, Freeman G, Pal S. Novel roles of c-Met in the survival of renal cancer cells through the regulation of HO-1 and PD-L1 expression. J Biol Chem. 2015;290:8110–20. doi: 10.1074/jbc.M114.612689. [DOI] [PMC free article] [PubMed] [Google Scholar]
- 24.Sprowl JA, Lancaster CS, Pabla N. et al. Cisplatin-induced renal injury is independently mediated by OCT2 and p53. Clin Cancer Res. 2014;20:4026–35. doi: 10.1158/1078-0432.CCR-14-0319. [DOI] [PMC free article] [PubMed] [Google Scholar]
- 25.Pochini L, Scalise M, Galluccio M, Indiveri C. OCTN cation transporters in health and disease: role as drug targets and assay development. J Biomol Screen. 2013;18:851–67. doi: 10.1177/1087057113493006. [DOI] [PubMed] [Google Scholar]
- 26.Yang M, Soga T, Pollard PJ. Oncometabolites: linking altered metabolism with cancer. J Clin Invest. 2013;123:3652–8. doi: 10.1172/JCI67228. [DOI] [PMC free article] [PubMed] [Google Scholar]
- 27.Hirschey MD, DeBerardinis RJ, Diehl AM. et al. Dysregulated metabolism contributes to oncogenesis. Semin Cancer Biol. 2015;35(Suppl):S129–50. doi: 10.1016/j.semcancer.2015.10.002. [DOI] [PMC free article] [PubMed] [Google Scholar]
- 28.Robertson-Tessi M, Gillies RJ, Gatenby RA, Anderson AR. Impact of metabolic heterogeneity on tumor growth, invasion, and treatment outcomes. Cancer Res. 2015;75:1567–79. doi: 10.1158/0008-5472.CAN-14-1428. [DOI] [PMC free article] [PubMed] [Google Scholar]
- 29.Sudarshan S, Karam JA, Brugarolas J. et al. Metabolism of kidney cancer: from the lab to clinical practice. Eur Urol. 2013;63:244–51. doi: 10.1016/j.eururo.2012.09.054. [DOI] [PMC free article] [PubMed] [Google Scholar]
- 30.Yang F, Zhang H, Mei Y, Wu M. Reciprocal regulation of HIF-1alpha and lincRNA-p21 modulates the Warburg effect. Mol Cell. 2014;53:88–100. doi: 10.1016/j.molcel.2013.11.004. [DOI] [PubMed] [Google Scholar]
- 31.Guo Y, Meng X, Ma J, Zheng Y, Wang Q, Wang Y, Shang H. Human papillomavirus 16 E6 contributes HIF-1alpha induced Warburg effect by attenuating the VHL-HIF-1alpha interaction. Int J Mol Sci. 2014;15:7974–86. doi: 10.3390/ijms15057974. [DOI] [PMC free article] [PubMed] [Google Scholar]
- 32.Malec V, Coulson JM, Urbe S, Clague MJ. Combined Analyses of the VHL and Hypoxia Signaling Axes in an Isogenic Pairing of Renal Clear Cell Carcinoma Cells. J Proteome Res. 2015;14:5263–72. doi: 10.1021/acs.jproteome.5b00692. [DOI] [PubMed] [Google Scholar]
- 33.Hervouet E, Cizkova A, Demont J. et al. HIF and reactive oxygen species regulate oxidative phosphorylation in cancer. Carcinogenesis. 2008;29:1528–37. doi: 10.1093/carcin/bgn125. [DOI] [PubMed] [Google Scholar]
- 34.Hervouet E, Demont J, Pecina P, Vojtiskova A, Houstek J, Simonnet H, Godinot C. A new role for the von Hippel-Lindau tumor suppressor protein: stimulation of mitochondrial oxidative phosphorylation complex biogenesis. Carcinogenesis. 2005;26:531–9. doi: 10.1093/carcin/bgi001. [DOI] [PubMed] [Google Scholar]
- 35.Mikhaylova O, Ignacak ML, Barankiewicz TJ. et al. The von Hippel-Lindau tumor suppressor protein and Egl-9-Type proline hydroxylases regulate the large subunit of RNA polymerase II in response to oxidative stress. Mol Cell Biol. 2008;28:2701–17. doi: 10.1128/MCB.01231-07. [DOI] [PMC free article] [PubMed] [Google Scholar]
- 36.Hongo F, Takaha N, Oishi M. et al. CDK1 and CDK2 activity is a strong predictor of renal cell carcinoma recurrence. Urol Oncol. 2014;32:1240–6. doi: 10.1016/j.urolonc.2014.05.006. [DOI] [PubMed] [Google Scholar]
- 37.Xi Q, Huang M, Wang Y. et al. The expression of CDK1 is associated with proliferation and can be a prognostic factor in epithelial ovarian cancer. Tumour Biol. 2015;36:4939–48. doi: 10.1007/s13277-015-3141-8. [DOI] [PubMed] [Google Scholar]
- 38.Kang X, Song C, Du X. et al. PTEN stabilizes TOP2A and regulates the DNA decatenation. Sci Rep. 2015;5:17873. doi: 10.1038/srep17873. [DOI] [PMC free article] [PubMed] [Google Scholar]
- 39.Qu A, Jiang C, Cai Y, Kim JH, Tanaka N, Ward JM, Shah YM, Gonzalez FJ. Role of Myc in hepatocellular proliferation and hepatocarcinogenesis. J Hepatol. 2014;60:331–8. doi: 10.1016/j.jhep.2013.09.024. [DOI] [PMC free article] [PubMed] [Google Scholar]
- 40.Shroff EH, Eberlin LS, Dang VM. et al. MYC oncogene overexpression drives renal cell carcinoma in a mouse model through glutamine metabolism. Proc Natl Acad Sci U S A. 2015;112:6539–44. doi: 10.1073/pnas.1507228112. [DOI] [PMC free article] [PubMed] [Google Scholar]
- 41.Stenman M, Laurell A, Lindskog M. Prognostic significance of serum albumin in patients with metastatic renal cell carcinoma. Med Oncol. 2014;31:841. doi: 10.1007/s12032-014-0841-7. [DOI] [PubMed] [Google Scholar]
- 42.Ma X, Shen D, Li H. et al. MicroRNA-185 inhibits cell proliferation and induces cell apoptosis by targeting VEGFA directly in von Hippel-Lindau-inactivated clear cell renal cell carcinoma. Urol Oncol. 2015;33:169. doi: 10.1016/j.urolonc.2015.01.003. e1-11. [DOI] [PubMed] [Google Scholar]
- 43.Song W, Yeh CR, He D, Wang Y, Xie H, Pang ST, Chang LS, Li L, Yeh S. Infiltrating neutrophils promote renal cell carcinoma progression via VEGFa/HIF2alpha and estrogen receptor beta signals. Oncotarget. 2015;6:19290–304. doi: 10.18632/oncotarget.4478. [DOI] [PMC free article] [PubMed] [Google Scholar]
- 44.Cheng X, Yang Y, Fan Z. et al. MKL1 potentiates lung cancer cell migration and invasion by epigenetically activating MMP9 transcription. Oncogene. 2015;34:5570–81. doi: 10.1038/onc.2015.14. [DOI] [PubMed] [Google Scholar]
- 45.Lin H, Pan JC, Zhang FM. et al. Matrix metalloproteinase-9 is required for vasculogenic mimicry by clear cell renal carcinoma cells. Urol Oncol. 2015;33:168. doi: 10.1016/j.urolonc.2014.12.007. e9-16. [DOI] [PubMed] [Google Scholar]
- 46.Baldwin RM, Haghandish N, Daneshmand M, Amin S, Paris G, Falls TJ, Bell JC, Islam S, Cote J. Protein arginine methyltransferase 7 promotes breast cancer cell invasion through the induction of MMP9 expression. Oncotarget. 2015;6:3013–32. doi: 10.18632/oncotarget.3072. [DOI] [PMC free article] [PubMed] [Google Scholar]
- 47.Minarik I, Lastovicka J, Budinsky V, Kayserova J, Spisek R, Jarolim L, Fialova A, Babjuk M, Bartunkova J. Regulatory T cells, dendritic cells and neutrophils in patients with renal cell carcinoma. Immunol Lett. 2013;152:144–50. doi: 10.1016/j.imlet.2013.05.010. [DOI] [PubMed] [Google Scholar]
- 48.Singh N, Promkan M, Liu G, Varani J, Chakrabarty S. Role of calcium sensing receptor (CaSR) in tumorigenesis. Best Pract Res Clin Endocrinol Metab. 2013;27:455–63. doi: 10.1016/j.beem.2013.04.001. [DOI] [PubMed] [Google Scholar]
- 49.Matusan-Ilijas K, Damante G, Fabbro D. et al. EGFR expression is linked to osteopontin and Nf-kappaB signaling in clear cell renal cell carcinoma. Clin Transl Oncol. 2013;15:65–71. doi: 10.1007/s12094-012-0889-9. [DOI] [PubMed] [Google Scholar]
- 50.Cossu-Rocca P, Muroni MR, Sanges F. et al. EGFR kinase-dependent and kinase-independent roles in clear cell renal cell carcinoma. Am J Cancer Res. 2016;6:71–83. [PMC free article] [PubMed] [Google Scholar]
- 51.Mirza Z, Schulten HJ, Farsi HM, Al-Maghrabi JA, Gari MA, Chaudhary AG, Abuzenadah AM, Al-Qahtani MH, Karim S. Molecular interaction of a kinase inhibitor midostaurin with anticancer drug targets, S100A8 and EGFR: transcriptional profiling and molecular docking study for kidney cancer therapeutics. PLoS One. 2015;10:e0119765. doi: 10.1371/journal.pone.0119765. [DOI] [PMC free article] [PubMed] [Google Scholar]
- 52.Ke HL, Tu HP, Lin HH. et al. Cyclooxygenase-2 (COX-2) up-regulation is a prognostic marker for poor clinical outcome of upper tract urothelial cancer. Anticancer Res. 2012;32:4111–6. [PubMed] [Google Scholar]
- 53.Li B, Qiu B, Lee DS. et al. Fructose-1,6-bisphosphatase opposes renal carcinoma progression. Nature. 2014;513:251–5. doi: 10.1038/nature13557. [DOI] [PMC free article] [PubMed] [Google Scholar]
- 54.Suhre K, Shin SY, Petersen AK. et al. Human metabolic individuality in biomedical and pharmaceutical research. Nature. 2011;477:54–60. doi: 10.1038/nature10354. [DOI] [PMC free article] [PubMed] [Google Scholar]
Associated Data
This section collects any data citations, data availability statements, or supplementary materials included in this article.
Supplementary Materials
Supplementary figures and tables.


