Abstract
Ultrasound shear wave elastography (SWE) is emerging as a promising imaging modality for noninvasive evaluation of tissue mechanical properties. One of the ways to explore the viscoelasticity is through analyzing the shear wave velocity dispersion curves. To explore the dispersion, it is necessary to estimate the shear wave velocity at each frequency. An increase of the available spectrum to be used for phase velocity estimation is significant for tissue dispersion analysis in vivo. A number of available methods suffer because of the available spectrum that one can work with is limited. We present an alternative method to the classical two-dimensional Fourier transform (2D-FT), that uses the Multiple Signal Classification (MUSIC) technique to provide robust estimation of the k-space and phase velocity dispersion curves. We compared results from the MUSIC method with the 2D-FT technique twofold: by searching for maximum peaks and gradient-based strategy. We tested this method on digital phantom data created using finite element models (FEMs) in viscoelastic media as well as on the experimental phantoms used in the Radiological Society of North America (RSNA) Quantitative Imaging Biomarker Alliance (QIBA) effort for standardization of shear wave velocity in liver fibrosis applications. Additionally, we evaluated the algorithm with different levels of added noise for FEMs. The MUSIC algorithm provided dispersion curves estimation with lower errors than the conventional 2D-FT method. The MUSIC method can be used for robust evaluation of shear wave velocity dispersion curves in viscoelastic media.
Index Terms: Shear wave elastography (SWE), ultrasound, MUSIC, velocity dispersion curves, soft tissue
I. Introduction
Shear wave elastography (SWE) is a method that is used to make noninvasive, quantitative measurements of various mechanical properties. In this technique, focused ultrasound beams are used to “push” in the tissue which generates a propagating shear wave by acoustic radiation force excitation [1], [2]. The velocity of the waves changes as a result of variation of the mechanical properties of the tissue. In most SWE applications, the medium is assumed to be elastic, homogeneous, isotropic, linear, and infinite. For this type of medium, time-of-flight methods are typically used to estimate the shear wave velocity [3].
For a viscoelastic medium, the wave velocity varies with frequency, a phenomenon called dispersion [4]. Multiple SWE methods have taken advantage of this phenomenon by measuring the shear wave phase velocity at different frequencies to evaluate the viscoelasticity of a medium [4]–[8]. In addition to viscoelasticity, geometry of a medium can also cause dispersion. Waves propagating in materials that are thin, with respect to the wavelength of the wave, can undergo multiple reflections resulting in complex wave behavior with multiple modes and variation of phase velocity with frequency [9], [10]. There are also situations where tissues have finite thicknesses and are viscoelastic such as arteries, myocardium, bladder wall, and tendons, so dispersion is present both from viscoelasticity and geometry [11]–[16].
Chen, et al., originally proposed measuring the dispersion of shear waves in tissue-mimicking materials to characterize the viscoelastic mechanical properties [4]. This seminal work used a phase gradient to calculate the phase velocity. The phase gradient at a frequency, f, is calculated using a formula
| (1) |
where ω = 2πf, Δx = x2 − x1, and Δϕ = ϕ2 − ϕ1. The shear wave phases, ϕ2 and ϕ1, measured at frequency, f, are measured at two locations x1 and x2, respectively. The phase can be calculated by taking a Fourier transform of the motion at a given location and extracting the phase of that signal at the frequency of interest. This operation can be repeated for all locations in the data set. Commonly, this phase gradient is measured at several locations and the slope of the line m = Δx/Δϕ measured using linear regression or curve fitting [5], [6] is used in Eq. (1) for calculation of the phase velocity.
In most current applications, the shear wave propagation is measured at multiple lateral locations using ultrafast imaging techniques either using plane wave compounding [17] or by using multiple acquisitions with focused beams [18]. In many cases, the particle velocity, v, is used for data processing, but displacement or acceleration could also be used. The two-dimensional Fourier transform (2D-FT) of this spatiotemporal particle motion, v(x, t), to create the “k-space” represented by V (k, f), where k is the wavenumber and f is the temporal frequency [19], [20].
For a harmonic wave of frequency f0
| (2) |
where v0 is the initial particle velocity, ω0 = 2πf0, and k0 = ω0/c0 +iα0. The analytic expression for the 2D-FT is given by
| (3) |
and when applied to (2) results in
| (4) |
In the Fourier-domain, there is a peak located at (2πf0/c0, f0). For an impulsive input similar to the acoustic radiation force used in many SWE applications, the k-space will have a distribution of energy covering a bandwidth that is related to the push beam geometry and the mechanical properties of the medium [21]. As in the harmonic case, the peaks of the k-space distribution for an impulsive acoustic radiation force push represented the phase velocities of different wave propagation modes. These peaks can be found by searching orthogonal directions, either along the f or k directions as described by Bernal, et al. [20]. Typically, a threshold is applied to the k-space before the search to avoid spurious peaks [20]. The coordinates of the peaks are used to calculate the phase velocity cs(f) = 2πf/k = fλ.
Another way to search the k-space that has been proposed is a Radon sum method which uses the k-space and finds the curved trajectory defined by a linear dispersion function that maximizes the summed magnitude [22]. Any dispersion function could be defined for this method, but the parameters that provide the maximized sum are reported for characterization of the medium under investigation.
A different method used for dispersion curves evaluation is based on the Multiple Signal Classification (MUSIC) technique, originally developed in [23]. The method is similar to the classical 2D-FT. In contrast to the 2D-FT method, it replaces the spatial Fourier transform with the MUSIC method. Likewise, this method allows for the dispersion curves estimation in a frequency-wavenumber representation. The method has been used previously in the structural health monitoring/non-destructive testing field for material elastic constants identifications in non-damping mechanical materials [24]. In the paper by Ambrozinski, et al., the MUSIC method was adopted in order to estimate symmetric and anti-symmetric fundamental modes of Lamb waves, in a frequency range up to 1 MHz.
For accurate and robust characterization of viscoelastic media, algorithms to reliably extract the phase velocity dispersion are necessary. Phase gradient and 2D-FT methods can at times be prone to failure in the face of experimental noise. Therefore, methods that provide stable dispersion curve estimates are needed.
The rest of the article is organized as follows. First, we present the MUSIC method as applied for dispersion curve estimation. The MUSIC method is introduced as an alternative to the 2D-FT to compute the k-space representation. We also introduce an alternative for finding the peaks in the k-space representation compared to a one-dimensional search or the Radon search method. This new method is an image processing approach that utilizes a gradient operation to find the peaks in the k-space. Lastly, we also implemented a polynomial fitting of the detected peaks to reduce variation in the estimate of the wave velocity dispersion curves. This method was tested on data from finite element modeling simulations of shear wave propagation. The robustness of the method was tested by adding noise to these data sets. We also tested the method on data from viscoelastic elastography phantoms. Results from these digital and physical phantoms will be presented. The k-space spectra will be presented in a normalized decibel scale. All references to peaks mean the maxima in the frequency domain representation (k-space). It is assumed the shear waves are observed over one half of the x-axis as described in [25]. The results will be followed with a discussion and conclusions.
II. Methods
In this section the MUSIC method is adopted for dispersion curves estimation from data produced from digital phantoms based on Finite Element Methods (FEM) viscoelastic models, and experimentally from viscoelastic tissue-mimicking phantoms. The whole procedure is described below in Sec. II-C. Appropriate examples are provided in order to show its efficiency and robustness in Sec. III. Earlier, however, descriptions of the numerical FEM viscoelastic and experimental phantoms used in the Radiological Society of North America (RSNA) Quantitative Imaging Biomarker Alliance (QIBA) effort for standardization of shear wave velocity in liver fibrosis applications are introduced in Secs. II-A and II-B, respectively.
A. Numerical FEM Viscoelastic Phantoms Description
To produce digital phantoms of viscoelastic materials, for which the mechanical properties are known, we used finite element modeling. Finite element modeling for SWE applications has been used by multiple groups [22], [25]–[32]. Recently, guidelines for performing these types of simulations for tissue-mimicking materials were reported [33]. For these FEMs we used Abaqus (6.12-1, Dassault Systems, Waltham, MA). The acoustic radiation force push beam was simulated using Field II [34], [35]. The array that was simulated was a curved linear array with a radius of curvature of 60 mm, element height of 14 mm, element pitch of 0.477 mm, elevation focus of 50 mm, center frequency of 3.0 MHz, and using a medium attenuation, α, of 0.45 dB/cm/MHz and sound speed, c, of 1540 m/s. The pressure was calculated and the intensity, I, was calculated by squaring the pressure to be used in the body force defined by F = 2αI/c [36]. Focal depths of 30, 50, and 70 mm were used for the push beams with a fixed F-number (F/N) of 2.
The viscoelastic domains were uniformly spatially sampled at 0.167 mm. The dimensions of the simulated domain are x = ±25 mm in the azimuthal dimension, y = ±10 mm in the elevation direction, and z = 0–100 mm in the axial dimension. Simulations were performed with quarter-symmetry so the domain described by x = 0–25 mm, y = 0–10 mm, and z = 0–100 mm was used for the calculations of motion. The viscoelasticity was modeled using the Generalized Maxwell model as defined by Nightingale, et al. [22], [31], [37]. The relaxation shear modulus, Gr, of this model is
| (5) |
where G∞ is the long-term modulus, G1 is the spring elasticity, and β is the decay constant of the relaxation modulus. The instantaneous shear modulus is
| (6) |
The decay constant is
| (7) |
where η is the damper viscosity. The phase velocity dispersion relation for this model is given as follows
| (8) |
where
| (9) |
Three different viscoelastic media with material properties tabulated in Table I are studied in this work.
TABLE I.
Numerical FEM viscoelastic phantom parameters
| G0 [kPa] | G∞ [kPa] | β [1/s] | |
|---|---|---|---|
|
| |||
| Phantom 1 | 10 | 2 | 6667 |
| Phantom 2 | 15 | 4 | 5500 |
| Phantom 3 | 20 | 4 | 4000 |
Numerical FEM shear wave responses for digital phantoms of viscoelastic materials are studied twofold. Examples of a “clean” (without any additional noise) as well as in the presence of a noise - as added white Gaussian noise - wave motions are examined. The white Gaussian noise was generated in MATLAB software and then manually added into shear wave time-domain particle velocity signals. The power of the wave motion was measured. Subsequently, white Gaussian noise was added to the time-domain vector signal. Here, a signal-to-noise ratio (SNR) for the noise-added models was set to vary between 5–25 dB.
B. QIBA Phantoms Description
Three viscoelastic, oil-water emulsion phantoms (CIRS, Inc., Norfolk, VA) were used in a multi-center study conducted by the Radiological Society of North America Quantitative Imaging Biomarkers Alliance (RSNA QIBA) committee for standardizing shear wave speed measurement for the purposes of determining stage of liver fibrosis [38]–[40]. These phantoms were designed such that each one represented a different stage of liver fibrosis [40]. They are denoted phantoms A, B, and C for this paper. Shear wave acquisitions were performed with a Verasonics system (Vantage, Verasonics, Inc., Kirkland, WA) and a curved linear array transducer (C5-2v, Verasonics, Inc., Kirkland, WA). Data were taken with different focal depths to explore biases related to acquisition depth. Acoustic radiation force push beams were focused at 30, 45, and 70 mm with an F-number of 2.2. The push duration was 800 μs and the push frequency was 2.0 MHz. A wide beam acquisition was used using 3 beams that were coherently compounded [17]. The effective frame rate after compounding was 1.8315 kHz. The motion (shear wave particle velocity) was calculated from the in-phase/quadrature data using an autocorrelation algorithm [41].
C. The Multiple Signal Classification Method Used for the k-space Evaluation
The k-space dispersion curves of ultrasound shear waves can be processed using a methodology which adopts a one-dimensional time-domain Fourier transform and the MUSIC method. In summary, the steps of the procedure used for an experimental k-space spectra estimation can be summarized as follow
Step 1: collect shear wave motions as a time-domain data for spatially evenly distributed sensors;
Step 2: conduct the one-dimensional time-domain Fourier transform for set of signals measured from all space positions;
Step 3: subject resulting vector data to the MUSIC approach, to find the wavenumber content (the k-space spectrum).
The MUSIC method is an improvement of the Pisarenko’s harmonic decomposition technique [42]. Similar to Pisarenko’s algorithm, the MUSIC technique is a frequency estimation procedure. It provides asymptotically unbiased estimates of a general set of signal parameters. The method relies on the orthogonality between signal and noise subspaces spanned by the eigenvectors of the correlation matrix to conclude signal propagation characteristics for multiple signal contributions.
The algorithm evaluates wavenumber spectra using an eigenspace analysis method. For each temporal frequency the M × M autocorrelation matrix (Rx) of the spectrum is calculated. M stands for a size of the Rx matrix and should be chosen lower than the length of the input vector data. Based on a truncated decomposition, the Rx matrix can be decomposed in terms of eigenvectors and eigenvalues as
| (10) |
in which, λi and v̄i are the ith eigenvalue and eigenvector of Rx. Equation (10), after grouping the eigenvectors into signal and noise subspaces, can be rewritten as
| (11) |
where, p is the number of eigenvectors related to the signal subspace. The largest p eigenvalues define a signal subspace.
Then, by arranging the eigenvalues of the autocorrelation matrix in the decreasing order, the corresponding eigenvectors (v̄1,···, v̄M) are separated into two groups: the p eigenvectors associated with the shear wave signal (an integer number of complex exponentials the signal consists, which must be known a priori) and the M − p eigenvectors associated with noise, respectively. The MUSIC algorithm is an approach using only the noise subspace with all eigenvectors weighted equally instead of by their corresponding eigenvalues, consequently
| (12) |
Ideally, as the method assumes, the eigenvectors of the Rx will have p roots that lie on the unit circle at the frequencies of the complex exponential. In the same time, the eigenspectrum associated with the noise eigenvector (which roots may lie anywhere) will exhibit sharp peaks.
Employing the noise subspace eigenvectors (M − p), the k-space with robust peaks that corresponds to the phase velocity of the major shear wave component can be calculated using the following estimation function [43]
| (13) |
where ēH is the vector of complex exponentials ejkωi. Superscript H denotes the Hermitian operator. The eigenvectors v̄i used in the summation correspond to the M − p smallest eigenvalues that span the noise subspace. Based on Eq. (13) the wavenumbers of the complex exponentials are taken as the locations of the p maximum peaks in P̂(ejk).
The above procedure has been implemented in MATLAB (Mathworks, Natick, MA) to show and evaluate the principle and its basic performance. We conducted tests using this new method with FEM numerical and QIBA experimental data and compared results with 2D-FT results. The results of these tests have demonstrated the potential of this approach for handling dispersion curves of shear waves (1–10 m/s) in medical applications.
In this paper we use three different methods to search the k-f space generated by the 2D-FT or MUSIC methods. The conventional 2D-FT method used a peak detection method by finding the values of k where there are local or global maxima at a given value of f. A different empirical image processing-based method for searching for peaks is based on computing a gradient of the k-space magnitude distribution and finding the associated zero-crossings that correspond to the peaks. This was partially motivated by the work of Bernal, et al., that performed a search for peaks in both directions in the k-f space [20].
For a two-dimensional function, f(x, y), the gradient is given as
| (14) |
If we consider a one-dimensional function with a peak at x = xp, then if we take the derivative, the derivative has a zero-crossing at x = xp. Detections of zero-crossings could be used instead of peaks in the magnitude distribution along a given search direction, either frequency, f, or wavenumber, k. When the 2D-FT is taken, typically zero-padding is used and so the resolution of the k-space can be variable. To calculate the gradient, a numerical gradient just as implemented in the gradient function in MATLAB which uses a central difference algorithm and can give different results depending on the resolution of the k-space. To avoid this issue, a Fourier-based derivative can be performed using
| (15) |
where Re{•} indicates taking the real component, kx is the Fourier-domain variable corresponding to x. This technique for taking the derivative is performed in both the temporal and spatial dimensions and the results are summed to compute the gradient of the k-space.
Phase velocities estimated based on the 2D-FT and MUSIC methods are calculated from the maximum peaks and the gradient techniques. Moreover, they are calculated for fitted wavenumber-frequency pairs for the gradient method only. In this approach a third-order polynomial curve fitting was adopted for the k-space peak or zero-crossing locations, for both, the MUSIC and 2D-FT techniques. Next, for the fitted wavenumber-frequency curves, phase velocities are calculated and compared with non-fitted results. This was employed because the calculation of the wave velocities, c = 2πf/k, involves a division of the values of the wavenumber coordinates which, if the data exhibit significant spread, the wave velocities could also have large variation. Applying a least-squares polynomial fitting can reduce that variation. Dispersion curve results were compared by calculating mean of the root-mean-square error (RMSE) between 40 iterations of the measured curves and the true curves for the FEM results based on the true curves calculated with the values in Table I. The RMSE can be calculated as follow
| (16) |
where, Ãi is a phase velocity vector of predictions made up of N scalar observations and Ai is the vector of observed values.
For the curve fitting a cubic polynomial was used. We have observed that in some cases the polynomial will sharply change when peaks are difficult to be identified. The choice of the cubic polynomial as the curve fitting model was arrived at by trial-and-error to make the curve smooth but adapt to the data adequately. However, the fitting of the wavenumbers using a polynomial provided more stability in both the 2D-FT and MUSIC results.
III. Results
A. The MUSIC method investigation
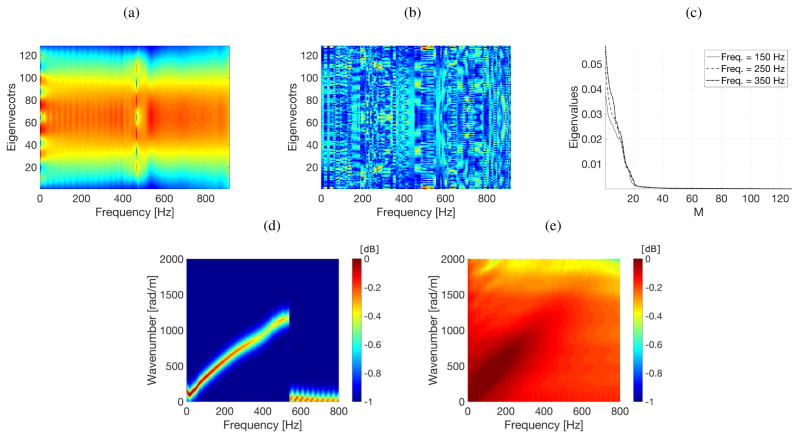
An example of the p signal (Fig. 1a) and M − p noise (Fig. 1b) eigenvectors, as well as eigenvalues (Fig. 1c) for various frequencies is presented in Fig. 1. An FFT length of 1024 with p = 1 and M = 128 values were used. The results were calculated for the experimental QIBA phantom type A measurements at a focal depth of 30 mm. Clear differences between the signal (a smooth pattern) and noise (a random pattern) eigenvectors are noticeable. Visible change of eigenvectors for the p signal subspace at a frequency of 530 Hz (Fig. 1a), called “stopping frequency”, exhibit end of Brillouin zone [44], [45] where group velocity of shear wave tends to zero. This reflects the end of a shear wave mode on the k-space spectrum presented in Fig. 1d for MUSIC and Fig. 1e for 2D-FT techniques. The k-space spectrum, for the MUSIC method, was calculated using Eq. (13) for which appropriate eigenvectors are presented in Figs. 1a and 1b.
Fig. 1.
Examples of selecting the p signal (a) and M−p noise (b) subspace eigenvectors, as well as eigenvalues (c), respectively, for the experimental QIBA phantom type A measurements at a focal depth of 30 mm. The corresponding k-space spectrum for the signal and noise eigenvectors calculated using (d) Eq. (13) and (e) magnitude of 2D-FT method, for spatial frequency is shown.
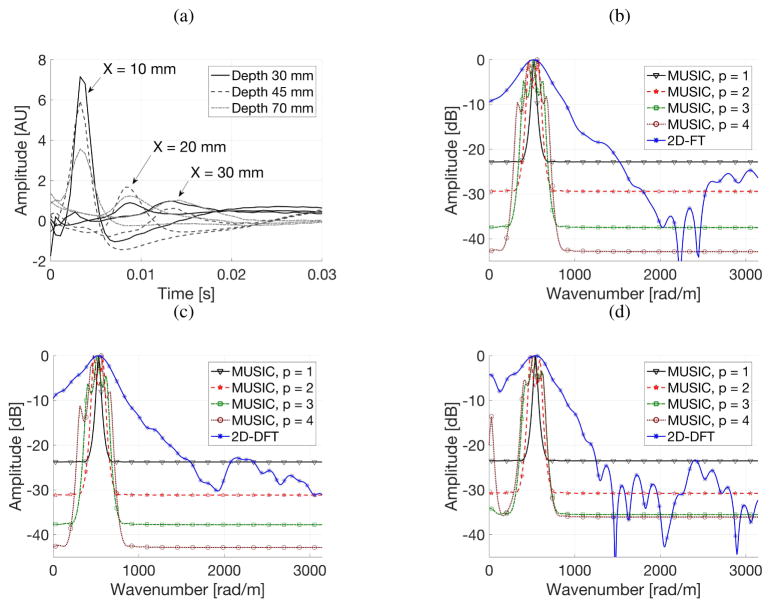
The MUSIC method consists of two tuning parameters that can influence responses. These are p and M values. Their influence on results are presented in Figs. 2 and 3. Figures 2b–2d present examples of the profiles of the k-space spectrum for the same QIBA phantom data type A. They were calculated using the classical 2D-FT and MUSIC approaches. The computations were done for an acoustic radiation force focused and shear waves measured at depths of 30, 45 and 70 mm (i.e. Fig. 2b, 2c and 2d), respectively. Presented data are selected for a single temporal frequency equal to 180 Hz, chosen from the whole frequency domain for which the MUSIC method was applied (see Fig. 1d). The FFT length as well as M value were constant at levels of 1024 and 128, respectively. In this case the p parameter was under the investigation and varied from 1 to 4. The approach applying the MUSIC method exhibits a sharp peak and a robust pseudospectrum estimate of the input shear wave velocity signals, presented in Fig. 2a. The signal peak estimated from MUSIC, for p = 1, is much narrower than that obtained using from the classical 2D-FT, and the background level is much smoother. Increasing p value causes widening of the signal peak as well as it appears to exhibit more variation. Results gathered from the 2D-FT approach have a wider peak profile as well as side lobes, which result in ambiguities in phase velocity estimation. The highest peaks in the wave forms in Figs. 2b–2d for data with different focal depths correspond to the propagating shear waves. The essential difference is the classical 2D-FT takes an FT on the raw shear wave signal along the spatial direction, while for the MUSIC based method the Fourier transform is calculated in time, and then the MUSIC algorithm is applied to the signal at specific frequencies which gives a better estimate of the shear wave wavenumber. This reveals the much improved resolution and sidelobe control achieved with the MUSIC technique. With one signal assumed here (p = 1), the peaks related to other signals, such as other vibration modes, are suppressed. By decreasing the noise subspace dimension (increasing the p value), besides the peak related to the dominant energy signal, other peaks with lower energy can be detected, as well. This is important especially in other applications where multiple modes are present.
Fig. 2.
Time-domain signals for a radiation force focused and shear waves measured at various focal depths (z) and x distances from the focused radiation force (a). A cross-section of the k-space spectra for QIBA phantom type A, for selected single frequency equal to 180 Hz, for a radiation force focused and shear waves measured at a depth of (b) 30 mm, (c) 45 mm and (d) 70 mm are presented. Data are shown for MUSIC method for various p parameter used in Eq. (13) and 2D-FT approach.
Fig. 3.
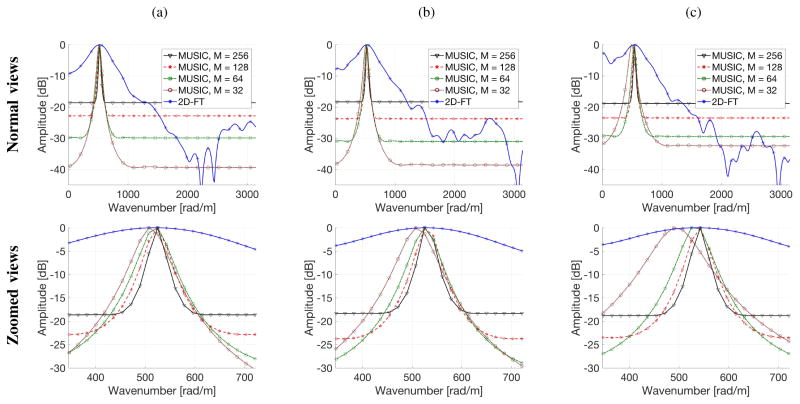
A cross-section of the k-space spectra for QIBA phantom type A, for selected single frequency equal to 180 Hz, for a radiation force focused and shear waves measured at a depth of (a) 30 mm, (b) 45 mm and (c) 70 mm are presented. Data are shown for MUSIC method for various M parameter used in Eq. (13) and 2D-FT approach. First row present normal view, whereas second one - zoomed views of main energy peaks.
Figure 3 presents the influence of M value used in the MUSIC algorithm. The first row presents normal views of the profiles of the k-space spectrum for the QIBA phantom data type A, as in previous case. The second row, shows their zoomed views. Again, the FFT length was set to be 1024 and p = 1. The value of M was varied and equal to 32, 64, 128 and 256, respectively. By using various sizes of the correlation matrix width of the main peak changes slightly. Moreover, for M = 32 the position of the maximum value slides in wavenumber domain. When M = 64 or above is used maximum value of the peak does not move in the wavenumber direction. The size of the correlation matrix also has influence on a level of suppressed, constant energy visible in the rest of the wavenumber domain. For all depths investigated the suppressed energy is at a constant level magnitude, i.e. approximately −18 dB, for M chosen to be equal to 256. Considering M = 32 the energy at a level of approximately −38 dB for depths of 30 and 45 mm, and −32 dB for 70 mm depth are present.
Based on above investigations FFT length of 1024, p = 1 and M = 128 were selected in further numerical FEM viscoelastic and experimental QIBA phantom studies.
B. Numerical FEM viscoelastic phantom results
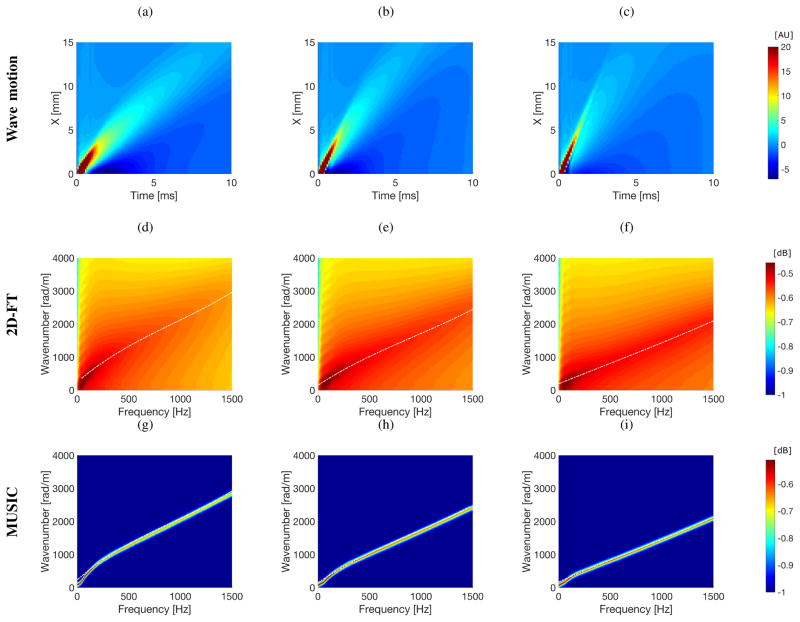
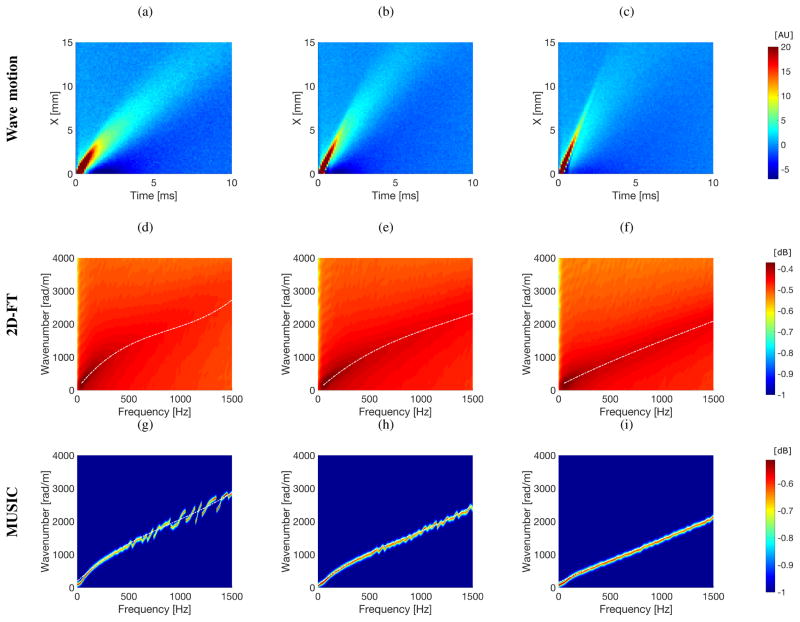
Numerical FEM viscoelastic phantom results were investigated for an acoustic radiation force focused at a depth of 50 mm. A push force was delivered for a time duration of 334 μs with a value of F/N = 2. An examination was performed for a clean data (without added noise) - shown in Figs. 4 and 6a–6c - and with added white Gaussian noise - shown in Figs. 5 and 6d–6f. Figures 4 and 5 show the results of the dispersion estimation (the k-space) methods based on the 2D-FT and MUSIC approaches. The results are shown for three different viscoelastic media tabulated in Table I. Moreover, Figs. 4 and 5 (top rows) depict the spatiotemporal particle velocity, for all three media on a linear scale.
Fig. 4.
The top row presents spatiotemporal shear wave propagation using the particle velocity signal. Magnitude of the k-space spectra calculated using 2D-FT (middle row) and MUSIC (bottom row) methods. Results were calculated for the numerical FEM viscoelastic phantoms without added noise, with assumed material properties: (a), (d), (g) G0 = 10 kPa, G∞ = 2 kPa, β = 6667 1/s (Phantom 1); (b), (e), (h) G0 = 15 kPa, G∞ = 4 kPa, β = 5500 1/s (Phantom 2); (c), (f), (i) G0 = 20 kPa, G∞ = 4 kPa, β = 4000 1/s (Phantom 3). Dash-dotted lines correspond to the polynomial fitting results.
Fig. 6.
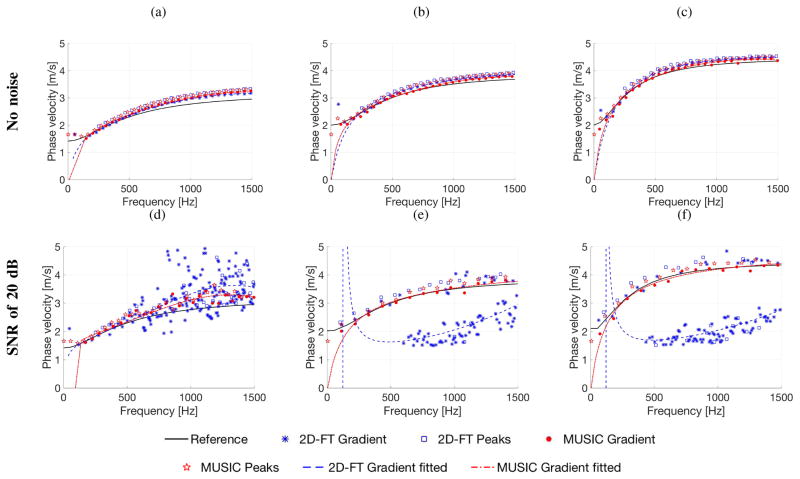
Comparison of phase velocities calculated based on various approaches. Results were estimated for the numerical FEM viscoelastic phantoms without (top row) and with (bottom row) manually added white Gaussian noise, with assumed material properties of: (a), (d) G0 = 10 kPa, G∞ = 2 kPa, β = 6667 1/s (Phantom 1); (b), (e) G0 = 15 kPa, G∞ = 4 kPa, β = 5500 1/s (Phantom 2); (c), (f) G0 = 20 kPa, G∞ = 4 kPa, β = 4000 1/s (Phantom 3).
Fig. 5.
The top row presents spatiotemporal shear wave propagation using the particle velocity signal. Magnitude of the k-space spectra calculated using 2D-FT (middle row) and MUSIC (bottom row) methods. Results were calculated for the numerical FEM viscoelastic phantoms with an SNR of 20 dB, with assumed material properties: (a), (d), (g) G0 = 10 kPa, G∞ = 2 kPa, β = 6667 1/s (Phantom 1); (b), (e), (h) G0 = 15 kPa, G∞ = 4 kPa, β = 5500 1/s (Phantom 2); (c), (f), (i) G0 = 20 kPa, G∞ = 4 kPa, β = 4000 1/s (Phantom 3). Dash-dotted lines correspond to the polynomial fitting results.
Comparing the dispersion curves (wavenumber-frequency pairs) evaluated based on the 2D-FT and MUSIC methods clear differences can be distinguished. For the MUSIC technique (bottom row in Figs. 4 and 5) sharp contours corresponding to the wavenumber-frequency pairs in the pseudospectrum are observed. For this approach, when no noise exists, the polynomial fitted curve is not needed in order to distinguish maximum wavenumbers for higher frequencies. However, this is not possible for the classical 2D-FT approach. Here, maximum wavenumber values for higher frequencies cannot be resolved easily.
The problem becomes more vexing when noisy data were analyzed. As shown in Fig. 5, for the classical 2D-FT method even the polynomial fitted curve does not give good results, especially for Phantom 1 at high frequencies (900–1500 Hz) (Fig. 5d). Wavy fitted curves can be seen in comparison to the clean data presented in Fig. 4. The MUSIC method deals with this problem much better. Again, robust values of wavenumbers for selected frequency range are visible. Besides, these patterns are not so smooth as for the clean data, still by adopting curve fitting appropriate wavenumbers can be estimated. This is more visible on the phase velocity results presented in Fig. 6 and quantified in the mean RMSE results in Fig. 7.
Fig. 7.
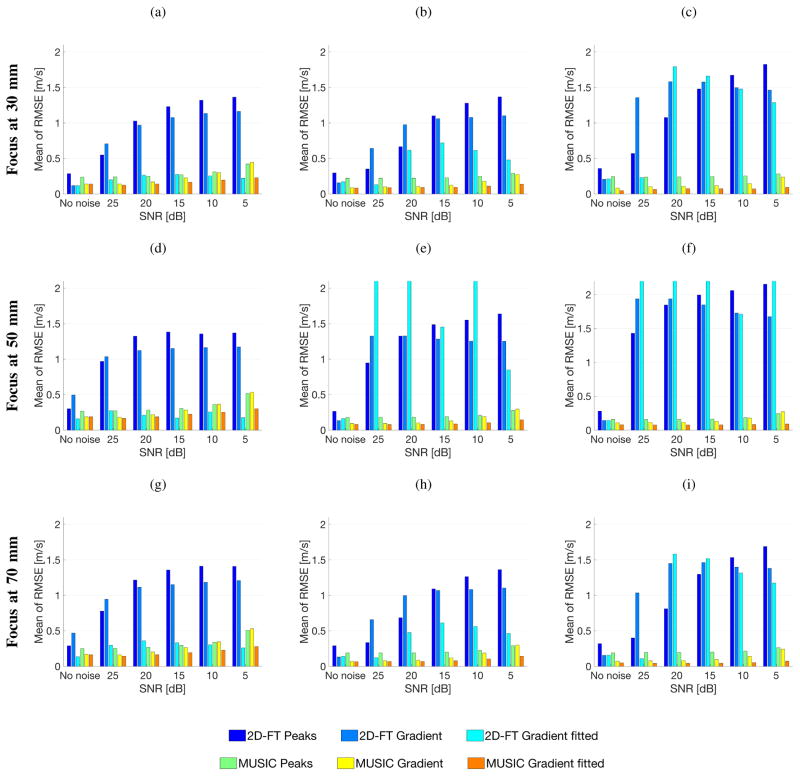
Mean of the RMSE calculated in a frequency range from 100 to 1400 Hz at a radiation force focused, at depth of 30 mm (top row), 50 mm (middle row) and 70 mm (bottom row) for the numerical FEM data with assumed material properties of: (a), (d), (g) G0 = 10 kPa, G∞ = 2 kPa, β = 6667 1/s (Phantom 1), (b), (e), (h) G0 = 15 kPa, G∞ = 4 kPa, β = 5500 1/s (Phantom 2), and (c), (f), (i) G0 = 20 kPa, G∞ = 4 kPa, β = 4000 1/s (Phantom 3).
Figure 6 shows the phase velocity dispersion results from the 2D-FT and the MUSIC methods for the clean (without added noise) and noisy (SNR = 20 dB) data. Phase velocities were calculated using the classical formula, c = 2πf/k, based on the k-space spectra presented in Figs. 4 and 5. It was done in various ways, i.e.: finding maximum peaks. Here the threshold value was set to be constant at a level of 0.05 for clean and noisy data. All these results are compared to the true values. Results presented in Fig. 6 are to show differences pictorially and appreciate the deviation from the reference values. More detailed analysis is given in Sec. III-C.
C. The Root-Mean-Square Error Analysis for Numerical FEM Viscoelastic Phantom Models
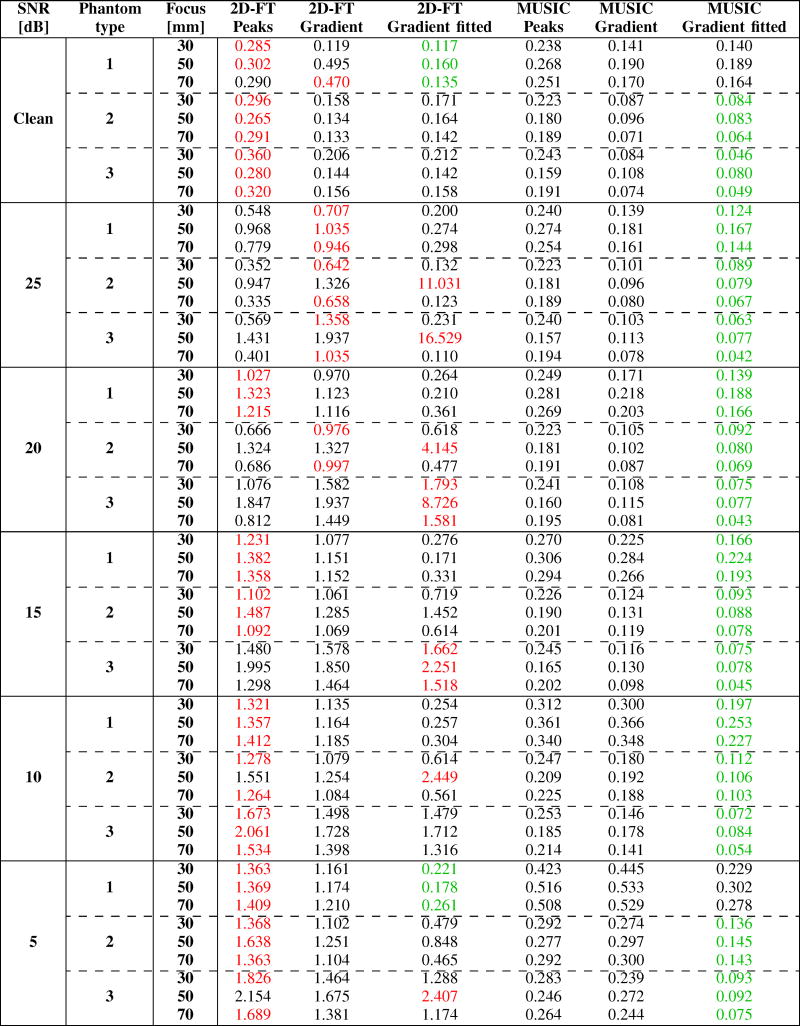
The mean RMSE for the numerical FEM data are investigated in this section and presented graphically in Fig. 7 and numerically in Table V in Appendix. The RMSE values were calculated for 40 iterations in a frequency range from 100 to 1400 Hz. They were investigated for various levels of SNR, i.e. 5, 10, 15, 20 and 25 dB. A threshold applied to the k-space before the search to avoid spurious peaks was set to be constant for all investigated cases at a level of 0.05. Moreover, a cut-off window for phase velocity calculations was provided in order to limit extremely scattered values. Its limits were equal to 1–7 m/s. These limits were informed by what values may be expected in examination of liver tissue [46].
The numerical FEM viscoelastic phantoms with material properties tabulated in Table I were examined. Three different focal depths were analyzed, i.e. 30, 50 and 70 mm.
For clean data the largest RMSE of phase velocity exists for the 2D-FT peaks method for all phantoms and depths investigated except Phantom 1 and focus depth of 70 mm where 2D-FT gradient technique exhibits larger RMSE. At the same time the smallest RMSE values appear for the 2D-FT gradient fitted approach for Phantom 1 only. The MUSIC gradient fitted technique deals better with two other phantoms, i.e. 2 and 3. For noiseless data, Phantom 3 with focus depth of 30 mm exhibits the largest RMSE value at a level of 0.36 m/s whereas, the smallest one was recorded for the MUSIC gradient fitted approach at a level of 0.046 m/s, as can be seen in Table V.
When noisy data are analyzed the 2D-FT method provides larger errors in comparison to the MUSIC procedure. Only for SNR = 5 dB the smallest RMSE values appear for Phantom 1 for the 2D-FT gradient fitted approach instead of the MUSIC one (Table V). Here the smallest RMSE values are: 0.221, 0.178 and 0.261 m/s at focal depths of 30, 45 and 70 mm, respectively). For other noisy cases 2D-FT peaks, gradient and gradient fitted approaches exhibit the largest RMSE values. The lowest value belongs to the MUSIC gradient fitted method as can be seen in Fig. 7 and Table V. Here, the MUSIC method shows its efficiency and great potential for analyzing of shear wave when noisy data are processed, which is often the case in vivo.
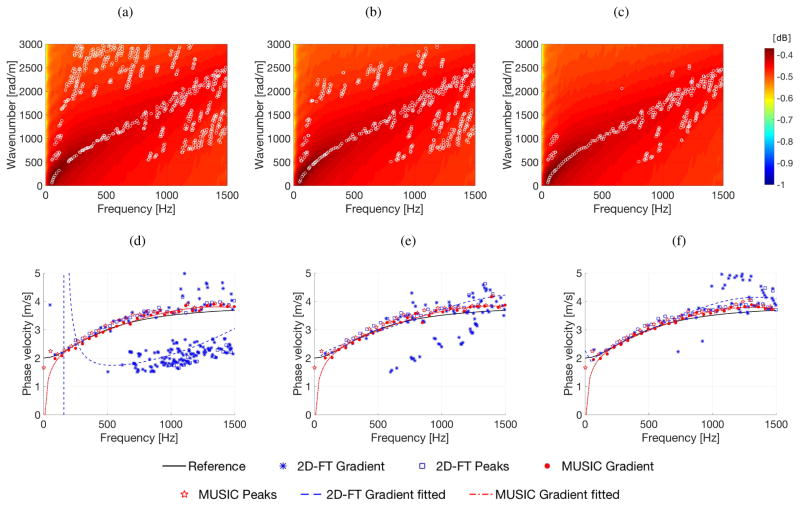
Figure 8 presents examples of how the selection of the threshold value for evaluating the k-space magnitude affects final phase velocity results. Here, the cut-off window for phase velocity calculations was also provided in order to limit scattered values below 1 and above 7 m/s. Results for three different threshold levels are shown, i.e. 0.05 (Figs. 8a, 8d), 0.1 (Figs. 8b, 8e) and 0.15 (Figs. 8c, 8f). Moreover, the mean of the RMSE of phase velocity estimated based on 40 iterations is tabulated in Table II. Data for the 2D-FT method are strongly affected by the given threshold level. For example the 2D-FT peaks approach can decrease the mean of the RMSE from 1.334 to 0.445 m/s when threshold changes from 0.05 to 0.15. Similar behavior is observed for the other techniques. The biggest RMSE decrease is present for the 2D-FT gradient fitted method where the mean of the RMSE dropped from 7.217 to 0.269 m/s. For the MUSIC method changing the threshold value does not yield much difference. Differences at a level of one thousandth of the RMSE are observed. This demonstrates that the threshold levels should be carefully selected for considered data type when 2D-FT approach is used. In further applications its optimal value should be applied.
Fig. 8.
First row presents the k-space spectra calculated using the 2D-FT technique, superimposed with wavenumbers captured by the 2D-FT Gradient method (white circles). The second row instead, shows phase velocities calculated using various approaches, i.e. 2D-FT Gradient, 2D-FT Peaks, 2D-FT Gradient fitted, MUSIC Gradient, MUSIC peaks and MUSIC Gradient fitted. Individual figures correspond for a threshold value of (a), (d) 0.05, (b), (e) 0.1 and (c), (f) 0.15. All presented data were processed for a radiation force focused, at depth of 50 mm, for the numerical FEM data with assumed material properties of G0 = 15 kPa, G∞ = 4 kPa and β = 5500 1/s (Phantom 2). SNR value was set to 20 dB.
TABLE II.
Mean of the RMSE for phase velocity calculated for various threshold levels as presented in Fig. 8. Results are presented in a unit of meter per second [m/s].
| Threshold | 2D-FT Peaks | 2D-FT Gradient | 2D-FT Gradient fitted | MUSIC Peaks | MUSIC Gradient | MUSIC Gradient fitted |
|---|---|---|---|---|---|---|
| 0.05 | 1.334 | 1.332 | 7.217 | 0.183 | 0.103 | 0.080 |
| 0.10 | 0.535 | 0.904 | 0.215 | 0.181 | 0.101 | 0.079 |
| 0.15 | 0.445 | 0.736 | 0.269 | 0.182 | 0.102 | 0.078 |
D. Experimental QIBA Phantom Results
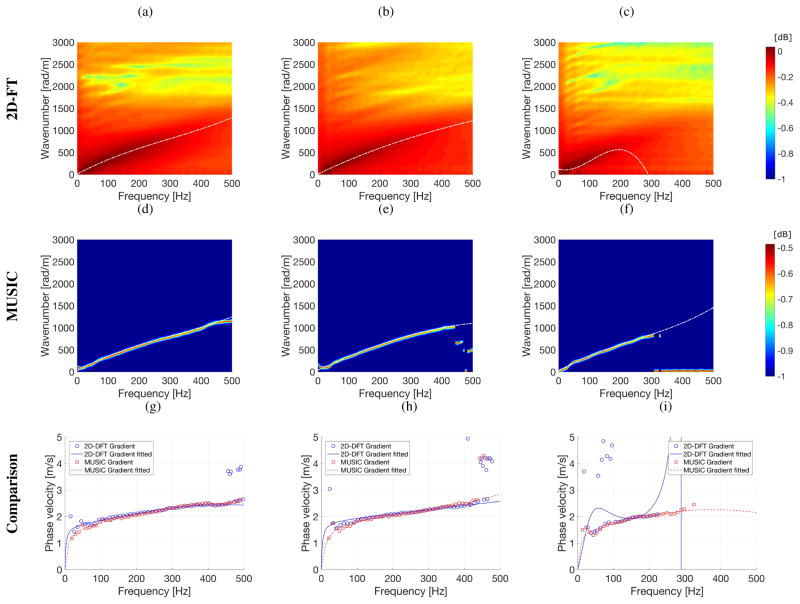
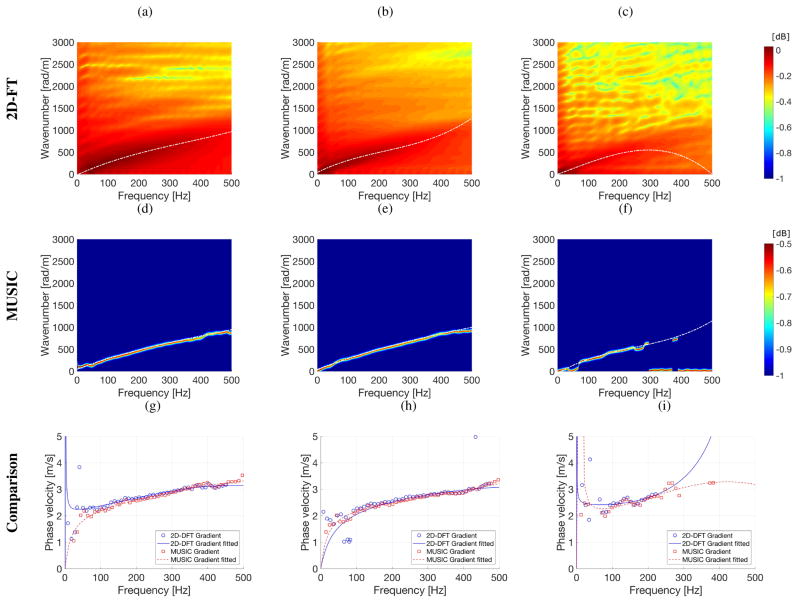
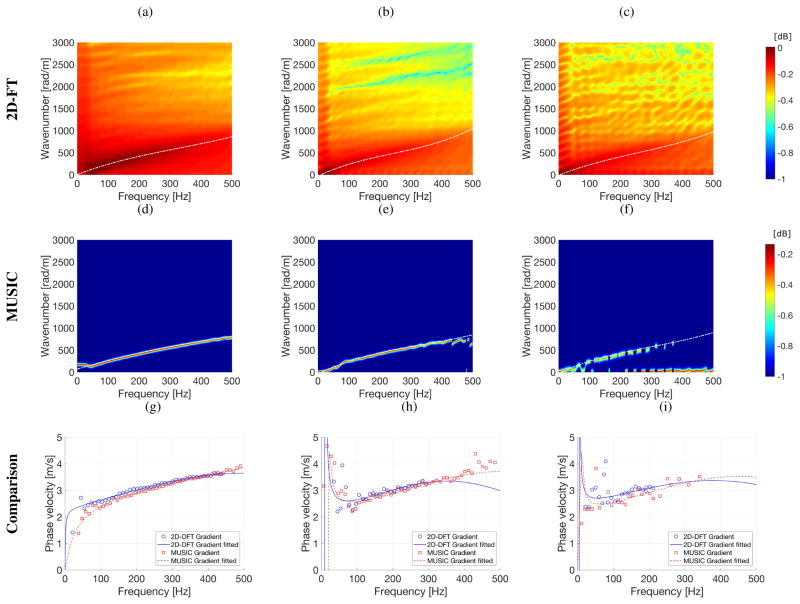
In this section the MUSIC-based method used for the k-space spectra and phase velocity estimation of shear waves was adopted for the experimental QIBA phantom data. As in the previous sections (III-B and III-C), results for the MUSIC-based method are compared with those from the 2D-FT. In this section three different QIBA phantoms were investigated and results are depicted in Figs. 9, 10 and 11. For each phantom various focal depths were studied, namely: 30, 45 and 70 mm. As in Sec. III-B, here a polynomial curve fitting was done for the k-space spectra. Plots showing the phase velocity results ((g)–(i) in Figs. 9–11) contain outcomes only for the gradient based method (for both MUSIC and 2D-FT). Results based on searching for the maximum peaks approach were omitted here due to its inferior efficiency as proved previously in Secs. III-B and III-C.
Fig. 9.
Magnitude of the k-space spectra calculated using the 2D-FT (top row) and MUSIC (middle row) methods, and comparison of phase velocities calculated based on various approaches (bottom row). Results were calculated for the QIBA phantom type A with a focal depth of: (a), (d), (g) 30 mm, (b), (e), (h) 45 mm and (c), (f), (i) 70 mm. Dash-dotted lines in the k-space spectra correspond to a polynomial fitting.
Fig. 10.
Magnitude of the k-space spectra calculated using the 2D-FT (top row) and MUSIC (middle row) methods, and comparison of phase velocities calculated based on various approaches (bottom row). Results were calculated for the QIBA phantom type B with a focal depth of: (a), (d), (g) 30 mm, (b), (e), (h) 45 mm and (c), (f), (i) 70 mm. Dash-dotted lines in the k-space spectra correspond to a polynomial fitting.
Fig. 11.
Magnitude of the k-space spectra calculated using the 2D-FT (top row) and MUSIC (middle row) methods, and comparison of phase velocities calculated based on various approaches (bottom row). Results were calculated for the QIBA phantom type C with a focal depth of: (a), (d), (g) 30 mm, (b), (e), (h) 45 mm and (c), (f), (i) 70 mm. Dash-dotted lines in the k-space spectra correspond to a polynomial fitting.
The k-space spectra evaluated based on the MUSIC method show robust wavenumber-frequency pairs for all phantoms and focal depths investigated, similar to the observations in the simulation study. Strong wave modes, i.e. amplitudes, for the k-space spectra calculated using the 2D-FT approach are visible up to 400 Hz (for the focal depths of 30 and 45 mm) and 200 Hz (for the focal depth of 70 mm). Polynomial fitted curves prolonged this range. Nevertheless, wavenumber-frequency pairs evaluated based on the MUSIC method give more robust results for higher frequencies. This occurs for all phantoms and focal depths investigated.
The fitted curves present a “knee-shaped” pattern at the end of the shear wave modes because of the disappearance of the shear wave signal, after which the fitted curves primarily follow the noise signal at high frequencies.
The phase velocity results are also presented in Figs. 9–11 in the bottom rows. As for the numerical FEM viscoelastic phantoms, in this case the phase velocity dispersion results were calculated using the same formula c = 2πf/k. It was evaluated based on the k-space spectra presented in first and second rows for each phantom. True values were not available for these mediums. Very similar results are observed for the MUSIC and 2D-FT techniques for phantoms A and B, for a frequency ranging from 100 to 400 Hz with focal depths at 30 and 45 mm (Figs. 9g, 9h, 10g, 10h and 11g). For frequencies below 100 Hz the MUSIC and 2D-FT approaches acted differently causing uncertainties in the results.
For the deepest acoustic radiation force focusing (i.e. 70 mm), for all phantoms considered, the range of frequencies for which the phase velocities are reliable is limited probably due to the poorer SNR for the shear waves measured at this deep focal depth. Only phantom A has stable results for the MUSIC approach at the deepest focal depth, for which the SNR is 35 dB. Table III shows the value of SNR for different focal depths, for all QIBA phantoms investigated.
TABLE III.
Approximate SNR values of the QIBA experimental phantoms. Presented values are in units of decibels [dB].
| Focal depth [mm] | QIBA Phantom Type | ||
|---|---|---|---|
| A | B | C | |
| 30 | 38 | 43 | 43 |
| 45 | 40 | 37 | 27 |
| 70 | 35 | 23 | 14 |
IV. Discussion
A method for the estimation of k-space spectra and phase velocities for shear waves ultrasound used for medical applications - based on the Multiple Signal Classification method - has been proposed. The approach utilizes a one-dimensional time-domain Fourier transform and the MUSIC method to find the wavenumber-frequency content of the shear wave signal. In addition to the maximum peak method for identifying the dispersion curves in the k-space, we introduced an alternative gradient-based method to find zero-crossings that represented the phase velocities. An additional step that was employed was the use of a polynomial to fit wavenumber data points identified with the gradient-based search method.
It should be noted that the gradient-based method is an empirical approach to take into account a two-dimensional search in the k-f space similar to that shown in Bernal, et al. [20]. We will explore a rigorous theoretical development related to this method in future work to clarify how this method works.
These methods were tested on simulated data from FEM models of shear wave propagation induced by acoustic radiation force in viscoelastic media. We compared the performance of the different methods based on the 2D-FT and MUSIC methods using different levels of added noise as depicted in examples in Figs. 4–6 and more thoroughly with an analysis of the RMSE in Fig. 7 and Table V. The results in Fig. 7 showed that in general the 2D-FT methods had much higher values of RMSE than their counterparts based on the MUSIC method. This was particularly evident as the SNR of the data was varied. The MUSIC method RMSE did not vary significantly as the SNR varied. In addition, the MUSIC with gradient-based search method typically had lower RMSE compared to using the peaks, and using the fitting function improved the results slightly compared to not using the fitting.
The methods were also tested with experimental data in tissue-mimicking viscoelastic phantoms. The results were generally similar between the 2D-FT and MUSIC methods. However, when using the fitting, the usable bandwidth of phase velocities was typically increased as summarized in Table IV. To determine the usable bandwidth, the peak with the highest frequency that exceeded the magnitude threshold was selected. In the case of the fitted curves, the usable bandwidth was defined as the last point prior to the fit turning into the knee shape. The bandwidth is generally higher in the FEM data compared to the experimental phantom data. The finite energy in the push in the experiment limits the motion bandwidth.
TABLE IV.
A maximum frequency of the usable bandwidth of phase velocities for the QIBA experimental data. Presented values are in a unit of Hertz [Hz].
| QIBA Phantom Type: | A | B | C | ||||||
|---|---|---|---|---|---|---|---|---|---|
| Focal depth [mm]: | 30 | 45 | 70 | 30 | 45 | 70 | 30 | 45 | 70 |
| 2D-FT Gradient | 451 | 395 | 260 | 456 | 474 | 187 | 435 | 300 | 270 |
| 2D-FT Gradient fitted | 460 | 395 | 265 | 470 | 480 | 190 | 435 | 300 | 270 |
| MUSIC Gradient | 530 | 440 | 300 | 530 | 530 | 245 | 540 | 475 | 287 |
| MUSIC Gradient fitted | 540 | 420 | 320 | 530 | 530 | 245 | 560 | 480 | 287 |
The threshold applied on the magnitude chosen for the 2D-FT and MUSIC analyses were varied in Fig. 8 and Table II. The MUSIC method results were not as dependent on thresholding as those from the 2D-FT technique. This is another advantage of the MUSIC method.
The MUSIC method does require tuning parameters to be used, and typically there is an optimal value to provide the most accurate measurements. Namely, the size of the autocorrelation matrix, M, should be tuned (treated as the noise subspace eigenfilter), as well as the p value representing the number of main components present in an investigated signal. Since, the number of complex exponentials must be known a priori, the method is somewhat limited. For investigation of guided waves where there may be more than one mode, the value of p may have to be varied to explore how many modes might be produced by an acoustic radiation force push or some other type of excitation.
It should be noted that the wave velocity dispersion results from both the 2D-FT and MUSIC methods are dependent on the data input to the algorithm. The acoustic radiation force push produced by array transducers is often approximated as a cylindrical source as opposed to a plane wave [4]. As a result, it has become more common, particularly when trying to solve for the shear wave attenuation, a correction is applied to account for the geometric attenuation produced by the cylindrical wave source [25], [47]–[50]. In the reports by Rouze, et al., and Nenadic, et al., this correction does not yield a large change in the wave velocity dispersion. However, adjusting the distance range of the data, i.e., the distance from the source and the distance traveled, can cause changes to the dispersion. This has been observed in practice [50] but not systematically explained yet.
Some of the bias in the measurements, even with no noise in the FEM data, may come from two sources. First, the acoustic radiation force push is generally well-behaved near the focus, but shear waves are created from pre-focal and post-focal zones and could constructively interfere to introduce error into the measurements. Equations (2)–(4) are related to ideal plane wave propagation, and in the numerical and physical phantom data, the plane wave case is not obtained. The work by Rouze, et al. [25] does develop theory to partially deal with this in accounting for the focal region, but is still not complete as there are shear waves generated before and after the focal region as previously mentioned. The second source may the algorithm itself producing some systematic bias.
Another aspect for the use of the MUSIC method in practice is physiological (breathing, cardiac) or subject motion. These factors would affect the quality of the measured shear wave. Filtering approaches could be utilized to reduce these effects or care could be taken during the acquisition to avoid or mitigate these factors. Future studies, would be devoted to comparing the 2D-FT and MUSIC methods in data from biological tissues.
In future work, we will use these methods on data from ex vivo and in vivo tissue measurements to determine the robustness of the MUSIC method, gradient search, and curve fitting approach. For guided wave cases, there are typically multiple modes present. The MUSIC method requires the number of expected modes to be specified and that can be an input parameter to the algorithm, but was not explored in this study.
V. Conclusions
A method for estimation of wave velocity dispersion curves based on the MUSIC method was presented. We also added the developments of an empirical gradient-based search for peaks in the wavenumber-frequency space and the use of curve fitting to reduce variation in the estimated phase velocities. The newly developed methods were tested on simulated and experimental phantom data. In comparison with the classical 2D-FT methods, the MUSIC method achieved better performance with reduced SNR in the simulation data and extended the usable bandwidth for dispersion analysis in experimental results. Future work will be devoted to using this method in viscoelastic characterization of soft tissues.
Acknowledgments
This work was supported by the RSNA QIBA Ultrasound Shear Wave Speed Committee contract HHSN268201500021C. This study was supported in part by grants R01DK092255 and R01DK106957 from the National Institute of Diabetes and Digestive and Kidney Diseases and the National Institutes of Health. P. Kijanka was supported by the Foundation for Polish Science (FNP) under the START stipend no. 46.2016. The content is solely the responsibility of the authors and does not necessarily represent the official views of the National Institute of Diabetes and Digestive and Kidney Diseases or the National Institutes of Health.
Appendix
TABLE V.
Mean of the RMSE estimated for phase velocity calculated in 40 iterations in a frequency range from 100 to 1400 Hz at a radiation force focused at various depths for the numerical FEM phantoms 1, 2 and 3. Presented data correspond to the results depicted in Fig. 7. Results are exhibited in a unit of meter per second [m/s]. Red values present the highest mean of the RMSE whereas green one the lowest, for investigated phantom data.
References
- 1.Sarvazyan AP, Rudenko OV, Swanson SD, Fowlkes JB, Emelianov SY. Shear wave elasticity imaging: a new ultrasonic technology of medical diagnostics. Ultrasound in medicine & biology. 1998;24(9):1419–1435. doi: 10.1016/s0301-5629(98)00110-0. [DOI] [PubMed] [Google Scholar]
- 2.Sarvazyan A, Hall T, Urban M, Fatemi M, Aglyamov S, Garra B. Elasticity imaging-an emerging branch of medical imaging. an overview. Curr Med Imaging Rev. 2011;7(4):255–282. doi: 10.2174/157340511798038684. [DOI] [PMC free article] [PubMed] [Google Scholar]
- 3.Palmeri ML, Wang MH, Dahl JJ, Frinkley KD, Nightingale KR. Quantifying hepatic shear modulus in vivo using acoustic radiation force. Ultrasound in medicine & biology. 2008;34(4):546–558. doi: 10.1016/j.ultrasmedbio.2007.10.009. [DOI] [PMC free article] [PubMed] [Google Scholar]
- 4.Chen S, Fatemi M, Greenleaf JF. Quantifying elasticity and viscosity from measurement of shear wave speed dispersion. The Journal of the Acoustical Society of America. 2004;115(6):2781–2785. doi: 10.1121/1.1739480. [DOI] [PubMed] [Google Scholar]
- 5.Chen S, Urban MW, Pislaru C, Kinnick R, Zheng Y, Yao A, Greenleaf JF. Shearwave dispersion ultrasound vibrometry (sduv) for measuring tissue elasticity and viscosity. IEEE transactions on ultrasonics, ferroelectrics, and frequency control. 2009;56(1):55–62. doi: 10.1109/TUFFC.2009.1005. [DOI] [PMC free article] [PubMed] [Google Scholar]
- 6.Deffieux T, Montaldo G, Tanter M, Fink M. Shear wave spectroscopy for in vivo quantification of human soft tissues viscoelasticity. IEEE transactions on medical imaging. 2009;28(3):313–322. doi: 10.1109/TMI.2008.925077. [DOI] [PubMed] [Google Scholar]
- 7.Catheline S, Gennisson J-L, Delon G, Fink M, Sinkus R, Abouelkaram S, Culioli J. Measurement of viscoelastic properties of homogeneous soft solid using transient elastography: an inverse problem approach. The Journal of the Acoustical Society of America. 2004;116(6):3734–3741. doi: 10.1121/1.1815075. [DOI] [PubMed] [Google Scholar]
- 8.Zhang M, Nigwekar P, Castaneda B, Hoyt K, Joseph JV, di Sant’Agnese A, Messing EM, Strang JG, Rubens DJ, Parker KJ. Quantitative characterization of viscoelastic properties of human prostate correlated with histology. Ultrasound in medicine & biology. 2008;34(7):1033–1042. doi: 10.1016/j.ultrasmedbio.2007.11.024. [DOI] [PubMed] [Google Scholar]
- 9.Rose JL. Ultrasonic guided waves in solid media. Cambridge University Press; 2014. [Google Scholar]
- 10.Kundu T. Ultrasonic nondestructive evaluation: engineering and biological material characterization. CRC press; 2003. [Google Scholar]
- 11.Nenadic IZ, Urban MW, Pislaru C, Greenleaf JF. In vivo measurements of arterial elasticity and viscosity through a heart cycle. presented at the Euroson; Madrid, Spain. 2012. [Google Scholar]
- 12.Urban MW, Astaneh AV, Aquino W, Greenleaf JF, Guddati MN. Measured wave dispersion in tubes excited with acoustic radiation force matches theoretical guided wave dispersion. Ultrasonics Symposium (IUS), 2016 IEEE International, IEEE; 2016; pp. 1–4. [Google Scholar]
- 13.Nenadic IZ, Urban MW, Mitchell SA, Greenleaf JF. Lamb wave dispersion ultrasound vibrometry (lduv) method for quantifying mechanical properties of viscoelastic solids. Physics in medicine and biology. 2011;56(7):2245. doi: 10.1088/0031-9155/56/7/021. [DOI] [PMC free article] [PubMed] [Google Scholar]
- 14.Nenadic IZ, Urban MW, Pislaru C, Bernal M, Greenleaf JF. In vivo open and closed chest measurements of myocardial viscoelasticity through a heart cycle using lamb wave dispersion ultrasound vibrometry (lduv). 2011 IEEE International Ultrasonics Symposium, IEEE; 2011; pp. 17–20. [Google Scholar]
- 15.Nenadic IZ, Qiang B, Urban MW, de Araujo Vasconcelo LH, Nabavizadeh A, Alizad A, Greenleaf JF, Fatemi M. Ultrasound bladder vibrometry method for measuring viscoelasticity of the bladder wall. Physics in medicine and biology. 2013;58(8):2675. doi: 10.1088/0031-9155/58/8/2675. [DOI] [PubMed] [Google Scholar]
- 16.Helfenstein-Didier C, Andrade R, Brum J, Hug F, Tanter M, Nordez A, Gennisson J. In vivo quantification of the shear modulus of the human achilles tendon during passive loading using shear wave dispersion analysis. Physics in medicine and biology. 2016;61(6):2485. doi: 10.1088/0031-9155/61/6/2485. [DOI] [PubMed] [Google Scholar]
- 17.Montaldo G, Tanter M, Bercoff J, Benech N, Fink M. Coherent plane-wave compounding for very high frame rate ultrasonography and transient elastography. IEEE transactions on ultrasonics, ferroelectrics, and frequency control. 2009;56(3):489–506. doi: 10.1109/TUFFC.2009.1067. [DOI] [PubMed] [Google Scholar]
- 18.Song P, Macdonald MC, Behler RH, Lanning JD, Wang MH, Urban MW, Manduca A, Zhao H, Callstrom MR, Alizad A, et al. Two-dimensional shear-wave elastography on conventional ultrasound scanners with time-aligned sequential tracking (tast) and comb-push ultrasound shear elastography (cuse) IEEE transactions on ultrasonics, ferroelectrics, and frequency control. 2015;62(2):290–302. doi: 10.1109/TUFFC.2014.006628. [DOI] [PMC free article] [PubMed] [Google Scholar]
- 19.Alleyne D, Cawley P. A two-dimensional fourier transform method for the measurement of propagating multimode signals. The Journal of the Acoustical Society of America. 1991;89(3):1159–1168. [Google Scholar]
- 20.Bernal M, Nenadic I, Urban MW, Greenleaf JF. Material property estimation for tubes and arteries using ultrasound radiation force and analysis of propagating modes. The Journal of the Acoustical Society of America. 2011;129(3):1344–1354. doi: 10.1121/1.3533735. [DOI] [PMC free article] [PubMed] [Google Scholar]
- 21.Palmeri ML, Deng Y, Rouze NC, Nightingale KR. Dependence of shear wave spectral content on acoustic radiation force excitation duration and spatial beamwidth. Ultrasonics Symposium (IUS), 2014 IEEE International. IEEE; 2014; pp. 1105–1108. [Google Scholar]
- 22.Nightingale KR, Rouze NC, Rosenzweig SJ, Wang MH, Abdelmalek MF, Guy CD, Palmeri ML. Derivation and analysis of viscoelastic properties in human liver: Impact of frequency on fibrosis and steatosis staging. IEEE transactions on ultrasonics, ferroelectrics, and frequency control. 2015;62(1):165–175. doi: 10.1109/TUFFC.2014.006653. [DOI] [PMC free article] [PubMed] [Google Scholar]
- 23.Schmidt R. Multiple emitter location and signal parameter estimation. IEEE transactions on antennas and propagation. 1986;34(3):276–280. [Google Scholar]
- 24.Ambrozinski L, Packo P, Pieczonka L, Stepinski T, Uhl T, Staszewski W. Identification of material properties–efficient modelling approach based on guided wave propagation and spatial multiple signal classification. Structural Control and Health Monitoring. 2015;22(7):969–983. [Google Scholar]
- 25.Rouze NC, Palmeri ML, Nightingale KR. An analytic, fourier domain description of shear wave propagation in a viscoelastic medium using asymmetric gaussian sources. The Journal of the Acoustical Society of America. 2015;138(2):1012–1022. doi: 10.1121/1.4927492. [DOI] [PMC free article] [PubMed] [Google Scholar]
- 26.Palmeri ML, Sharma AC, Bouchard RR, Nightingale RW, Nightingale KR. A finite-element method model of soft tissue response to impulsive acoustic radiation force. IEEE transactions on ultrasonics, ferroelectrics, and frequency control. 2005;52(10):1699–1712. doi: 10.1109/tuffc.2005.1561624. [DOI] [PMC free article] [PubMed] [Google Scholar]
- 27.Rouze NC, Wang MH, Palmeri ML, Nightingale KR. Parameters affecting the resolution and accuracy of 2-d quantitative shear wave images. IEEE transactions on ultrasonics, ferroelectrics, and frequency control. 2012;59(8):1729–1740. doi: 10.1109/TUFFC.2012.2377. [DOI] [PMC free article] [PubMed] [Google Scholar]
- 28.Rouze NC, Wang MH, Palmeri ML, Nightingale KR. Finite element modeling of impulsive excitation and shear wave propagation in an incompressible, transversely isotropic medium. Journal of biomechanics. 2013;46(16):2761–2768. doi: 10.1016/j.jbiomech.2013.09.008. [DOI] [PMC free article] [PubMed] [Google Scholar]
- 29.Zhou S, Robert J-L, Fraser J, Shi Y, Xie H, Shamdasani V. Finite element modeling for shear wave elastography. 2011 IEEE International Ultrasonics Symposium IEEE; 2011; pp. 2400–2403. [Google Scholar]
- 30.Aristizabal S, Amador C, Qiang B, Kinnick RR, Nenadic IZ, Greenleaf JF, Urban MW. Shear wave vibrometry evaluation in transverse isotropic tissue mimicking phantoms and skeletal muscle. Physics in medicine and biology. 2014;59(24):7735. doi: 10.1088/0031-9155/59/24/7735. [DOI] [PMC free article] [PubMed] [Google Scholar]
- 31.Qiang B, Brigham JC, Aristizabal S, Greenleaf JF, Zhang X, Urban MW. Modeling transversely isotropic, viscoelastic, incompressible tissue-like materials with application in ultrasound shear wave elastography. Physics in medicine and biology. 2015;60(3):1289. doi: 10.1088/0031-9155/60/3/1289. [DOI] [PMC free article] [PubMed] [Google Scholar]
- 32.Caenen A, Shcherbakova D, Verhegghe B, Papadacci C, Pernot M, Segers P, Swillens A. A versatile and experimentally validated finite element model to assess the accuracy of shear wave elastography in a bounded viscoelastic medium. IEEE transactions on ultrasonics, ferroelectrics, and frequency control. 2015;62(3):439–450. doi: 10.1109/TUFFC.2014.006682. [DOI] [PubMed] [Google Scholar]
- 33.Palmeri M, Qiang B, Chen S, Urban M. Guidelines for finite element modeling of acoustic radiation force-induced shear wave propagation in tissue-mimicking media. IEEE Transactions on Ultrasonics, Ferroelectrics, and Frequency Control. 2016 doi: 10.1109/TUFFC.2016.2641299. [DOI] [PMC free article] [PubMed] [Google Scholar]
- 34.Jensen JA, Svendsen NB. Calculation of pressure fields from arbitrarily shaped, apodized, and excited ultrasound transducers. IEEE transactions on ultrasonics, ferroelectrics, and frequency control. 1992;39(2):262–267. doi: 10.1109/58.139123. [DOI] [PubMed] [Google Scholar]
- 35.Jensen JA. Field: A program for simulating ultrasound systems. 10TH NORDICBALTIC CONFERENCE ON BIOMEDICAL IMAGING; Citeseer. 1996.pp. 351–353. PART 1. [Google Scholar]
- 36.Nightingale KR, Palmeri ML, Nightingale RW, Trahey GE. On the feasibility of remote palpation using acoustic radiation force. The Journal of the Acoustical Society of America. 2001;110(1):625–634. doi: 10.1121/1.1378344. [DOI] [PubMed] [Google Scholar]
- 37.Palmeri ML, Qiang B, Chen S, Urban MW. Guidelines for finite-element modeling of acoustic radiation force-induced shear wave propagation in tissue-mimicking media. IEEE transactions on ultrasonics, ferroelectrics, and frequency control. 2017;64(1):78–92. doi: 10.1109/TUFFC.2016.2641299. [DOI] [PMC free article] [PubMed] [Google Scholar]
- 38.Radiological society of north america quantitative imaging biomarker alliance (rsna qiba) Ultrasound Shear Wave Speed Technical Commitee. 2012 [Google Scholar]
- 39.Hall TJ, Milkowski A, Garra B, Carson P, Palmeri M, Nightingale K, Lynch T, Alturki A, Andre M, Audiere S, et al. Rsna/qiba: shear wave speed as a biomarker for liver fibrosis staging. 2013 IEEE International Ultrasonics Symposium (IUS). IEEE; 2013; pp. 397–400. [Google Scholar]
- 40.Palmeri M, Nightingale K, SFielding S, Rouze N, Deng Y, Lynch T, Chen S, PSong P, Urban M, Xie H, et al. Rsna qiba ultrasound shear wave speed phase ii phantom study in viscoelastic media. Ultrasonics Symposium (IUS), 2015 IEEE International. IEEE; 2015; pp. 1–4. [Google Scholar]
- 41.Kasai C, Namekawa K, Koyano A, Omoto R. Real-time two-dimensional blood flow imaging using an autocorrelation technique. IEEE Trans Sonics Ultrason. 1985;32(3):458–464. [Google Scholar]
- 42.Pisarenko VF. The retrieval of harmonics from a covariance function. Geophysical Journal International. 1973;33(3):347–366. [Google Scholar]
- 43.Hayes MH. Statistical digital signal processing and modeling. john wiley & sons; New York: 1996. [Google Scholar]
- 44.Morvan B, Hladky-Hennion A-C, Leduc D, Izbicki J-L. Ultrasonic guided waves on a periodical grating: Coupled modes in the first brillouin zone. Journal of applied physics. 2007;101(11):114906. [Google Scholar]
- 45.Kijanka P, Staszewski WJ, Packo P. SPIE Smart Structures and Materials+ Nondestructive Evaluation and Health Monitoring. International Society for Optics and Photonics; 2016. Simulation of guided wave propagation near numerical brillouin zones; pp. 98050Q–98050Q. [Google Scholar]
- 46.Yin M, Glaser KJ, Talwalkar JA, Chen J, Manduca A, Ehman RL. Hepatic mr elastography: clinical performance in a series of 1377 consecutive examinations. Radiology. 2015;278(1):114–124. doi: 10.1148/radiol.2015142141. [DOI] [PMC free article] [PubMed] [Google Scholar]
- 47.Graff KF. Wave motion in elastic solids. Courier Corporation; 2012. [Google Scholar]
- 48.Nenadic IZ, Qiang B, Urban MW, Zhao H, Sanchez W, Greenleaf JF, Chen S. Attenuation measuring ultrasound shearwave elastography and in vivo application in post-transplant liver patients. Physics in medicine and biology. 2016;62(2):484. doi: 10.1088/1361-6560/aa4f6f. [DOI] [PMC free article] [PubMed] [Google Scholar]
- 49.Budelli E, Brum J, Bernal M, Deffieux T, Tanter M, Lema P, Negreira C, Gennisson J-L. A diffraction correction for storage and loss moduli imaging using radiation force based elastography. Physics in medicine and biology. 2016;62(1):91. doi: 10.1088/1361-6560/62/1/91. [DOI] [PubMed] [Google Scholar]
- 50.Rouze NC, Deng Y, Palmeri ML, Nightingale KR. Accounting for the spatial observation window in the 2-d fourier transform analysis of shear wave attenuation. Ultrasound in Medicine & Biology. 2017;43(10):2500–2506. doi: 10.1016/j.ultrasmedbio.2017.06.006. [DOI] [PMC free article] [PubMed] [Google Scholar]


