Abstract
Microtubule (MT) dynamics quantification includes modeling of elongation, rapid shortening, and pauses. It indicates the effect of the cancer treatment drug paclitaxel because the drug causes MTs to bundle, which will in turn inhibit successful mitosis of cancerous cells. Thus, automatic MT dynamics analysis has been researched intensely because it allows for faster evaluation of potential cancer treatments and better understanding of drug effects on a cell. However, most current literatures still use manual initialization. In this work, we propose an automatic initialization algorithm that selects isolated and active tips for tracking. We use a Gaussian match filter to enhance the MT structures, and a novel technique called Pixel Nucleus Analysis (PNA) for isolated MT tip detection. To find dynamic tips, we applied a masked FFT in the temporal domain followed by K-means clustering. To evaluate the selected tips, we used a low level tip linking algorithm, and show the results of applying the algorithm to a model image and five MCF-7 breast cancer cell line images captured using fluorescent confocal microscopy. Finally, we compare tip selection criteria with existing automatic selection algorithms. We conclude that the proposed analysis is an effective technique based on three criteria which include outer region selection, separation, and MT dynamics.
Introduction
MICROTUBULES are biopolymers made of tubulin αβ-dimers that form part of the cellular cytoskeleton. Drugs used in the treatment of cancer such as paclitaxel have been shown to stabilize the MTs [1] which can inhibit successful mitosis. The cell cycle then stalls until eventual cell death [2]. The evaluation of the lowest effective dose in cancer treatment could allow for decreased side effects to other cells. Measuring MT dynamics allows for the evaluation of potential cancer treatments and understanding of how certain drugs affect the cell.
The evaluation process is usually done by experts through manual tracking of MT ends. This is a time consuming process that limits reproducibility [3]. Thus, researchers have attempted automatic MT dynamic analysis in recent years. However, most literatures use manual initializations that prevent the algorithm from being a fully automatic process.
Automatic initialization algorithms should pick “good” tips to start tracking. A “good” tip generally satisfies three criteria. First, the tips should be located in the outer region of the cell where MT structure can be easily differentiated. Second, the tip should show dynamics (growth or shrinking). Third, the tip should be isolated from other tips because intersection of moving tips can cause problems in many tracking algorithms[3] [4]. Two current methods for automatic initialization can be found in [4] and [5]. In[5], they assimilated the intensity of the image by a sum of Gaussian functions, and MT tips are selected in the regions where the intensity drops below a certain percentage of the highest intensity. Unfortunately, the dynamics of the selected tips is not considered. In [4] a FFT in the temporal domain is used to find high activity and outer regions, but the isolated condition of tips is not guaranteed.
We propose an automatic initialization algorithm that selects tips based on the three criteria previously mentioned. First, we use a Gaussian match filter to enhance the MT structures, and a novel technique called Pixel Nucleus Analysis (PNA) for isolated MT tip detection. To find dynamic tips, we applied a masked FFT in the temporal domain followed by K-means clustering. To evaluate the selected tips, we used a low level tip linking algorithm, and show the results of applying the algorithm to a model image and five MCF-7 breast cancer cell line images captured using fluorescent confocal microscopy. Finally, we compare tip selection criteria with existing automatic selection algorithms. The entire process is summarized in Fig. 1.
Fig. 1.
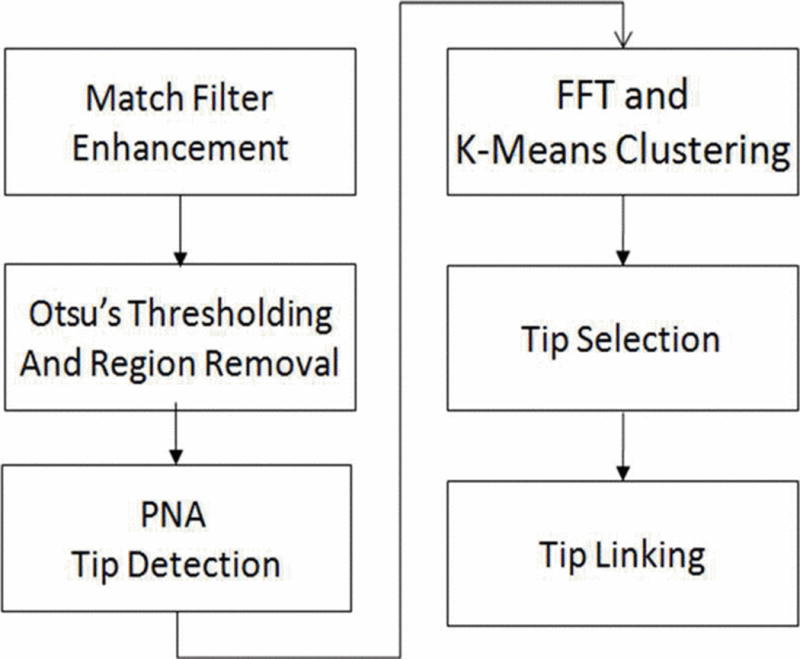
Flow chart of optimal tip selection algorithm
Tip Selection Algorithm
A. Image Enhancement
Images acquired from fluorescent confocal microscopy often have a low signal-to-noise ratio (SNR) because of problems involving photo-bleaching and focusing. Therefore, it is crucial to reduce noise and enhance the MT structures before further processing. Different approaches include a second derivative Gaussian filter [6] and an elliptical filter [5] to enhance the image. These various image enhancement techniques have different performances depending on the quality of the acquired images. In the proposed method, a Gaussian match filter was designed by combining two Gaussian functions in the x and y coordinates. This allows for enhancement of the intensity across the MTs and along the MT tips. The normalized filter is then rotated by 20 different angles ϕk=k(180∘20) where k=0,1,…,19, and is applied respectively to the image. The maximum response of the twenty filters on each pixel is then taken to be the intensity of that pixel for the final filtered image. Fig. 2(a) and Fig. 2(b) show the original and filtered image.
Fig. 2.
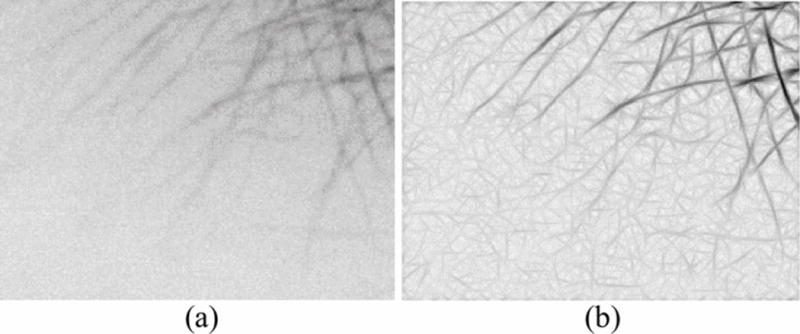
(a) Original image; (b) Filtered image
B. Threshold & Small Region removal
The next step is to generate a binary image of MT structures while suppressing background noise. We use Otsu’s method [7] to obtain an optimal threshold of the image. This method calculates the separation of the two classes so that the between-class distance is maximized while the in-class variance is minimized. We eliminate regions that have fewer pixels than a specific threshold, which is empirically predefined as 15 pixels. These regions are generated using the Matlab function bwlabel, which assigns each group of connected pixels a unique label. Fig. 3 shows the binary image after thresholding and the image after identification and removal of the small regions.
Fig. 3.
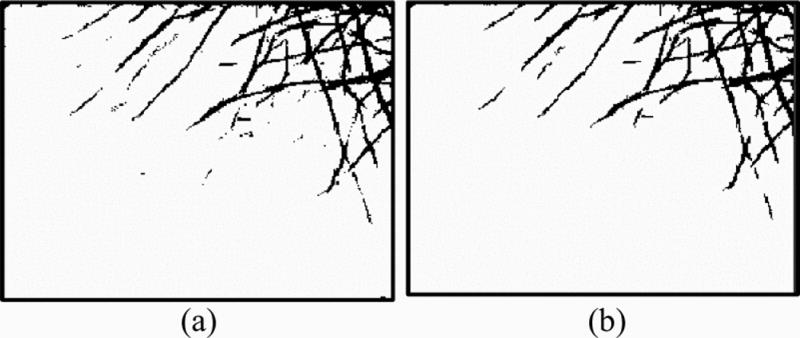
(a) Binary image obtained by Otsu’s threshold; (b) Noise removed
C. Pixel Nucleus Analysis (PNA)
The PNA algorithm was inspired by the Smallest Univalue Segment Assimilating Nucleus (SUSAN) corner detection algorithm [8]. The SUSAN algorithm first places a solid circular mask around the current pixel being analyzed (also called the nucleus). Then, the centroid of the mask is calculated and used to determine if the current pixel is a corner.
The PNA algorithm begins with a check function on a binary image of a MT structure, as shown in Fig. 4(a). A ring mask of radius R is centered at each dark pixel. If there is only one bump on the intensity graph of the pixels on the mask, we decide that the pixel is located near a tip, and the check function returns “True”; if zero or more than one bump is noticed, the pixel is not near an isolated tip and the check function returns “False”.
Fig. 4.
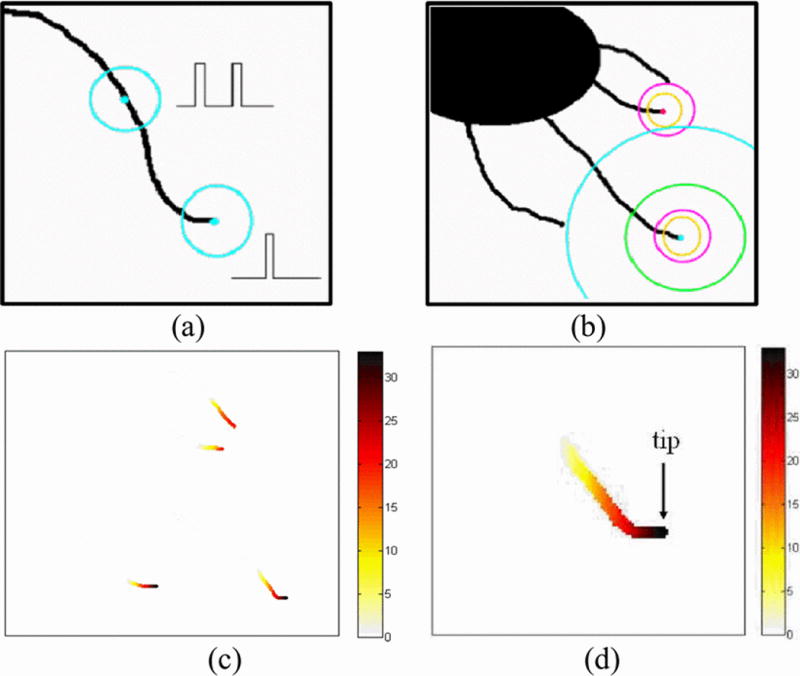
(a) Tip check function; (b) Tips detected by PNA algorithm; (c) PNA count; (d) Tip location found
Then, suppose we have an image of multiple MTs, as shown in Fig. 4(b). For each pixel on the MT, run multiple check functions of varying radii ranging from 2 to Rmax (set to 20 in this case). The total PNA count is defined as the number of times the check function returns “True” for a given pixel.
We can see that the more isolated the tip is from others, there is a higher chance that the check function will return “True” hence the PNA count will be high. Figure 4(c) shows the counts after the PNA algorithm is performed on Fig. 4(b). To obtain the pixel tip locations, we take the pixel that has the highest PNA count in each region. As shown in Fig. 4(d).
D. Temporal FFT Analysis
In the analysis of MT dynamics, we are usually more interested in tracking MTs that show high activity rather than those who remain still. In [4], an approach based on the Fast Fourier Transform (FFT) on the temporal pixel intensity values is used to extract active regions. We modify the approach by using the binary mask obtained from the PNA which contains all possible positions of the MT tips. This procedure reduces computation and the algorithm’s susceptibility to noise generated from pixel intensities that are not tips. The implemented procedure is described as follows:
- A binary mask is extracted by superimposing the PNA counts of each frame,
View Source where ci(x,y) is the PNA count matrix of the ith frame and N is the number of frames. The mask(x,y) function represents all the possible locations of MT tips. - For each location (x,y) where mask(x,y)=1, we construct a vector Ix,y=[ix,y(1)ix,y(2)…ix,y(N)], which represents the intensity of pixels located at a position (x,y) in every frame. By applying a FFT on Ix,y, we obtain the FFT coefficients. Taking the absolute value where
View Source we obtain the feature vector Px,y=[fx,y(2)fx,y(3)…fx,y(N−12)] for every location within the mask. Only the first half of the coefficients are considered with the DC coefficient ignored. We then perform K-means clustering on each feature vector Px,y. The underlying rationale is that pixels that show similar temporal variation patterns can be reflected in the frequency domain. The specific pattern of interest is intensity variations that exhibit step-function-like features which are interpreted as MT growth or shrinking. Intensity variations and FFT coefficients for the high activity cluster locations (obtained from K-means) is also shown in Fig. 6 in the results section. Pixels that have this type of property have a step function intensity variation and give FFT coefficient of a sinc function.
Fig. 6.
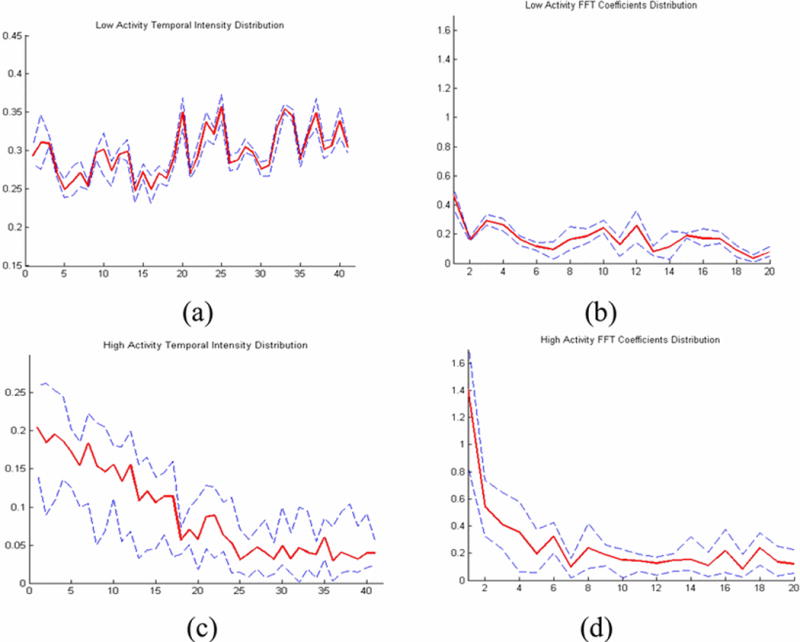
(a) Temporal variation of intensity in low activity regions; (b) FFT coefficients in low activity regions; (c) Temporal variation of intensity in high activity regions; (d) FFT coefficients in high activity regions
E. Tip Selection
The activity level of the tips detected by the PNA algorithm is evaluated by its distance to the closest high activity region. When a tip is close to a high activity region, it is considered a dynamic tip. Our strategy is to set two thresholds, Tc and Td. Let ci be the PNA count of the ith detected tip and di be its distance to the nearest high activity region. If ci is greater than Tc and di is less than Td, the tip is selected for future tracking.
F. Tip Linking
A low level tip linking algorithm was implemented based on distance. Each selected tip was linked by using a distance criterion between the current tip and the next frame tips. The tip that is within a distance, defined as 30, and closest to the previous frame tip is then linked for the current frame.
Implementation and Results
A. Model Image Sequence
In order to test the proposed algorithm, a model image sequence was used. The video sequence composed of 10 frames with zero mean and 0.1 standard deviation Gaussian noise. The images were then enhanced by the enhancement filter. The first original frame can be seen below in Fig. 5(a). In the video frames, tip #3 shrinks and tip #5 grows, while the others do not move. The tips are identified using PNA and circled in Fig. 5(b). Fig. 5(c) shows the results after the FFT and K-means clustering and contains circles over the high active regions. The final selected tips are then marked in Fig. 5(d) which correspond to #3 and #5.
Fig. 5.
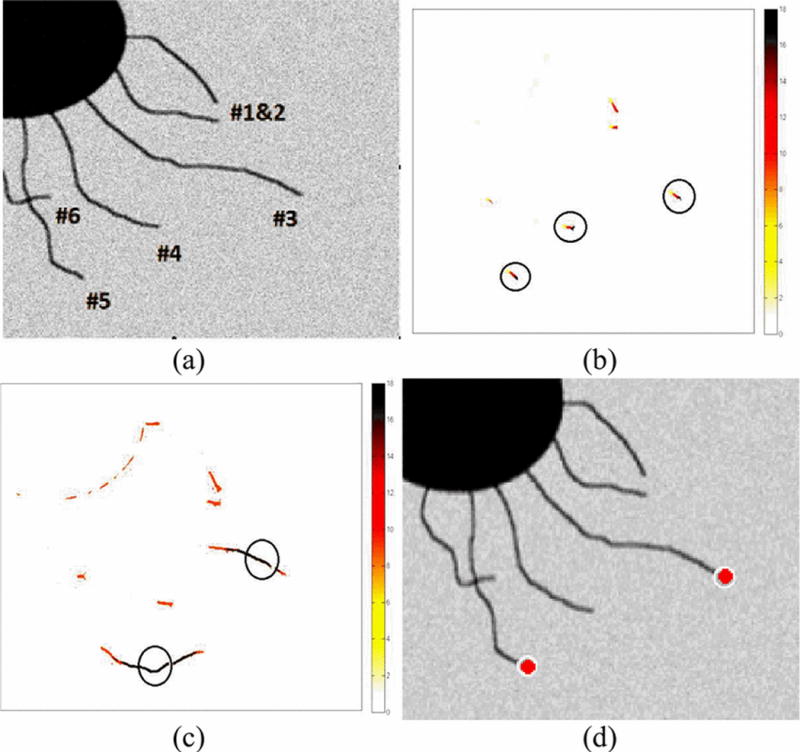
(a) Frame 1 of the model image sequence; (b) Tips circled with PNA count larger than 15; (c) K-means clustering of FFT coefficients, red represents high activity with higher regions circled; (d) Optimal tips detected
To test the robustness of the algorithm, the standard deviation of the added Gaussian noise was increased. When the standard deviation reaches a value of 0.27, the algorithm starts to return incorrect MT tip locations.
B. Experimental Image Sequence
Our first experimental image data was comprised of 41 frames of confocal fluorescent microscope image of dimension 275 by 210 pixels. After performing the algorithm on the images, we were able to detect multiple tips using the PNA algorithm. Samples of temporal variation of intensity and FFT coefficients from high and low activity regions can be seen in Fig. 6. The temporal variation of intensity tended to be a strong and noisy step function and the FFT coefficients were similar to sinc functions. The intensity and FFT coefficients of the low activity locations showed minimal change and low frequency content with occasional noise which justifies our clustering algorithm. Upon setting a threshold of 15 on the PNA count and 25 on the distance between the tips to high activity regions, three optimal tips were selected, which are spatially separated (Fig. 7). The tips also proved to be dynamically moving after evaluation using tip linking between frames.
Fig. 7.
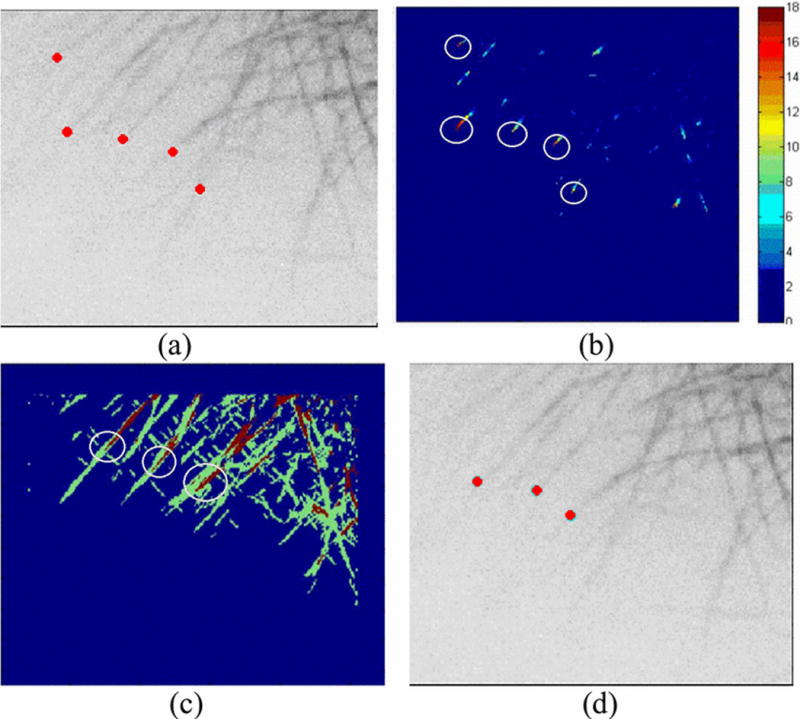
(a) Frame 1 tips with PNA count larger then 15; (b) PNA count diagram with pixels larger than 15 circled; (c) K-means clustering of FFT coefficients, red represents high activity and regions near tips are circled; (d) Optimal tips detected
To further evaluate accuracy, the algorithm was applied to four more datasets comprised of MTs with different orientations and number of “good” tips. The percentage accuracy was then calculated based on tips meeting the “good” tips criteria compared to the tips identified by the algorithm. In the results, summarized in Table I, it can be seen that the percent accuracy did not fall below 75% after processing all datasets.
TABLE I.
Percentage Accuracy Evaluation
| Image Sequence | Isolated and Dynamic Tips | Correct Tips Detected | % Accuracy |
|---|---|---|---|
| 1 | 6 | 5 | 83% |
| 2 | 10 | 8 | 80% |
| 3 | 12 | 9 | 75% |
| 4 | 6 | 5 | 83% |
| 5 | 8 | 6 | 75% |
Conclusion and Future Work
We have demonstrated how the PNA algorithm can be used to locate isolated MT tips in the outer region of the cell and how exploiting temporal data between successive frames can be incorporated to select dynamically moving tips.
The method for automatic MT selection in [4] and [5] have their limitations while the proposed algorithm is able to select tips that are in the outer region, separated, and dynamic. In method A [4], the selection of an isolated tip is not guaranteed since a simple polymer to non-polymer mass threshold is used. Also, in method B [5] MT dynamics and isolation is not considered when selecting outer region tips. As seen in the results, PNA and temporal FFT analysis masking can substantially improve on these existing algorithms by integrating all selection criteria into one. A summary of each criterion used in each method is show in Table II below.
TABLE II.
Algorithm Comparison of Tip Criteria
| Algorithm | Outer Region | Isolated | Dynamics |
|---|---|---|---|
| Method A | Yes | No | Yes |
| Method B | Yes | No | No |
| Proposed | Yes | Yes | Yes |
In the future, more work is needed in validation and development for the incorporation of gray level images with the PNA algorithm and incorporation of spatial data in the temporal FFT analysis. Also, more work can be done in the tip frame linking step by using more sophisticated techniques, such as particle filtering [9] and Kalman filtering[10]. In [10], an Active Shape Model (ASM) is integrated with Kalman filtering to utilize shape information along the longitudinal direction of the MTs and reduce noise and clutter effects. The Kalman tracking method and the particle filter method can both serve as enhancements to the current distance linking used between frames.
Our algorithm’s main purpose was to detect isolated MTs tips, and identify their dynamics for automatic initialization. An accurate method for MT tip selection would significantly advance the technology of the drug efficacy study and new drug development in silico.
Acknowledgments
This research has been supported by grants from Microsoft Research, National Institute of Health (Center of Cancer Nanotechnology Excellence U54CA119338), Georgia Cancer Coalition (Distinguished Cancer Scholar Award to Professor Wang).
Contributor Information
Mario O. Malavé, Georgia Institute of Technology, Atlanta, 30332 USA
Xuran Zhao, Georgia Institute of Technology, Atlanta, 30332 USA.
Koon Yin Kong, Georgia Institute of Technology, Atlanta, 30332 USA.
Adam I. Marcus, Winship Cancer Institute, Emory University, Atlanta, GA 30322 USA
May D. Wang, Georgia Institute of Technology, Atlanta, 30332 USA
References
- 1.Amos LA. How Taxol stabilizes microtubule structure. Current Biology. 1995 Aug;6(8):900–908. [Google Scholar]
- 2.Jordan MA, Wilson Leslie. Microtubules as a target fir Anticancer Drugs. Nature Review: Cancer. 2004 Apr;4:253–65. doi: 10.1038/nrc1317. [DOI] [PubMed] [Google Scholar]
- 3.Kong KY, Adam M, Jin YH, Paraskevi G, Wang MD. Computer assisted analysis of microtubule dynamics in living cells. IEEE Engineering in Medicine and Biology Society. 2006;4:3982–3985. doi: 10.1109/IEMBS.2005.1615334. [DOI] [PubMed] [Google Scholar]
- 4.El-Saban Motaz. University of California Ph D Thesis. 2006. Automated Microtubule Tracking and Analysis. [Google Scholar]
- 5.Hadjidemetriou S, Duncan JS, Toomre D, Tuck D. Automatic quantification of microtubule dynamics. J Microsc. 2004 Apr;1:656–659. [Google Scholar]
- 6.Bornfleth H, Satzler K, Eils R, Cremer C. High-precision distance measurements and volume-conserving segmentation of objects near and below the resolution limit in three-dimensional confocal fluorescence microscopy. J Microsc. 1998 Mar;189:118–136. [Google Scholar]
- 7.Otsu N. A threshold selection method from gray-level histograms. IEEE Transactions on Systems, Man and Cybernetics. 1979 Jan;9:62–66. [Google Scholar]
- 8.Smith SM, Brady JM. SUSAN - A New Approach to Low Level Image Processing. International Journal of Computer Vision. 1997 May;23:45–78. [Google Scholar]
- 9.Kong K, Marcus A, Giannakakou P, Wang M. Using particle filter to track and model microtubule dynamics. IEEE International Conference on Image Processing. 2007 Oct;5:517–520. [Google Scholar]
- 10.Jiang M, Ji Q, McEwen BF. Model-based automated segmentation of kinetochore microtubule from electron tomography. Proc of 26th Annual International Conference of the Engineering in Medicine and Biology Society. 2004 Mar;:1656–1659. doi: 10.1109/IEMBS.2004.1403500. [DOI] [PubMed] [Google Scholar]


