Abstract
We studied steady-state and time-resolved fluorescence properties of an anticancer drug Doxorubicin in a saline buffer and poly-vinyl alcohol (PVA) film. Absorption of Doxorubicin, located at blue-green spectral region, allows a convenient excitation with visible light emitting diodes or laser diodes. Emission of Doxorubicin with maximum near 600nm can be easily detected with photomultipliers and CCD cameras. Both, absorption and fluorescence spectra in polymeric matrix show more pronounced vibronic structures than in solution. Also, the steady-state anisotropy in the polymer film is significantly higher than in the saline solution. In PVA film the fluorescence anisotropy is about 0.30 whereas in the saline buffer only 0.07. Quantum efficiencies of Doxorubicin were compared to a known standard Rhodamine 101 which has fluorescence emission in a similar spectral region. The quantum yield of Doxorubicin in PVA film is more than 10% and about twice higher than in the saline solution. Similarly, the lifetime of doxorubicin in PVA film is about 2 ns whereas in the saline solution only about 1 ns. The fluorescence anisotropy decays show that Doxorubicin molecules are freely rotating in the saline buffer with a correlation time of about 290 ps, and are almost completely immobilized in the PVA film. The spectroscopic investigations presented in this manuscript are important, as they provide answers to changes in molecular properties of Doxorubicin depending changes in the local environment, which is useful when synthesizing nano-particles for Doxorubicin entrapment.
1. Introduction
Anthracycline antibiotics are excellent anti-tumor agents that are used to treat a wide variety of cancers. They have been employed as effective chemotherapeutic agents since the early 1970's [1–5]. Their general mode of action involves interfering with DNA replication and RNA synthesis. Doxorubicin is a popular drug in this category of antibiotics, used to treat a variety of cancers including lymphoma, bladder, stomach, breast, prostate and several others [3]. Doxorubicin is made up of a tetrahydroxy-anthraquinone, a six-member duanosamine sugar with a hanging glycosyl moiety, essentially representing the structure of anthracycline antibiotics [6–9]. Doxorubicin has intrinsic fluorescence which serves as a valuable tool in research and imaging [2–5,10]. It has an emission signal at 595 nm upon excitation with a 470 nm laser. Binding of Doxorubicin with the cell results in the production of active oxygen species, especially hydroxyl radicals. This leads to a decline of mitochondrial oxidative phosphorylation [1,6,7]. Administering Doxorubicin via intravenous injections leads to several side effects associated with chemotherapeutic drugs. In addition, the production of free radicals leads to cardiotoxicity. The induced cardiotoxicity can be acute, usually manifesting within the first 2–3 days of administration. Doxorubicin cardiomyopathy once developed has poor prognosis and is frequently fatal, affecting nearly 11% of all patients [7,8]. In order to overcome systemic toxicity caused by drug administration, Doxorubicin can be administered instead as a molecular theranostic agent with targeted delivery to Scavenger receptors type B1 (SR-B1) overexpressed in tumors; by encapsulation in reconstituted high density lipoprotein (rHDL) nanoparticles. Recent research has indicated the possibility of using nanoparticles to avoid systemic toxicity and achieve targeted drug delivery [8,9,11–15]. Thus, using nanotechnology and chemistry, it is possible to reduce the systemic toxicity and produce targeted drug delivery, and track these changes using fluorescence. However, this research on Doxorubicin encapsulation and target-specific delivery using nanoparticles accounts for less than 2% of total literature published on Doxorubicin [8]. It is necessary to characterize the fluorescence properties of Doxorubicin packed into nanoparticles to further optimize such preparations. Poly-vinyl alcohol (PVA) films mimic the rigid environment of nanoparticles and are more stable over time, providing a good alternative to photophysically characterize Doxorubicin as if it were packed within nanoparticles. In this study, we trapped Doxorubicin in PVA film, and compared its photophysical properties to Doxorubicin dissolved in PBS. We also calculated the quantum yield of the drug in PVA and PBS, using Rhodamine 101 as a reference.
2. Materials
2.1. Chemicals Used
All materials and chemicals used for the experiment were of analytical grade. Poly vinyl alcohol (PVA) (MW 130,000), Doxorubicin hydro-chloride (HPLC grade) and Rhodamine 101 (R101) were purchased from Sigma-Aldrich. The phosphate buffer saline (1×) was purchased from Thermo Fisher. (Richardson, TX.) Deionized water was used for dilutions. Plain microscope glass slides measuring 25 mm × 75 mm × 1 mm were purchased from Globe Scientific. (Paramus, NJ, USA) (Scheme 1).
Scheme 1.
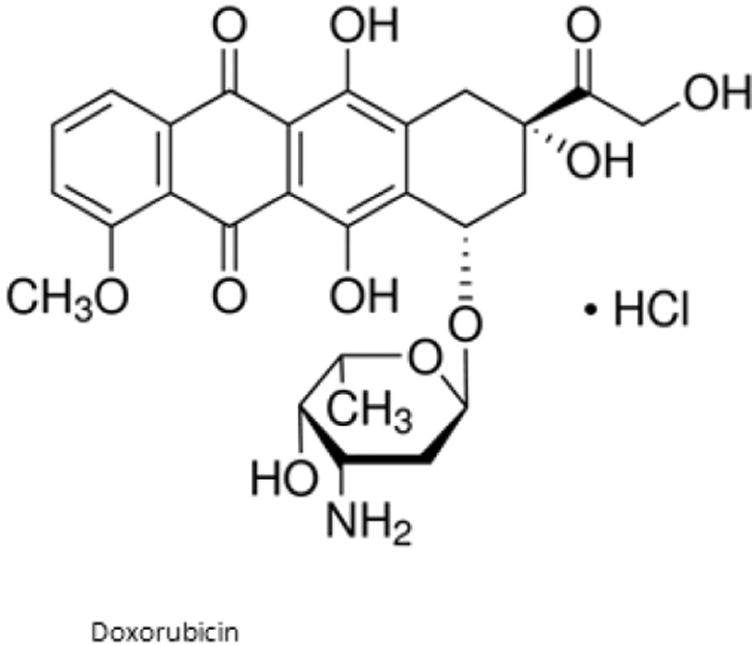
Chemical structure of Doxorubicin.
2.2. Preparation of Doxorubicin in PVA and PBS Samples
Twenty micro molar concentrations of Doxorubicin were prepared in PBS and PVA films. PBS samples were obtained by dissolving free Doxorubicin to attain target concentration. PBS-only was used as baseline reference for this sample. PVA contracts upon drying, leading to changes in its final volume. 20 ml of 10% (w/w) PVA with water contracts to a volume of 1.65 ml upon drying. Thus, the PVA film contracts almost 12 fold. 1.65 μM of free Doxorubicin was added to 20 ml of PVA solution to obtain a final concentration of 20μM in the dried PVA film. A blank PVA film with no drug added was also prepared from the same PVA stock in order to obtain PVA background as a baseline reference.
3. Methods
3.1. Steady-state Measurements
Absorption spectra were collected on Cary 50 bio UV–visible spectrophotometer. (Varian Inc., Australia). Doxorubicin dissolved in PBS was measured in 1 cm × 1 cm cuvette and in PVA film was measured by placing the film directly in front of the detector at room temperature.
Steady-state fluorescence measurements were collected on Cary Eclipse Spectrofluorometer. (Varian Inc., Australia). All measurements were collected at room temperature. The fluorescence spectrum for Doxorubicin in PBS was collected using square geometry set-up. A custom built front face attachment was used to measure emission spectrum of Doxorubicin in PVA film (Scheme 2).
Scheme 2.
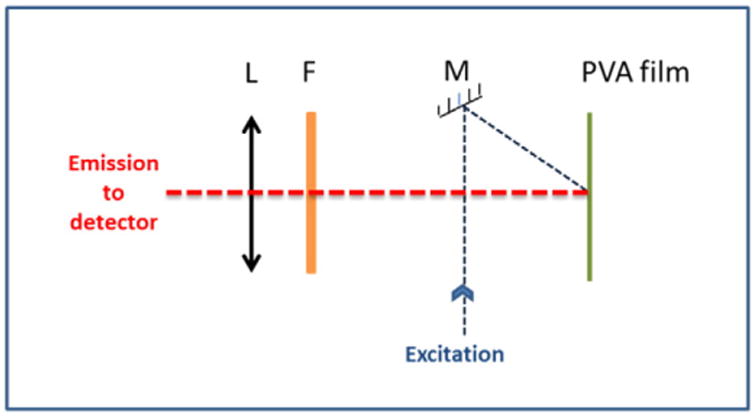
Front face geometry set-up for steady-state measurements of Doxorubicin trapped in PVA film.
The samples were excited at 490 nm and their emission was observed from 500 nm–800 nm, using a 495 nm long pass filter on the observation side. Excitation spectra were collected by scanning the samples from 350 to 590 nm with the emission observation set at 595 nm. Steady-state anisotropy measurements were done using manual polarizers for the excitation and emission. The anisotropy was calculated using the following formula:
| (1) |
where, r is the measured anisotropy, IVV is the fluorescence intensity measured with vertically oriented polarizers on both the excitation and observation, IVH is the fluorescence intensity measured with vertically oriented polarizer on excitation and horizontal polarizer orientation on the observation. G is the instrument correction factor.
Quantum yields of free Doxorubicin were determined in PBS and PVA with using R101 as the reference [16]; using the following formula:
| (2) |
where, QR is the quantum yield of reference fluorophore (R101), IS and IR represent the total emission intensity of sample (free Doxorubicin) and reference fluorophore (R101). 1 – 10-O.D. is the absorption correction for both sample and reference fluorophore at the excitation wavelength (475 nm) and n2 is the refractive index of the solvents (PBS and PVA).
3.2. Time-resolved Measurements
Fluotime 200 (Picoquant, Berlin, Germany) was used to measure the fluorescence lifetime and time-resolved anisotropy of Doxorubicin in PBS and PVA. Time resolved measurements were collected using a front-face set-up for both samples. The fluorometer is equipped with an ultrafast detector from Hamamatsu, Inc. A 470 nm laser diode was used as the excitation source, and the emission observed at 600 nm, with both vertical and horizontal polarizer orientations on the observation. These measurements were done at room temperature.
The fluorescence lifetimes were measured in magic angle conditions, and the data was analyzed using Fluofit3 program using a multi-exponential fitting model:
| (3) |
where, αi is the amplitude of decay of the ith component at time t, and τi is the average decay time of the fluorophore. In the case of multi-exponential decay, the mean lifetime is given by,
| (4) |
where,
| (5) |
The anisotropy decays were analyzed using a single-exponential fitting model using the Fluofit3 program using the following equation:
| (6) |
where, r0 is the anisotropy at t = 0, and ϕ is the rotational correlational time of the fluorophore.
4. Results and Discussion
4.1. Steady-state Measurements
Absorption spectra of Doxorubicin in both, PBS and PVA film, are located in a visible spectral region with maximum of about 500 nm (Fig. 1). In PVA film a vibronic structure of the spectrum is slightly more visible than in PBS.
Fig. 1.
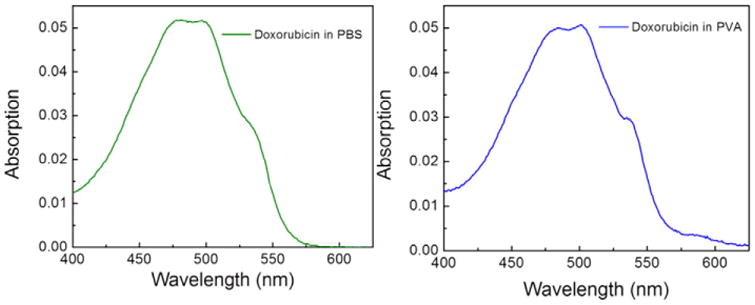
Absorption spectra of Doxorubicin in PBS buffer (left) and PVA film (right).
This is even more pronounced in fluorescence spectra (Fig. 2). In the case of PVA film the emission spectrum of Doxorubicin is nicely structured with peaks at 550, 600, 640 and 690 nm.
Fig. 2.
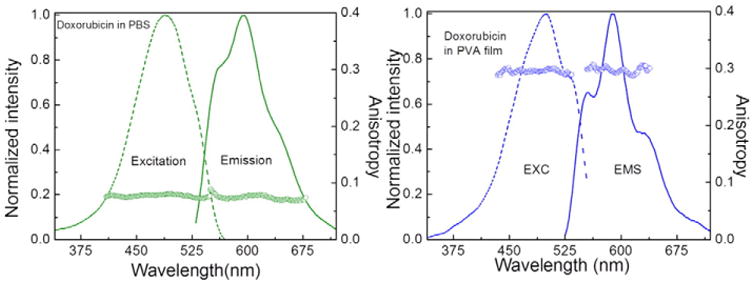
Excitation and fluorescence spectra of Doxorubicin in PBS buffer (left) and PVA film (right). Also shown are excitation and emission anisotropies. The fluorescence excitation spectra were measured at 600 nm observation and fluorescence emission spectra were excited at 500 nm.
Steady-state fluorescence anisotropies of Doxorubicin differ significantly in PBS and PVA film. While in PBS the anisotropy is rather low, about 0.07, in PVA film is high, about 0.3. The fluorescence excitation an-isotropy is constant over entire long wavelength absorption/excitation band which suggests that a single transition moment is responsible for the absorption.
Although fluorescence of Doxorubicin is easily detectible at micro-molar concentrations, its brightness is about an order of magnitude lower than rhodamine's. We compared fluorescence efficiencies of Doxorubicin and rhodamine 101 (Fig. 3). Rhodamine 101 fluorescence well overlaps emission of Doxorubicin. R101 is also known to have a fluorescence quantum yield close to 1. Using R101 as a reference [16], we calculated the quantum yield of free Doxorubicin to be 4.39% in PBS and 10.6% in PVA film.
Fig. 3.
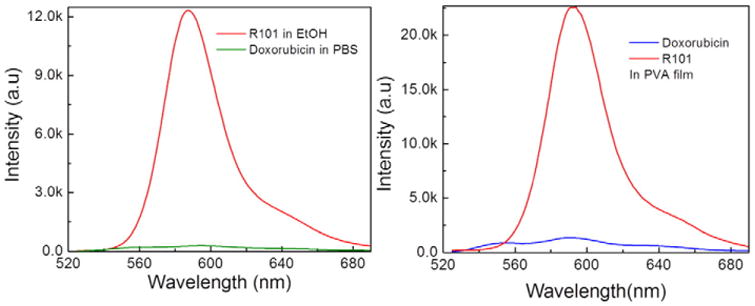
Comparison of Doxorubicin and Rhodamine 101 emission spectra at 500 nm excitation. Left: in PBS buffer; Right: in PVA films. The spectra were corrected for the amount of absorbed light, see Eq. (2).
4.2. Time-resolved Measurements
Fluorescence intensity decay of Doxorubicin in PBS buffer can be satisfactory approximated with a single exponent model with a lifetime of 1.01 ns. In PVA matrix the Doxorubicin lifetime is about twice longer and two exponents (1.61 ns & 3.26 ns with amplitudes 0.873 & 0.127, respectively) are needed to fit the decay data (Fig. 4).
Fig. 4.
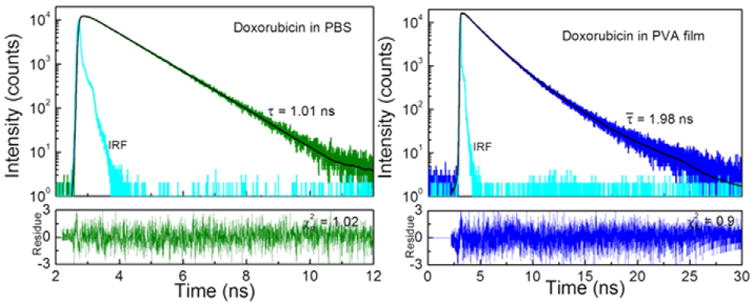
Fluorescence intensity decays of Doxorubicin in PBS buffer (left) and PVA film (right). In the case of PVA film Doxorubicin fluorescence intensity decay requires two exponents in order to fit the data.
Fluorescence anisotropy decays are distinctly different in PBS buffer and PVA (Fig. 5). In PBS buffer Doxorubicin molecules rotate fast with a correlation time of about 300 ps while in PVA film they are practically fully immobilized.
Fig. 5.
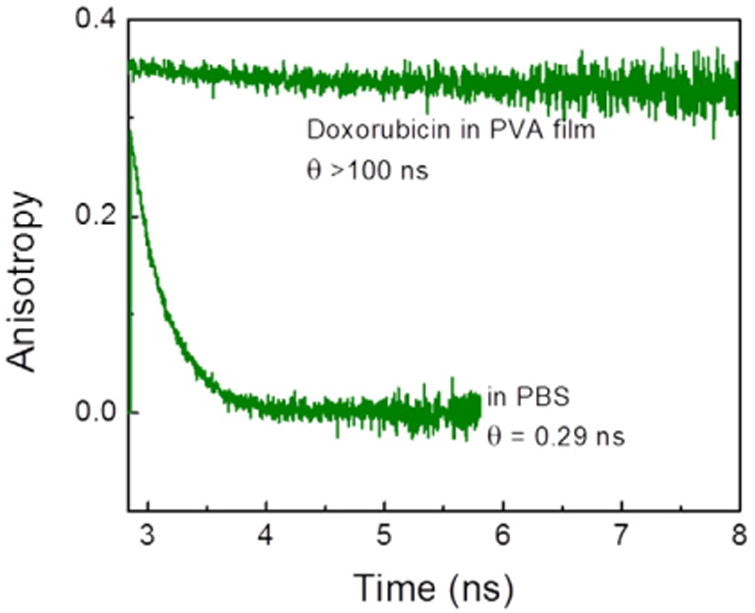
Fluorescence anisotropy decays of Doxorubicin in PBS buffer and PVA film. The measurements were done at room temperature, using a 470 nm laser diode for excitation.
5. Conclusions
Doxorubicin fluorescence appears in visible spectral region and can be efficiently excited with blue or green light sources.
However, the quantum efficiency of Doxorubicin is below 10%. The question arises what is a realistic detection limit of the drug with commercial instruments? In order to test the detection limit of Doxorubicin in PBS buffer we prepared series of diluted solutions of the drug. Fluorescence spectra of diluted Doxorubicin are presented on Fig. 6. We used maximum allowed voltage on the spectrofluorometer and maximum (20 nm) slits. As seen from the Fig. 6, single nanomolar concentrations are readily detectible despite of the Raman (black line) scattering. Of course, using stronger laser excitation one can easily measure sub-nanomolar concentrations of Doxorubicin PBS solutions.
Fig. 6.
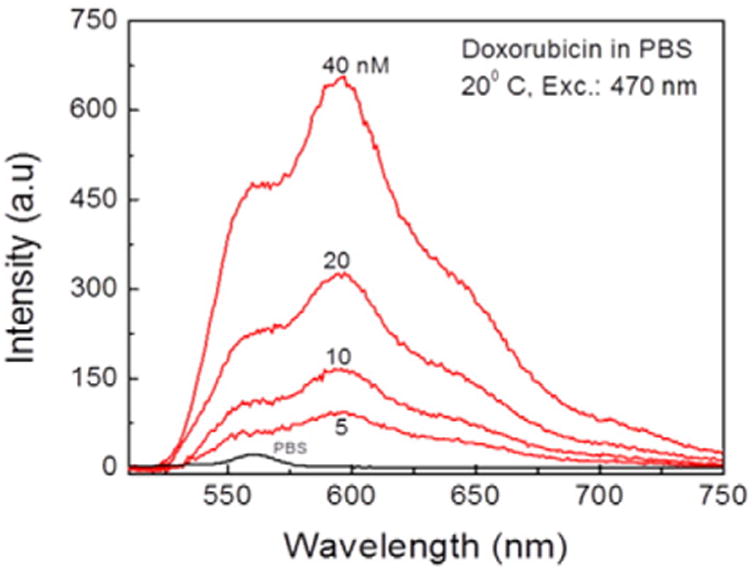
Fluorescence detectability limit of Doxorubicin in PBS buffer. Measurements were performed in 1 cm × 1 cm cuvette at room temperature. The samples were excited at 470 nm.
Fluorescence properties of Doxorubicin change upon immobilization in PVA matrix. The vibronic structure of the spectra becomes more pronounced. In a rigid PVA matrix Doxorubicin fluorescence is brighter than in buffer solution. The quantum yield increases approximately two-fold. Similarly, a fluorescence lifetime in PVA is twice longer than in the buffer. Also, fluorescence anisotropies differ significantly. Steady-state fluorescence anisotropy increases more than 5-fold and an anisotropy decay shows lack of molecular rotations. We believe that these differences will be helpful in the detection of doxorubicin release from densely packed polymeric nanoparticles or liposomes. For example, the observed fluorescence anisotropy has additive properties and is equal to the sum of fractional anisotropies. Therefore the fractions of the released/unreleased amounts of the drug can be easily calculated.
Acknowledgments
This work was supported by the NSF grant CBET-1264608 (I.G), and Cancer Prevention and Research Institute of Texas grant DP150091 (AGL).
References
- 1.Changenet-Barret P, Gustavsson T, Markovitsi D, Manet I, Monti S. Unravelling molecular mechanisms in the fluorescence spectra of doxorubicin in aqueous solution by femtosecond fluorescence spectroscopy. Phys Chem Chem Phys. 2013;15(8):2937–2944. doi: 10.1039/c2cp44056c. [DOI] [PubMed] [Google Scholar]
- 2.Karukstis KK, Thompson EH, Whiles JA, Rosenfeld RJ. Deciphering the fluorescence signature of daunomycin and doxorubicin. Biophys Chem. 1998;73(3):249–263. doi: 10.1016/s0301-4622(98)00150-1. [DOI] [PubMed] [Google Scholar]
- 3.Chen N, Wu C, Chung C, et al. Correction: probing the dynamics of doxorubicin-DNA intercalation during the initial activation of apoptosis by fluorescence lifetime imaging microscopy (FLIM) PLoS One. 2012;7(11) doi: 10.1371/journal.pone.0044947. [DOI] [PMC free article] [PubMed] [Google Scholar]
- 4.Motlagh NSH, Parvin P, Ghasemi F, Atyabi F. Fluorescence properties of several chemotherapy drugs: doxorubicin, paclitaxel and bleomycin. Biomed Opt Express. 2016;7(6):2400–2406. doi: 10.1364/BOE.7.002400. [DOI] [PMC free article] [PubMed] [Google Scholar]
- 5.Duray PH, Cuono CB, Madri JA. Demonstration of cutaneous doxorubicin extravasation by rhodamine-filtered fluorescence microscopy. J Surg Oncol. 1986;31(1):21–25. doi: 10.1002/jso.2930310104. [DOI] [PubMed] [Google Scholar]
- 6.Mohan P, Rapoport N. Doxorubicin as a molecular nanotheranostic agent: effect of doxorubicin encapsulation in micelles or nanoemulsions on the ultrasound-mediated intracellular delivery and nuclear trafficking. Mol Pharm. 2010;7(6):1959–1973. doi: 10.1021/mp100269f. [DOI] [PMC free article] [PubMed] [Google Scholar]
- 7.Shaikh AY, Shih JA. Chemotherapy-induced cardiotoxicity. Curr Heart Fail Rep. 2012;9(2):117–127. doi: 10.1007/s11897-012-0083-y. [DOI] [PubMed] [Google Scholar]
- 8.Chatterjee K, Zhang J, Honbo N, Karliner JS. Doxorubicin cardiomyopathy. Cardiology. 2010;115(2):155–162. doi: 10.1159/000265166. http://dx.doi.org/10.1159/000265166. [DOI] [PMC free article] [PubMed] [Google Scholar]
- 9.Lacko AG, Nair M, Paranjape S, Johnson S, McConathy WJ. High density lipoprotein complexes as delivery vehicles for anticancer drugs. Anticancer Res. 2002;22(4):2045–2050. [PubMed] [Google Scholar]
- 10.Lankelma J, Dekker H, Luque FR, et al. Doxorubicin gradients in human breast cancer. Clin Cancer Res. 1999;5(7):1703–1707. [PubMed] [Google Scholar]
- 11.Lacko AG, Sabnis NA, Nagarajan B, McConathy WJ. HDL as a drug and nucleic acid delivery vehicle. Front Pharmacol. 2015;6 doi: 10.3389/fphar.2015.00247. [DOI] [PMC free article] [PubMed] [Google Scholar]
- 12.Sabnis N, Pratap S, Akopova I, Bowman PW, Lacko AG. Pre-clinical evaluation of rHDL encapsulated retinoids for the treatment of neuroblastoma. Front Pediatr. 2013;1(6) doi: 10.3389/fped.2013.00006. [DOI] [PMC free article] [PubMed] [Google Scholar]
- 13.Kokate RA, Thamake SI, Chaudhary P, et al. Enhancement of anti-tumor effect of particulate vaccine delivery system by ‘bacteriomimetic’ CpG functionalization of poly-lactic-co-glycolic acid nanoparticles. Nanomedicine. 2015;10(6):915–929. doi: 10.2217/nnm.14.144. [DOI] [PMC free article] [PubMed] [Google Scholar]
- 14.Kokate RA, Chaudhary P, Sun X, et al. Rationalizing the use of functionalized polylactic-co-glycolic acid nanoparticles for dendritic cell-based targeted anticancer therapy. Nanomedicine. 2016;11(5):479–494. doi: 10.2217/nnm.15.213. [DOI] [PMC free article] [PubMed] [Google Scholar]
- 15.Wang F, Wang Y, Dou S, Xiong M, Sun T, Wang J. Doxorubicin-tethered responsive gold nanoparticles facilitate intracellular drug delivery for overcoming multi-drug resistance in cancer cells. ACS Nano. 2011;5(5):3679–3692. doi: 10.1021/nn200007z. [DOI] [PubMed] [Google Scholar]
- 16.Grabolle M, Spieles M, Lesnyak V, Gaponik N, Eychmüller A, Resch-Genger U. Determination of the fluorescence quantum yield of quantum dots: suitable procedures and achievable uncertainties. Anal Chem. 2009;81(15):6285–6294. [Google Scholar]


