Abstract
We present a 3D tomography technique for in vivo observation of microscopic samples. The method combines flow in a microfluidic channel, illumination through a slit aperture, and a Fourier lens for simultaneous acquisition of multiple perspective angles in the phase-space domain. The technique is non-invasive and naturally robust to parasitic sample motion. 3D absorption is retrieved using standard back-projection algorithms, here a limited-domain inverse radon transform. Simultaneously, 3D differential phase contrast images are obtained by computational refocusing and comparison of complementary illumination angles. We implement the technique on a modified glass slide which can be mounted directly on existing optical microscopes. We demonstrate both amplitude and phase tomography on live, freely swimming C. elegans nematodes.
Microfluidic devices have recently provided significant improvements to the field of microscopy. The liquid environment is biocompatible and well adapted for in vivo experiments, while the flow facilitates high throughput, automated sorting,1 and manipulation of samples. In parallel, optical techniques have been developed to integrate imaging and object motion.2 Early devices used the object displacement for improved in-plane resolution, such as sub-pixel shifting for high-resolution microscopy,3 phase shifting for structured illumination microscopy,4 and sequential spectroscopy.5 Three-dimensional imaging has also been performed, e.g. using lens-free holography6 and tomography7 methods, but these examples used the flow only for throughput (the lack of a lens also limits the optical capabilities of the system). More recent attempts have combined lenses with out-of-plane channel tilting to obtain depth control, e.g. for 3D imaging via focal stacks8 and phase recovery using transport-of-intensity methods,9 but the tilt introduces engineering trade-offs between phase and amplitude sensitivity. Here, we introduce a lens-based, flow-scanning tomography technique capable of recording both amplitude and phase that overcomes many of the resolution, throughput, and sensitivity issues of previous attempts.
The method is best understood as a sampling of the four-dimensional phase space {x,y,kx,ky} of spatial position {x,y} and spatial frequency (ray angle) {kx,ky}. Recording this 4D light-field information requires more advanced methods than traditional imaging, such as scanning Fourier windows,10 wavefront sensors,11 or light-field cameras,12 but the reward is local spatial–spectral information that allows for local coherence, tomography, and digital refocusing.13 Here, image acquisition relies on a microfluidic device that combines an illumination source, shaped by a slit aperture along the (y) axis, and a cylindrical lens to collect the light passing through the sample. When placed in an optical microscope, the device combines simultaneous views of the slit aperture for a broad range of perspective angles into a single phase-space image {y,kx} to be recorded by the video camera. As the object flows through the microfluidic channel past the slit aperture, motion allows line-by-line scanning along the (x) axis.
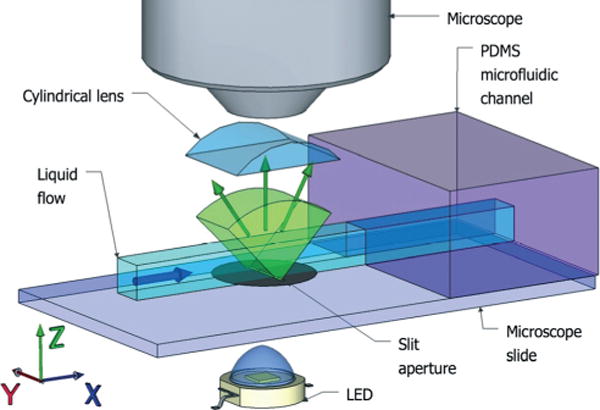
The experimental setup is shown in Fig. 1. A white LED light source provides a uniform illumination given by I(x,y,θx,θy) = I0 which is restricted by the slit aperture I(|x| > 0.5 μm) = 0. The stage is positioned at the focal plane of an optical microscope, in this case an f = 2 mm objective with numerical aperture NA = 0.70. The large working distance of the objective (6 mm) leaves enough space for an additional cylindrical lens, which we place at a focal distance (f = 2 mm) from the slit aperture. With this 1D optical Fourier transform, the angular spectrum kx is recorded for each point y illuminated by the slit. The result is a continuous range of perspective angles for projection tomography, given by , where n is the refractive index of the flowing fluid. In the experiments below, we use a buffer solution for in vivo experiments with C. elegans, with n ≈ 1.33.
Fig. 1.

Experimental device. A microfluidic channel is illuminated through a 1 μm wide slit aperture along the (y) axis. A cylindrical lens in a Fourier imaging configuration converts the transmitted light beam into a phase-space image {y,kx}. Sample flow in the channel provides scanning along x. All components are assembled onto a standard microscope slide to be used directly in a microscope.
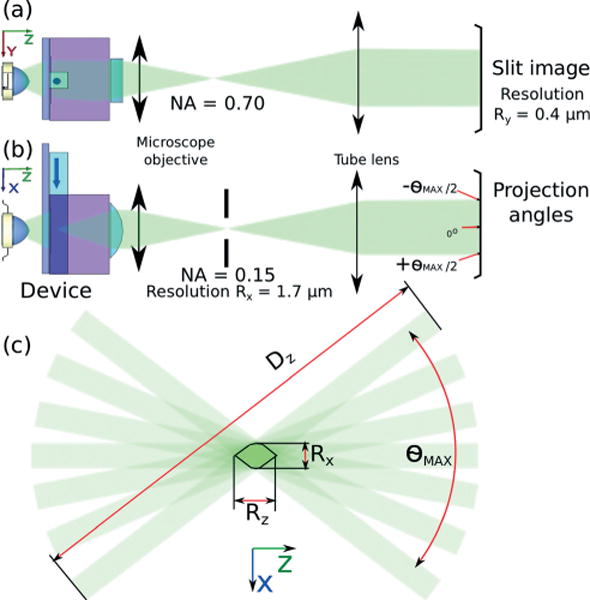
Fig. 2 shows the full optical path from source to detector. In the (y,z) plane, the objective projects an image of the 100 μm wide microfluidic channel cross-section onto the camera with a 50× magnification. The optical resolution is limited by the numerical aperture of the microscope objective and is given by:
| (1) |
where λ is the characteristic wavelength of the imaging system (here, λ = 500 nm). In the (x,z) plane, the Fourier lens and microscope objective separate the continuous range of perspective views of the slit along the other axis of the camera. An adjustable slit aperture reduces the numerical aperture to NAx = 0.15. The optical resolution limit along the slit axis is thus given by:
| (2) |
Fig. 2.

Optical geometry of the device (a) – The device is placed at the focal plane of an optical microscope with a video camera for data acquisition. (b) – A slit aperture along the optical path is used to control the depth of field of the acquired optical projections by reducing the numerical aperture to NAx = 0.15, a required trade-off between focal depth and resolution. (c) – The resolution Rz along the (z) axis corresponds to the size of the domain intersecting all optical projections in the angular range given by θMAX.
The resolution along the (z) axis corresponds to the geometrical limitations of the projection area shown in Fig. 2(c) and is given by
| (3) |
The associated depth of field, required to obtain 3D information for stack reconstruction, is given by μm. In the simple case demonstrated here, the limitation of the NA along this axis is a trade-off between depth of field and resolution:
| (4) |
We note, however, that additional computational methods are possible to overcome this relation.14
For 3D imaging, it is important that Dz covers the entire depth of the sample. This corresponds to a specific aperture NAx and resolution Rx along the (x) axis. For a constant flow velocity V and frame rate 1/T fps, the sample displacement between two consecutive frames is |δx| = TV. Here, we take 100 fps and adjust V so that |δx| ≈ Rx, i.e. we take the fastest image acquisition times to obtain the maximal resolution.
The most straightforward imaging modality of the device is 3D absorption tomography.15 As the sample flows in the channel, we record N consecutive frames: Ij(kx,y), j = 1…N. The raw data is then reassembled into the angular projection domain Pθ, given by
| (5) |
Pθ contains (x,y) views of the flowing sample for 50 different values of the projection angle |θx| < θMAX/2. Because each frame contains simultaneous perspective views of the slit aperture, all projected views are already aligned and therefore marginally affected by long-range sample motion. The spatial distribution of absorption S(x,y,z) is computed with tomographic back-projection algorithms, here an inverse radon transform, by applying the Fourier Slice Theorem to :
| (6) |
The 3D structure is then given by
| (7) |
Another imaging modality, simultaneously obtained with the first, is 3D differential phase contrast (DPC) tomography. Starting from the angular projection domain Pθ, we first conduct a digital refocusing step16 by gradually shifting all perspective views as if the intersection of all projection directions were displaced along the optical axis by a depth z from the center of the channel. These virtually defocused perspective views are given by
| (8) |
An individual DPC tomogram17 at focal depth z is given by
| (9) |
where the left and right intensity projections are given by
| (10) |
Both Δϕ and S are derived from the same set of projection views {Pθ}. Consequently, the two imaging modalities yield perfectly superimposed tomograms containing phase (quantitative with suitable calibration) and intensity. These datasets are complementary and represent the real and imaginary parts of the refractive index.18 This alignment also provides a strong foundation for other methods of phase retrieval, e.g. for initial conditions in nonlinear methods19 or to remove ambiguities in reconstruction,20 and does not suffer from possible artifacts present in coherent methods, e.g. speckle and sensitivity to interference jitter.
As a representative application of flow-scanning tomography, we demonstrate 3D imaging of a live C. elegans nematode. An XX hermaphrodite is raised at room temperature to the adult stage of development, using standard techniques,21 and placed into a water-based liquid environment with balanced electrolytes (M9 buffer solution). Significantly, the nematode is freely swimming in the channel; there is no anesthetic to slow/stop the C. elegans or other means of pinning it in place. Motion along the (y,z) directions is limited by the boundaries of the microfluidic channel but can also be accounted for by preprocessing data and cancelling with digital frame alignment techniques. The experimental device uses a 100 μm-deep, 100 μm-wide microfluidic channel that is designed for the characteristic size of adult C. elegans. Flow-controlled sample displacements are obtained with a 5 μL precision syringe driven by a constant-speed syringe pump. A low flow speed, 10 nL s−1, was chosen to provide the best compromise between the available frame rate of the camera and the desired resolution.
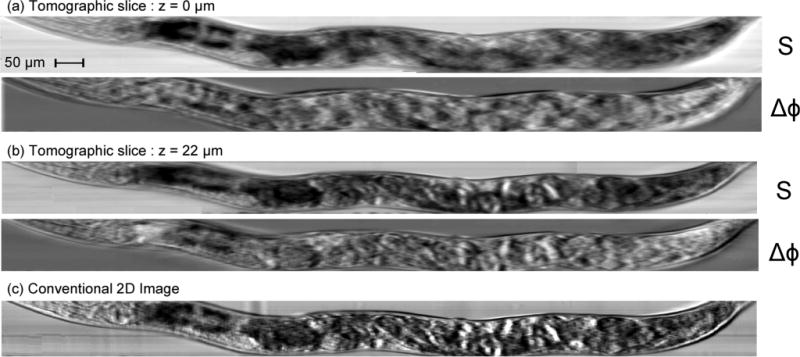
Experimental results for 3D amplitude and phase contrast tomography are shown in Fig. 3. Fig. 3(a) and (b) are digital slices of the retrieved 3D tomogram at two z-levels of interest (z = 0 μm and z = 22 μm). At each depth level, we demonstrate the versatility of the system and show two images on the nematode: absorption from optical projection tomography (S), and difference phase-contrast tomography (Δϕ). In the reference frame z = 0 μm, absorption tomographic slices (S) show the pharynx and its two bulbs on the left side (head), as well as the reproductive system, with a clear view of the eggs in the center part of the body. At a different depth (z = 22 μm), the digestive system is clearly apparent, with the intestine and distal gonad particularly visible. Differential phase contrast is well adapted to the observation of interfaces between layers of different refractive index. In the case of nearly transparent live roundworms, the DPC tomographic slices (Δϕ) enable the observation of a different selection of eggs and shows eggs that could not be observed clearly with absorption images at the level of the digestive system (z = 22 μm). By comparison, images taken with a conventional optical microscope are shown in Fig. 3(c); all the structures previously identified overlap in one single image, and it becomes much harder to identify them. In addition, it is also impossible to establish their respective positions along the optical axis or to accurately characterize, let alone quantify, their respective shapes and sizes. In an online movie (media 1),† we display absorption and phase contrast tomographic reconstructions for depth levels ranging from z = 0 μm to z = 50 μm.
Fig. 3.

Experimental results on live, freely swimming, adult wild type C. elegans nematodes. Displayed are absorption S and differential phase contrast Δϕ tomographic images for two different depth levels (a, z = 0 μm and b, z = 22 μm). Tomographic images show the precise (x,y,z) location of the reproductive system with eggs (a), and of the digestive system (intestine), the cuticle and oblique somatic muscle fibers (b). In a conventional white light microscopy device (c), these internal features overlap on the same image, making it nearly impossible to identify and characterize them.
In conclusion, we have developed a 3D tomographic imaging device based on the combination of 1D flow and 2D recording of space-angle phase space. The device is an integrated microscope slide that is biocompatible with aqueous samples and capable of high sample throughput. The imaging is marker-free, non-interferometric, robust to large-scale sample motion, and capable of simultaneous amplitude and phase recording. Since both imaging modalities are derived from the same data set, the phase and intensity tomographic images are perfectly superimposed. As a proof of principle, we demonstrated the system capabilities by performing tomography on live, freely swimming C. elegans nematodes. However, it is straightforward to scale the system down for individual cells and up for larger-sized animals, to be implemented easily on existing microscopes, flow cytometers, and aquatic imagers.
Supplementary Material
Acknowledgments
The authors are grateful to their collaborators from the Complex Fluids Group at Princeton University.
Footnotes
Electronic supplementary information (ESI) available. See DOI: 10.1039/c4lc00701h
References
- 1.Tsai SS, Griffiths IM, Stone HA. Lab Chip. 2011;11:2577–2582. doi: 10.1039/c1lc20153k. [DOI] [PubMed] [Google Scholar]
- 2.Heng X, Erickson D, Baugh LR, Yaqoob Z, Sternberg PW, Psaltis D, Yang C. Lab Chip. 2006;6:1274–1276. doi: 10.1039/b604676b. [DOI] [PubMed] [Google Scholar]
- 3.Pang S, Han C, Lee LM, Yang C. Lab Chip. 2011;11:3698–3702. doi: 10.1039/c1lc20654k. [DOI] [PMC free article] [PubMed] [Google Scholar]
- 4.Lu CH, Pégard NC, Fleischer JW. Appl Phys Lett. 2013;102:161115. [Google Scholar]
- 5.Golan L, Yeheskely-Hayon D, Minai L, Dann EJ, Yelin D. Biomed Opt Express. 2012;3:1455. doi: 10.1364/BOE.3.001455. [DOI] [PMC free article] [PubMed] [Google Scholar]
- 6.Bishara W, Zhu H, Ozcan A. Opt Express. 2010;18:27499. doi: 10.1364/OE.18.027499. [DOI] [PMC free article] [PubMed] [Google Scholar]
- 7.Isikman SO, Bishara W, Mavandadi S, Frank WY, Feng S, Lau R, Ozcan A. Proc Natl Acad Sci U S A. 2011;108:7296–7301. doi: 10.1073/pnas.1015638108. [DOI] [PMC free article] [PubMed] [Google Scholar]
- 8.Pégard NC, Fleischer JW. J Biomed Opt. 2013;18:040503–040503. doi: 10.1117/1.JBO.18.4.040503. [DOI] [PubMed] [Google Scholar]
- 9.Gorthi SS, Schonbrun E. Opt Lett. 2012;37:707–709. doi: 10.1364/OL.37.000707. [DOI] [PubMed] [Google Scholar]
- 10.Waller L, Situ G, Fleischer JW. Nat Photonics. 2012;6:474–479. [Google Scholar]
- 11.Schafer B, Mann K. Determination of beam parameters and coherence properties of laser radiation by use of an extended Hartmann–Shack wave-front sensor. Appl Opt. 2002;41:2809–2817. doi: 10.1364/ao.41.002809. [DOI] [PubMed] [Google Scholar]
- 12.Lu C-H, Muenzel S, Fleischer JW. High-resolution light-field microscopy. Computational Optical Sensing and Imaging, Optical Society of America. 2013 [Google Scholar]
- 13.Ng R, Levoy M, Brédif M, Duval G, Horowitz M, Hanrahan P. Computer Science Technical Report CSTR. 2005;2:1–11. [Google Scholar]
- 14.Forster B, Van De Ville D, Berent J, Sage D, Unser M. Microsc Res Tech. 2004;65:33–42. doi: 10.1002/jemt.20092. [DOI] [PubMed] [Google Scholar]
- 15.Defrise M, De Mol C. J Mod Opt. 1983;30:403–408. [Google Scholar]
- 16.Tian L, Wang J, Waller L. Opt Lett. 2014;39:1326–1329. doi: 10.1364/OL.39.001326. [DOI] [PubMed] [Google Scholar]
- 17.Hamilton D, Sheppard C. J Microsc. 1984;133:27–39. [Google Scholar]
- 18.Arnison MR, Larkin KG, Sheppard CJ, Smith NI, Cogswell CJ. J Microsc. 2004;214:7–12. doi: 10.1111/j.0022-2720.2004.01293.x. [DOI] [PubMed] [Google Scholar]
- 19.Lu C-H, Barsi C, Williams MO, Kuts JN, Fleischer JW. Phase retrieval using nonlinear diversity. Appl Opt. 2013;52:D92. doi: 10.1364/AO.52.000D92. [DOI] [PubMed] [Google Scholar]
- 20.Seldin JH, Fienup JR. J Opt Soc Am A. 1990;7:412–427. [Google Scholar]
- 21.Stiernagle T. C elegans: A practical approach. 1999:51–67. [Google Scholar]
Associated Data
This section collects any data citations, data availability statements, or supplementary materials included in this article.


