

Abstract
Motivation
Viruses rapidly evolve due to their error-prone genome replication, and identifying which mutations are selected for during evolution is critical for virus surveillance efforts. Here we introduce a scatter plot tool (AAScatterPlot) that easily shows the selection and avoidance of certain protein mutations based on biochemical properties. We demonstrate its utility for monitoring the evolution of H9 avian influenza viruses from China between 2005 and 2015, particularly at the hemagglutinin (HA) proteolytic cleavage site (PCS) that can affect virus activation and pathogenicity.
Results
Given genome sequences, the AAScatterPlot tool compacts into a single plot, information about the hydropathy index, Van der Waals volume, chemical property and occurrence frequency of amino acid residues. The tool also shows the range of residues that could arise from a single point mutation in the genome, which can then be compared against the observed residues to identify mutation constraints. Through this approach, we found that the 2nd position towards the N-terminus side of the HA PCS (P2 position) avoided hydrophobic residues, whereas the P3 position avoided hydrophilic residues.
Availability and Implementation
AAScatterPlot is available at https://github.com/WhittakerLab/AAScatterPlot.
Contact
gary.whittaker@cornell.edu
Supplementary information
Supplementary data are available at Bioinformatics online.
1 Introduction
A large part of virus surveillance research entails identifying protein mutations that correlate with the severity of viral pathogenesis (Munster et al., 2010; Rumschlag-Booms et al., 2009; Soda et al., 2011; Sun et al., 2013). Viral genomic data are initially viewed via sequence logos (Colaert et al., 2009; Crooks et al., 2004; Schneider and Stephens, 1990), phylogeny trees (Tamura et al., 2007) and antigenic cartography maps (Cai et al., 2010; Smith et al., 2004), in which once a mutation pattern is identified, then more advanced pattern-recognition algorithms can be developed (e.g. BLSOM (Iwasaki et al., 2013)). However, the aforementioned tools were not designed to show the mutation patterns based on protein biochemical properties. Instead, logos are used to identify consensus residues, phylogenetic trees are used to infer evolutionary distances between sequences, and antigenic cartography maps are used to show antigenic differences. We therefore developed the AAScatterPlot tool to provide easy visualization capabilities of amino acid (AA) properties, such as Van der Waals volume (VdWV), hydropathy index (HPI), chemical property and frequency of occurrence. We extended its feature to show the AA residues that could arise from a nucleotide point mutation, which we found to be useful for tracking virus evolution.
We demonstrate the utility of the AAScatterPlot tool for showing mutation constraints and rare but notable mutations found in the hemagglutinin (HA) proteolytic cleavage site (PCS) of the H9 avian influenza viruses (AIVs). There are 18 HA subtypes in nature, with H1-H16 circulating in wild birds. Presently, the H9 subtype is circulating widely in avian species (Xu et al., 2007) and is undergoing heavy surveillance due to both the ongoing infection of poultry (Lee et al., 2007) and the potential to infect humans (Butt et al., 2005; Lin et al., 2000; Peiris et al., 1999). The HA proteins on the surface of influenza viruses are monitored closely due to their roles in targeting host cells and mediating the membrane fusion process that is required for viral infection (Skehel and Wiley, 2000). HA must be activated by host proteases that cleave the PCS located between the receptor binding domain and the fusion domain (Skehel and Wiley, 2000; Steinhauer, 1999), and mutations that affect the HA activation process can also affect the viral pathogenicity (Munster et al., 2010; Steinhauer, 1999). One example of this is the A/WSN/33 (H1N1) mouse-adapted virus which utilizes plasmin for cleavage-activation (Lazarowitz and Choppin, 1975). While mutations in the neuraminidase (NA) gene allow sequestration of plasminogen that enhance the HA activation and neurovirulence (Goto et al., 2001), an S-Y substitution in the PCS also allow efficient HA activation by plasmin and infection in mice brains (Sun et al., 2010).
The PCS of most low-pathogenicity HA subtypes besides H9 consists of 1-2 non-consecutive basic amino acids and is recognized by a trypsin-like proteases (Horimoto and Kawaoka, 2001). However, it is well known that for H5 and H7 AIVs, the major differences between low-pathogenicity versus high-pathogenicity strains are that the latter contain inserted multi-basic residues near the PCS (e.g. RRRKKR) that can be cleaved by ubiquitous proteases such as furin (Horimoto and Kawaoka, 2001; Horimoto et al., 1994; Rumschlag-Booms et al., 2009; Stieneke-Gröber et al., 1992; Vey et al., 1992). Generally, AIVs that can be activated by ubiquitous proteases also caused systemic infection in hosts (Munster et al., 2010; Schrauwen et al., 2012).
The PCS of the predominantly circulating H9 subtypes is RSSR|, where ‘|’ marks the cleavage location. We define the residue positions relative to the cleavage site as such: PN-P2-P1 | P1’-P2’-PN’. The PCS of H9 viruses do not necessary need inserted residues to be cleaved by ubiquitous proteases. For instance, a point mutation at the P4 position couple with a short neuraminidase stalk length can increase the virus virulence in chickens and mice (Sun et al., 2013). Other studies have shown that H9 variants with an RSRR PCS sequence can be activated by matripases (Baron et al., 2013) and furin (Gohrbandt et al., 2011; Soda et al., 2011). Matriptases are found in the human lung, suggesting that variant H9 avian influenza viruses could potentially infect humans. Furin, on the other hand, is found in the Golgi apparatus of cells, which would allow progeny virions to be produced in the activated form.
While many studies regarding the H9 viruses discuss the site of frequent mutations (Wei et al., 2016) and predict geographical and evolutionary relationships among virus strains (Dalby and Iqbal, 2014; Jiang et al., 2012; Lewis et al., 2013), it is not clear what biochemical properties are selected for near the PCS. Analyzing the protein sequence for similarities is a straightforward strategy, which motivated us to develop this tool that shows the diversity of AA biochemical properties at each position. We were able to observe constraints to mutations during the evolution of the H9 PCS, and also identify mutants that may be of interest for more in-depth studies.
2 Materials and methods
2.1 Obtaining H9 genome sequences
RNA sequence of the H9 proteins were downloaded from the NCBI FLU database (www.ncbi.nlm.nig.gov/genomes/FLU) (Bao et al., 2008). The search filters used are as follows: Influenza Strain = A, Host of Isolation = Avian, Region of Isolation = China, Year of Collection = 01/01/2005 to 05/29/2015, hemagglutinin subtype = H9, neuraminidase subtype = Any and Sequence Length = Full. There are a total of 1493 unique sequences out of 2467 submitted sequences, which were saved in a FASTA file (Supplementary File S1). The AA residues of interest are located at positions 333–338, with the cleavage site located after 338th residue. Note that our AA position numbering is higher than those used by others because we include the 18-AA signal peptide, e.g. ‘MEAASLITILLVVTASNA’ in A/swine/Hong Kong/9/1998 (Burke and Smith, 2014), that is normally removed from the folded HA protein.
2.2 Drawing biophysical scatter plots
Scatter plots were drawn using the method as described by (Licitra et al., 2014), and their features are briefly explained here. The X-axis denotes the hydropathy index (HPI) (Kyte and Doolittle, 1982), and the Y-axis denotes the Van der Waals volume (VdWV) of amino acid residues (Richards, 1974). The area of the dots corresponds to the frequency of occurrence of a residue at a certain position. The color of the dots corresponds to special properties of the residue such as electrostatic charge. The color codes are as follows: green = polar neutral, blue = polar positive, red = polar negative, brown = unique (proline or glycine), teal = bonding (cysteine) and grey = non-polar aliphatic. The AAScatterPlot is coded in MATLAB (MathWorks), and the source codes and installation file are provided at https://github.com/WhittakerLab/AAScatterPlot.
2.3 Drawing the predicted residues from point mutations
The residues that could arise from a random point mutation in the codon were drawn as hollow circles overlaying the scatter plots. These predicted residue mutations were drawn per selected amino acid in the plot, and it included the silent mutations. The total area of all hollow circles was set arbitrarily, but the relative areas of the circles scaled with the degeneracy of obtaining the corresponding residue from a point mutation in the codon. The lack of observation of predicted residue mutations in a dataset would indicate an underlying selection pressure.
3 Results and discussion
3.1 Basic usage and features of the AAScatterPlot tool
The AAScatterPlot tool (Fig. 1) takes sequences files (fasta, csv or xlsx) and generates a scatter plot for each residue position. The tool prefers aligned and trimmed nucleotide sequences because these are required to generate the codon usage graph and to predict AA mutations. A basic sequence alignment and trimming tool is provided as well. Clicking on a scatter plot dot will draw black circles that mark the predicted amino acids that could arise from a random point mutation in the codon. A codon usage frequency chart is provided to show the abundance of degenerate codons within a dataset. A comparison of AA residues that could have arisen from a random mutation versus those that are actually present in a dataset helps to discern which mutations were selected for during evolution. A more quantitative selection pressure analysis can be done afterwards using specialized tools such as DIVAA (Rodi et al., 2004) or Datamonkey (Delport et al., 2010). However, we do not perform quantitative selection pressure analysis in this work mainly because we are using a public dataset in which the sampling bias is difficult to account for.
Fig. 1.
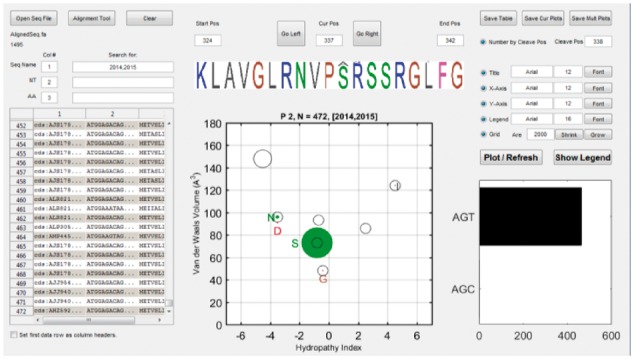
AAScatterPlot graphical user interface. The software makes it easy to peruse the properties of amino acids from aligned sequence files. Weblogos help to traverse sequence and identify consensus sequence. Scatter plots are drawn per position to investigate Van der Waals volume (VdWV, Y-axis) and Hydropathy Index (HPI, X-axis) for each protein residue position. Clicking on a solid dot will draw hollow circles that represent the predicted AA residues that could arise from a point mutation (an example is shown for the S residue). A codon usage frequency chart is also drawn to help track the distribution of degenerate codons within the dataset. Sequences can be filtered out using the Search box (example shows sequences that are collected from 2014 and 2015)
3.2 Tracking the evolution of HA proteolytic cleavage site
We used the AAScatterPlot to show the diversity of AA residues at the P6 to P1 positions of the PCS of H9 influenza viruses isolated from China between the year 2005 and 2015 (Fig. 2). Compared to the web logos, the scatter plots easily show the diversity of residue properties per each position and also the rare residues that are often hidden in logos. The P2 and P3 positions appear to show AA mutations being confined within a defined range of VdWV and HPI values (Fig. 2A). For instance, the P3 position appears to allow mutations towards more hydrophobic residues, whereas P2 position appears to allow mutations towards more hydrophilic residues. The P2 position also seems tolerant of large variations in biochemical properties, as observed by the occasional S, D, R and N residues. While these observations could be due to observation or sampling bias, these plots easily pinpoint which residues require further investigation.
Fig. 2.

Web logo and scatter plot representations of the HA protease cleavage site. (A) PCS sequence data for H9 AIVs isolated from China 2005 to 2015. The X-axis is HPI (unitless), and the Y-axis is VdWV (Å3). (B) Scatter plots for P2 position using all data from 2005 to 2015. Biochemical properties that appear to be unfavorable are marked by the ‘Avoided Region’. (C) Redrawn scatter plots for P2 for each year from 2010 to 2014
3.3 Using the predicted mutation plots to show restricted evolutionary paths
Interestingly, the P2 position contains sequences with D residues that diverge from the consensus S residue by 2 nucleotides. Viruses with P2 D normally belong to the Y439 lineage of viruses that have difficulty infecting pigs, whereas viruses from China with P2 S belong to the Y280 lineage of viruses that can infect pigs (Wang et al., 2016). Determining the potential pathways from P2 S to D, or vice versa, would enable researchers to identify important intermediate virus mutants that may switch host targets. Using our tool, we first looked at the predicted mutations of S and D from all years (Fig. 2B). Both seem to share either an N or a G intermediate, suggesting that either the S↔N↔D or S↔G↔D mutation pathway can occur.
To determine which of the two pathways between S and D is more likely, we filtered the data by year using the search features of the tool and redrew the plots (Fig. 2C). The yearly scatter plots for the P2 position show a persistent N residue appearing since 2010 forward. Therefore the S ↔ N ↔ D mutations would appear more probable than the S ↔ G ↔ D pathway. The lack of observation of other residues that were predicted for random mutations indicates that P2 residues are experiencing a selection pressure during virus evolution, assuming this is not caused by a sampling bias. The source of selection of a P2 N intermediate could either be due to viral factors (e.g. HA protein function) or host factors (e.g. host proteases).
To seek evidence that P2 D and P2 S virus strains can mutate towards a P2 N intermediate, we constructed a dendrogram of sequences with a P2 D, N, G or R, and also closely related sequences with P2 S. According to dendrogram in Figure 3, tight clusters can be seen with P2 S and N, and also with P2 D and N. These support the hypothesis that the transition between P2 S and D will most likely involve a P2 N intermediate.
Fig. 3.

Dendrogram of sequences with mutations at the P2 position. Sequences with a P2 R, D, G or N were extracted from the dataset, along with sequences with P2 S that were most similar to the extracted sequences. The leaf names consist of the PCS sequence from P6 to P1, followed by the virus name. Pair-wise Hamming distances were calculated for the reduced dataset using the full HA nucleotide sequences, and dendrograms were drawn with MATLAB using the nearest neighbor method. Some sequences with P2 D from Dongting were excluded to truncate the tree for viewing
3.4 Concluding remarks
We have demonstrated how our AA scatter plot tool can accelerate hypothesis generation pertaining to defining preferred AA mutations at specific protein sites, using the PCS of H9 influenza viruses as an example. The AAScatterPlot tool can also be applied to study other viruses that have variable-length sequences with the aid of our sequence alignment and search features. For the H9 viruses, the tool clearly shows the avoidance of hydrophobic residues at the P2 and hydrophilic residues at the P3 position. Furthermore, the tool readily shows mutation pathways that a virus can take to transition between a P2 S and D via an N. While the protease activity of viruses with P2 R mutations has already been measured (Baron et al., 2013; Gohrbandt et al., 2011; Soda et al., 2011), to our knowledge, the protease activity for viruses with the P2 D or N mutations have not been measured in depth and thus would be an interesting future study.
Supplementary Material
Acknowledgements
We thank Hung-Lun Hsu and Walter Iddings for help with troubleshooting and compiling the software.
Funding
This project has been funded in whole or in part with Federal funds from the National Institute of Allergy and Infectious Diseases, National Institutes of Health, Department of Health and Human Services, under Centers of Excellence for Influenza Research and Surveillance (CEIRS) Contract No. HHSN272201400005C.
Conflict of Interest: none declared.
References
- Bao Y. et al. (2008) The influenza virus resource at the national center for biotechnology information. J. Virol., 82, 596–601. [DOI] [PMC free article] [PubMed] [Google Scholar]
- Baron J. et al. (2013) Matriptase, HAT, and TMPRSS2 activate the hemagglutinin of H9N2 influenza A viruses. J. Virol., 87, 1811–1820. [DOI] [PMC free article] [PubMed] [Google Scholar]
- Burke D.F., Smith D.J. (2014) A recommended numbering scheme for influenza A HA subtypes. PloS One, 9, e112302.. [DOI] [PMC free article] [PubMed] [Google Scholar]
- Butt K. et al. (2005) Human infection with an avian H9N2 influenza A virus in Hong Kong in 2003. J. Clin. Microbiol., 43, 5760–5767. [DOI] [PMC free article] [PubMed] [Google Scholar]
- Cai Z. et al. (2010) A computational framework for influenza antigenic cartography. Plos Comput. Biol., 6, e1000949.. [DOI] [PMC free article] [PubMed] [Google Scholar]
- Colaert N. et al. (2009) Improved visualization of protein consensus sequences by iceLogo. Nat. Methods, 6, 786–787. [DOI] [PubMed] [Google Scholar]
- Crooks G.E. et al. (2004) WebLogo: a sequence logo generator. Genome Res., 14, 1188–1190. [DOI] [PMC free article] [PubMed] [Google Scholar]
- Dalby A.R., Iqbal M. (2014) A global phylogenetic analysis in order to determine the host species and geography dependent features present in the evolution of avian H9N2 influenza hemagglutinin. PeerJ, 2, e655.. [DOI] [PMC free article] [PubMed] [Google Scholar]
- Delport W. et al. (2010) Datamonkey 2010: a suite of phylogenetic analysis tools for evolutionary biology. Bioinformatics, 26, 2455–2457. [DOI] [PMC free article] [PubMed] [Google Scholar]
- Gohrbandt S. et al. (2011) H9 avian influenza reassortant with engineered polybasic cleavage site displays a highly pathogenic phenotype in chicken. J. Gen. Virol., 92, 1843–1853. [DOI] [PubMed] [Google Scholar]
- Goto H. et al. (2001) Plasminogen-binding activity of neuraminidase determines the pathogenicity of influenza A virus. J. Virol., 75, 9297–9301. [DOI] [PMC free article] [PubMed] [Google Scholar]
- Horimoto T., Kawaoka Y. (2001) Pandemic threat posed by avian influenza A viruses. Clin. Microbiol. Rev., 14, 129–149. [DOI] [PMC free article] [PubMed] [Google Scholar]
- Horimoto T. et al. (1994) Proprotein-processing endoproteases PC6 and furin both activate hemagglutinin of virulent avian influenza viruses. J. Virol., 68, 6074–6078. [DOI] [PMC free article] [PubMed] [Google Scholar]
- Iwasaki Y. et al. (2013) Novel bioinformatics strategies for prediction of directional sequence changes in influenza virus genomes and for surveillance of potentially hazardous strains. BMC Infect. Dis., 13, 386–386. [DOI] [PMC free article] [PubMed] [Google Scholar]
- Jiang W. et al. (2012) Chinese and global distribution of H9 subtype avian influenza viruses. PloS One, 7, e52671. [DOI] [PMC free article] [PubMed] [Google Scholar]
- Kyte J., Doolittle R.F. (1982) A simple method for displaying the hydropathic character of a protein. J. Mol. Biol., 157, 105–132. [DOI] [PubMed] [Google Scholar]
- Lazarowitz S.G., Choppin P.W. (1975) Enhancement of the infectivity of influenza A and B viruses by proteolytic cleavage of the hemagglutinin polypeptide. Virology, 68, 440–454. [DOI] [PubMed] [Google Scholar]
- Lee Y.-J. et al. (2007) Continuing evolution of H9 influenza viruses in Korean poultry. Virology, 359, 313–323. [DOI] [PubMed] [Google Scholar]
- Lewis N.S. et al. (2013) Avian influenza virus surveillance in wild birds in Georgia: 2009–2011. PloS One, 8, e58534. [DOI] [PMC free article] [PubMed] [Google Scholar]
- Licitra B.N. et al. (2014) Feline coronaviruses associated with feline infectious peritonitis have modifications to spike protein activation sites at two discrete positions. arXiv preprint arXiv:1412.4034.
- Lin Y.P. et al. (2000) Avian-to-human transmission of H9N2 subtype influenza A viruses: relationship between H9N2 and H5N1 human isolates. Proc. Natl. Acad. Sci. U.S.A., 97, 9654–9658. [DOI] [PMC free article] [PubMed] [Google Scholar]
- Munster V.J. et al. (2010) Insertion of a multibasic cleavage motif into the hemagglutinin of a low-pathogenic avian influenza H6N1 virus induces a highly pathogenic phenotype. J. Virol., 84, 7953–7960. [DOI] [PMC free article] [PubMed] [Google Scholar]
- Peiris M. et al. (1999) Human infection with influenza H9N2. The Lancet, 354, 916–917. [DOI] [PubMed] [Google Scholar]
- Richards F.M. (1974) The interpretation of protein structures: total volume, group volume distributions and packing density. J. Mol. Biol., 82, 1–14. [DOI] [PubMed] [Google Scholar]
- Rodi D.J. et al. (2004) DIVAA: analysis of amino acid diversity in multiple aligned protein sequences. Bioinformatics, 20, 3481–3489. [DOI] [PubMed] [Google Scholar]
- Rumschlag-Booms E. et al. (2009) Comparative analysis between a low pathogenic and a high pathogenic influenza H5 hemagglutinin in cell entry. Virol. J., 6, 1–5. [DOI] [PMC free article] [PubMed] [Google Scholar]
- Schneider T.D., Stephens R.M. (1990) Sequence logos: a new way to display consensus sequences. Nucleic Acids Res., 18, 6097–6100. [DOI] [PMC free article] [PubMed] [Google Scholar]
- Schrauwen E.J. et al. (2012) The multibasic cleavage site in H5N1 virus is critical for systemic spread along the olfactory and hematogenous routes in ferrets. J Virol., 86, 3975–3984. [DOI] [PMC free article] [PubMed] [Google Scholar]
- Skehel J.J., Wiley D.C. (2000) Receptor binding and membrane fusion in virus entry: the influenza hemagglutinin. Annu. Rev. Biochem., 69, 1):531–569. [DOI] [PubMed] [Google Scholar]
- Smith D.J. et al. (2004) Mapping the antigenic and genetic evolution of influenza virus. Science, 305, 371–376. [DOI] [PubMed] [Google Scholar]
- Soda K. et al. (2011) H9N2 influenza virus acquires intravenous pathogenicity on the introduction of a pair of di-basic amino acid residues at the cleavage site of the hemagglutinin and consecutive passages in chickens. Virol. J., 8, 1–9. [DOI] [PMC free article] [PubMed] [Google Scholar]
- Steinhauer D.A. (1999) Role of hemagglutinin cleavage for the pathogenicity of influenza virus. Virology, 258, 1–20. [DOI] [PubMed] [Google Scholar]
- Stieneke-Gröber A. et al. (1992) Influenza virus hemagglutinin with multibasic cleavage site is activated by furin, a subtilisin-like endoprotease. EMBO J., 11, 2407. [DOI] [PMC free article] [PubMed] [Google Scholar]
- Sun X. et al. (2010) Modifications to the hemagglutinin cleavage site control the virulence of a neurotropic H1N1 influenza virus. J. Virol., 84, 8683–8690. [DOI] [PMC free article] [PubMed] [Google Scholar]
- Sun Y. et al. (2013) Amino acid 316 of hemagglutinin and the neuraminidase stalk length influence virulence of H9N2 influenza virus in chickens and mice. J. Virol., 87, 2963–2968. [DOI] [PMC free article] [PubMed] [Google Scholar]
- Tamura K. et al. (2007) MEGA4: molecular evolutionary genetics analysis (MEGA) software version 4.0. Mol. Biol. Evol., 24, 1596–1599. [DOI] [PubMed] [Google Scholar]
- Vey M. et al. (1992) Hemagglutinin activation of pathogenic avian influenza viruses of serotype H7 requires the protease recognition motif R-X-K/R-R. Virology, 188, 408–413. [DOI] [PMC free article] [PubMed] [Google Scholar]
- Wang J. et al. (2016) Infectivity and transmissibility of avian H9N2 influenza viruses in pigs. J. Virol., 90, 3506–3514. [DOI] [PMC free article] [PubMed] [Google Scholar]
- Wei Y. et al. (2016) Antigenic evolution of H9N2 chicken influenza viruses isolated in China during 2009–2013 and selection of a candidate vaccine strain with broad cross-reactivity. Vet. Microbiol., 182, 1–7. [DOI] [PMC free article] [PubMed] [Google Scholar]
- Xu K.M. et al. (2007) Evolution and molecular epidemiology of H9N2 influenza A viruses from Quail in Southern China, 2000 to 2005. J. Virol., 81, 2635–2645. [DOI] [PMC free article] [PubMed] [Google Scholar]
Associated Data
This section collects any data citations, data availability statements, or supplementary materials included in this article.