Abstract
Summary
Survival analysis has been applied to The Cancer Genome Atlas (TCGA) data. Although drug exposure records are available in TCGA, existing survival analyses typically did not consider drug exposure, partly due to naming inconsistencies in the data. We have spent extensive effort to standardize the drug exposure data, which enabled us to perform survival analysis on drug-stratified subpopulations of cancer patients. Using this strategy, we integrated gene copy number data, drug exposure data and patient survival data to infer gene–drug interactions that impact survival. The collection of all analyzed gene–drug interactions in 32 cancer types are organized and presented in a searchable web-portal called gene–drug Interaction for survival in cancer (GDISC). GDISC allows biologists and clinicians to interactively explore the gene-drug interactions identified in the context of TCGA, and discover interactions associated to their favorite cancer, drug and/or gene of interest. In addition, GDISC provides the standardized drug exposure data, which is a valuable resource for developing new methods for drug-specific analysis.
Availability and Implementation
GDISC is available at https://gdisc.bme.gatech.edu/.
1 Introduction
The Cancer Genome Atlas (TCGA) is a valuable data resource for cancer research allowing for integrative omics analysis. Survival analysis has been applied to TCGA data as an integral tool for identifying important genes since TCGA was first published (Noushmehr et al., 2010; Weinstein et al., 2013; TCGA Research Network, 2008; Yuan et al., 2014). These survival analyses focused on either an individual cancer type or multiple cancers, and the identified genes were typically not drug-specific. Drug specific analyses were hindered by the quality and consistency of drug exposure data in TCGA. Efforts were spent in previous work to clean TCGAs drug exposure data for glioblastoma (GBM) and lower grade glioma (LGG), and a drug-specific survival analyses identified a few gene–drug interactions that impact patient survival in those caners (Spainhour and Qiu, 2016). Motivated by the promising results from GBM and LGG, the gene–drug interaction analysis was expanded to all 32 cancer types in TCGA, and the results are organized in the gene–drug Interaction for survival in cancer (GDISC) web portal presented in this paper.
GDISC is a web portal that contains the integrative analysis on gene copy number data, drug exposure data and survival data of all 32 cancer types in TCGA, which generated hypotheses of gene–drug interactions that may impact cancer patient survival. GDISC allows the user to explore those hypotheses; examine their favorite combinations of gene, drug and/or cancer in the context of TCGA; and enable discovery of novel cancer specific gene-drug interactions. GDISC provides a cleaned list of drug names found in all cancer types, patient numbers analyzed and other summary tables as supplementary information.
To identify gene–drug interactions in a given cancer, patients were stratified by drug exposure before survival analysis was performed. For a given cancer and drug of interest, if 30 or more patients were exposed to the drug, survival analysis was performed on this cancer-drug combination. KM curves were constructed for each gene, presenting survival of subsets of patients with decreased, normal or increase copy number of the gene. Log-rank test was used to assess whether the KM curves exhibited significant separation. Bonferroni correction was used to adjust the P-values generated in each cancer-drug combination. When available, gene expression data were examined using the t-test on the same copy number grouping as the survival curves to evaluate whether the identified gene–drug interaction at copy number level also manifests at the expression level.
2 Results
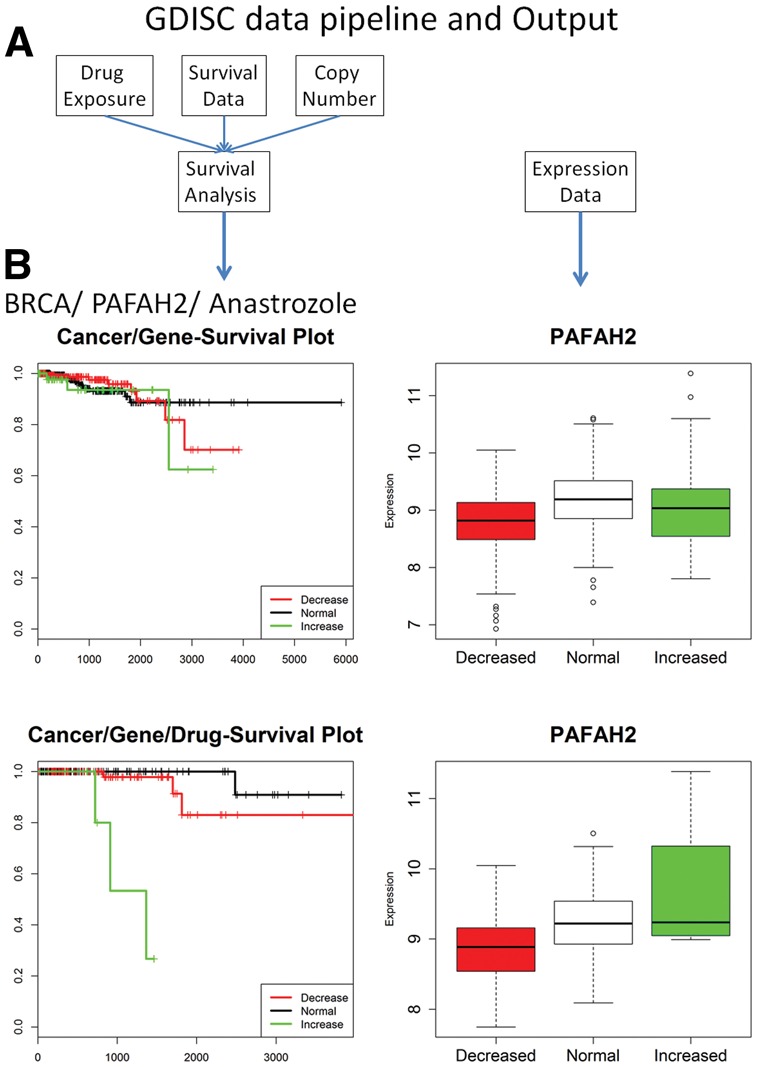
TCGA provides data for 32 different cancer types. A total of 913 unique drug names were listed in TCGA’s drug exposure data, with misspellings and alternative names for many drugs. After extensive effort of data clean, we obtained 312 common drug names. By combining drug exposure, survival and copy number data indicated in Figure 1A, we stratified patients according drug exposure and analyzed survival and copy number data for every cancer-drug combination of at least 30 patients. For each of the 77 combinations with 30 for more patients, 24 776 genes were analyzed. These analyses have identified a total of 11 438 statistically significant gene–drug interactions in specific cancers.A short summary of the results by drug and cancer type is presented in Table 1. Definitions of the cancer type abbreviations are available at the TCGA data portal.
Fig. 1.

GDISC data pipeline and Output. (A) GDISC pulls current data from TCGA for a comprehensive gene by gene survival analysis by drug exposure of all available cancer types. (B) For a given cancer and drug of interest, gene copy number is used to construct survival curves to examine whether copy number of a certain gene correlates with survival (bottom-left panel of Fig. b). The survival curves derived all patients in the given cancer type (top-left panel of Fig. b) is shown to contrast with the drug-specific analysis. When available, expression data are visualized to assess the effect of copy number on gene expression
Table 1.
Summary of drug–cancer–gene interactions
| Drug | Cancers | Genes |
|---|---|---|
| Anastrozole | BRCA | 216 |
| Carboplatin | NSC,LUSC,UCS | 575 |
| Cyclophosphamide | BRCA | 28 |
| Docetaxel | BRCA,LUSC,SARC | 401 |
| Doxorubicin | BRCA,DLBC,SARC,UCEC | 532 |
| Epirubicin | BRCA | 307 |
| Exemestane | BRCA | 589 |
| Fluorouracil | BRCA,COAD,PAAD,STAD | 816 |
| Tamoxifen | BRCA,OV | 79 |
| Trastuzumab | BRCA | 13 |
| Cisplatin | CESC,HNSC,LUAD,MESO,OV | 245 |
| Capecitabine | COAD | 250 |
| Oxaliplatin | COAD | 1 |
| Temozolomide | GBM,LGG | 3100 |
| Cetuximab | HNSC | 41 |
| Paclitaxel | HNSC,LUAD,UCS | 533 |
| Bevacizumab | LGG,OV | 2228 |
| Lomustine | LGG | 110 |
| Pemetrexed | LUAD | 33 |
| Gemcitabine | LUSC,SARC | 447 |
| Vinorelbine | LUSC | 63 |
| Leuprolide | PRAD | 49 |
GDISC houses the identified gene–drug interactions and provides a web interface for users to explore and query these results. Users can specify a cancer, a drug and/or a gene of interest. The web interface will return gene–drug interactions corresponding to the query. Figure 1B shows one such example, the PAFAH2-Anastrozole interaction in breast cancer. The drug-specific survival analysis in the bottom left of Figure 1B shows that when focusing on the breast cancer patients exposed to Anastrozole, significant association is observed between gene copy number and survival data. However, the association is not significant when all breast cancer patients are considered. The expression difference among different copy number groups is also more pronounced when focusing on breast cancer patients exposed to Anastrozole. This example highlights an instance where the drug-specific analysis shows statistical significance while analysis of the larger pool of patients does not.
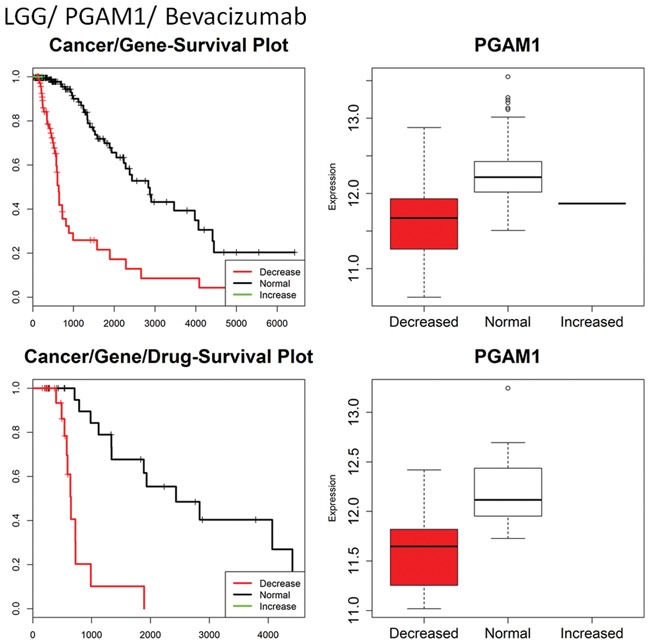
Among the identified gene-drug interactions, some have been discussed in the literature. For example, LGG–PGAM1–Bevacizumab interaction (Fig. 2, bottom left panel) revealed that in LGG patients treated with Bevacizumab, normal copy number of PGAM1 are associated with longer survival compared to patients with decreased copy number of PGAM1. PGAM1 is an enzyme that aids in the balance of glycolysis and biosynthesis. Bevacizumab is an anti-vascular endothelial cell growth factor antibody that restricts the growth of new blood vessels causing hypoxia in tumors. Loss of PGAM1 decreases the effects of hypoxia on the tumor by inhibiting the cell’s regulation balance between glycolysis and biosynthesis allowing tumor growth in a hypoxic state (Hitosugi et al., 2012). Another example, BRCA-PAFAH2-Anastrozole interaction shows that in BRCA patients treated with Anastrozole decreased copy number is associated with longer survival. PAFAH2 is a lipades that degrades PAF and plays a role in angiogenesis. Anastrozole is an estrogen production inhibitor that binds to the aromatase enzyme. Increases in PAFAH2 allow for angiogenesis and subsequent tumor growth. This counteracts loss of estrogen signaling based tumor growth (Laganiere et al., 2005). Many identified interactions, such as BRCA–ARL5B–Carboplatin and LUAD–ROBO2–Paclitaxel, have no independent confirmation but show similar association of increased gene copy number and increased survival for patients treated with the given drug for the given cancer.
Fig. 2.

GDISC output for LGG–PGAM1 and LGG–PGAM1–Bevacizumab showing survival curves and gene expression data. Here we see that low copy number of PGAM is linked to lower survival in both the overall survival and the Bevacizumab specific survival
3 Conclusion
GDISC provides a resource for integrative, large scale analyses of gene–drug interactions for cancer types included in TCGA, as well as a cleaned list of drug exposure data. GDISC provides a searchable set of survival analyses for the discovery of cancer specific gene–drug interactions. The web interface allows biologists and clinicians to specify their cancer, drug and/or gene of interest and returns the identified interaction associated with their query. GDISC will be updated as new TCGA data are released allowing for continued, up to date analyses.
Funding
This work was supported by funding from the National Institutes of Health (R01CA163481), the National Science Foundation (CCF1552784) and the Giglio Family Breast Cancer Fund.
Conflict of Interest: none declared.
References
- Hitosugi T. et al. (2012) Phosphoglycerate mutase 1 coordinates glycolysis and biosynthesis to promote tumor growth. Cancer Cell, 13, 585–600. [DOI] [PMC free article] [PubMed] [Google Scholar]
- Laganiere J. et al. (2005) Location analysis of estrogen receptor α target promoters reveals that FOXA1 defines a domain of the estrogen response. PNAS, 102, 11651–11656. [DOI] [PMC free article] [PubMed] [Google Scholar]
- Noushmehr H. et al. (2010) Identification of a CpG iland methylator phenotype that defines a distinct subgroup of Glioma. Cancer Cell, 17, 510–522. [DOI] [PMC free article] [PubMed] [Google Scholar]
- Spainhour J.C., Qiu P. (2016) Identification of gene-drug interactions that impact patient survival in TCGA. BMC Bioinfomatics, 17, 409.. [DOI] [PMC free article] [PubMed] [Google Scholar]
- The Cancer Genome Atlas Research Network (2008) Comprehensive genomic characterization defines human glioblastoma genes and core pathways. Nature, 455, 1061–1068. [DOI] [PMC free article] [PubMed] [Google Scholar]
- Weinstein J.N. et al. (2013) The cancer genome Atlas Pan-cancer analysis project. Nature Genet., 45, 1113–1120. [DOI] [PMC free article] [PubMed] [Google Scholar]
- Yuan Y. et al. (2014) Assessing the clinical utility of cancer genomic and proteomic data across tumor types. Nature Biotechnol., 32, 644–652. [DOI] [PMC free article] [PubMed] [Google Scholar]


