Fig. 3.
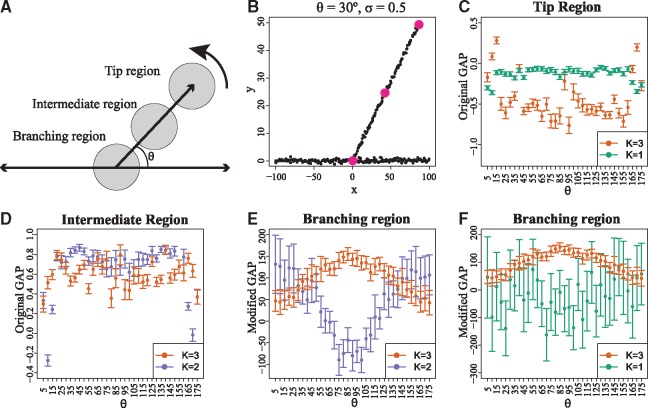
The original, as well as the modified versions of the GAP statistic are necessary for the identification of regions of interest in single-cell differentiation trajectories. (A) Toy data were generated by uniform sampling of data-points along three line segments. Two of the segments are held fixed and one of them is positioned at an angle θ. A new dataset is sampled for each value of θ and zero-mean Gaussian noise of standard deviation σ is added. Then, local clustering is performed on centred on three cells, each being in a distinct region: Tip, Intermediate and Branching. The S = 31 (as selected by the proposed heuristic) nearest neighbors of each center-cell define the region used for local clustering. (B) Example of toy data generated for and . The centers of the three regions are highlighted. (C) The original GAP successfully identifies the tip region cell, since holds for a wide variety of angles. (D)GAP cannot be used to identify branching region cells, since in many cases holds in the intermediate region. As a result, a large number of intermediate region cells would be false positive branching region cells. (E) successfully identifies the branching region cell, since holds for a wide variety of angles. (F) cannot be used to identify tip cells. In many cases there is strong overlap between the confidence intervals for and , which in practice would lead to a large number of branching cells being falsely identified as tip cells. All error bars in the plot correspond to 95% CIs generated using 500 bootstrap datasets

