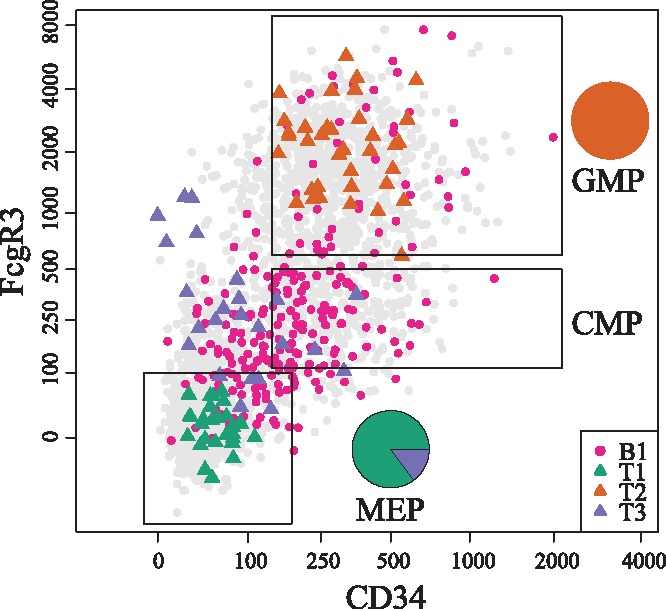
Fig. 5.

Cells plotted according to FACS-measured FcgR3 and CD34 protein expression values (Paul et al., 2015). The cells corresponding to regions B1, T1, T2, T3, as identified by local K-Branches, are highlighted. The MEP, granulocyte/macrophage progenitors and CMPs gates are also plotted. Pie-charts correspond to the distribution of T1, T2 and T3 cells in the MEP and GMP gates. The cells of branching region B1 are enriched only in the CMP gate (Fisher’s exact test P-value < ). The cells of tip T1 correspond to MEP, while the cells of tip T2 correspond to GMP. The cells of tip T3 correspond to outlier groups of dendritic cells and natural killer cells (lymphocytes)
