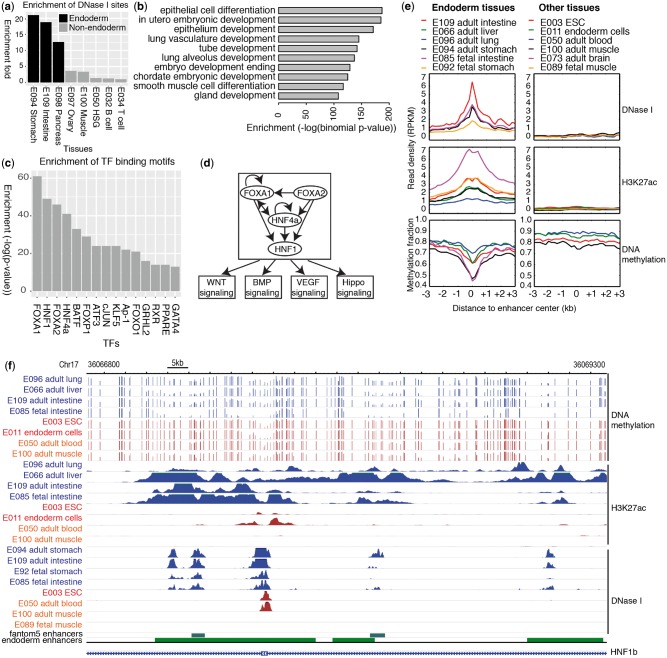
Fig. 3.
Identification of endoderm-specific enhancers by Fisher’s exact test method. (a) Enrichment of DHS for endoderm-specific enhancers identified by Fisher’s exact test. (b) Enriched GO terms and their binomial p-values based on GREAT. Top 10 terms are displayed. (c) Enrichment of TF binding motifs in endoderm-specific enhancers by Fisher’s exact test. Top 15 TFs are displayed. (d) The putative gene regulatory networks for endoderm tissues based on identified enhancers. (e) The expression profiles of epigenetic marks for enhancers in the network in endoderm tissues and non-endoderm tissues, ESCs and ESC-derived endoderm cells. (f) A browser example of merged endoderm-specific enhancers. Blue is endoderm tissues, brown is non-endoderm tissues, and red is ESCs and ESC-derived endoderm cells

