

Abstract
Motivation
Long non-coding RNAs (lncRNAs) have been implicated in the regulation of diverse biological functions. The number of newly identified lncRNAs has increased dramatically in recent years but their expression and function have not yet been described from most diseases. To elucidate lncRNA function in human disease, we have developed a novel network based method (NLCFA) integrating correlations between lncRNA, protein coding genes and noncoding miRNAs. We have also integrated target gene associations and protein-protein interactions and designed our model to provide information on the combined influence of mRNAs, lncRNAs and miRNAs on cellular signal transduction networks.
Results
We have generated lncRNA expression profiles from the CD34+ haematopoietic stem and progenitor cells (HSPCs) from patients with Myelodysplastic syndromes (MDS) and healthy donors. We report, for the first time, aberrantly expressed lncRNAs in MDS and further prioritize biologically relevant lncRNAs using the NLCFA. Taken together, our data suggests that aberrant levels of specific lncRNAs are intimately involved in network modules that control multiple cancer-associated signalling pathways and cellular processes. Importantly, our method can be applied to prioritize aberrantly expressed lncRNAs for functional validation in other diseases and biological contexts.
Availability and implementation
The method is implemented in R language and Matlab.
Supplementary information
Supplementary data are available at Bioinformatics online.
1 Introduction
The Myelodysplastic syndromes (MDS) are a group of haematological disorders that are characterized by ineffective haematopoiesis. They can be classified into various subgroups, including refractory anaemia (RA), RA with ringed sideroblasts (RARS), refractory cytopenia with multi-lineage dysplasia (RCMD), and RA with excess blasts (RAEB), based on the presence or absence of ring sideroblasts, the number of haematopoietic lineages that are affected, and the percentage of blasts in the bone marrow (Harris et al., 2000; Howe et al., 2004). In approximately one-third of patients, MDS eventually transforms into acute myeloid leukaemia (AML) (Alessandrino et al., 2001). The prevalence of MDS has risen worldwide in part due to the aging population, the use of cytotoxic and mutagenic therapies, and possibly due to increased exposure to environmental toxins (Hirai, 2003). A number of recent studies have profiled coding gene and noncoding miRNA expression in MDS (Dostalova Merkerova et al., 2011; Mills et al., 2009; Pellagatti et al., 2006; Rhyasen and Starczynowski, 2012). Moreover, genes and driver pathways with recurrent mutations have now been reported for MDS (Liu et al., 2015b). However, the molecular pathogenesis of MDS remains poorly understood and has hindered the development of new and improved therapies (Liu et al., 2010).
Recent studies have indicated an important role for long non-coding RNA (lncRNA) in human physiology and complex diseases. LncRNAs are non-protein-coding transcripts longer than 200 nucleotides and are pervasively transcribed in the genome. Intergenic lncRNAs (lincRNAs) are transcribed from intergenic regions and intronic lncRNAs from introns of protein-coding genes (Khalil et al., 2009; Ponjavic et al., 2007). LncRNAs are known to regulate transcriptional and translational output in part by targeting other genetic and epigenetic regulators (Liu et al., 2015a,b). Aberrantly expressed lncRNAs have been detected in human cancers (Cheetham et al., 2013; Spizzo et al., 2012; Tahira et al., 2011) and are associated with the regulation of many important oncogenes and tumor suppressor genes, such as p53 (Huarte et al., 2010), NFκB (Rapicavoli et al., 2013) and WNT (Xu et al., 2013). LincRNAs are more evolutionarily conserved than other intergenic regions (Guttman et al., 2009), but generally less conserved than protein-coding genes (Derrien et al., 2012). Recent studies have shown that different expression patterns of lincRNAs are also associated with numerous cellular processes, such as stem cell development, pluripotency, immune response and cell cycle regulation (Guttman et al., 2011; Hung et al., 2011; Loewer et al., 2010; Rinn and Chang, 2012).
While transcribed from the genome, lncRNAs are not translated into proteins, hindering their rapid functional characterization. Hence, annotation of lncRNAs has largely relied on computational predictive methods, which still have significant limitations (Cabili et al., 2011; De Santa et al., 2010; Guo et al., 2013; Liao et al., 2011). In previous work, lncRNA function was predicted based on either chromosomal location relative to protein coding genes (PCGs), or co-expression with PCGs (Zheng et al., 2016). Computational methods using integrated networks, based on known disease associated lncRNAs (Chen, 2015a,b, Chen et al, 2016a,b; Huang et al., 2016) or on lncRNAs acting as competing endogenous RNAs (Li et al., 2014), have also been described. Although these studies have expanded our knowledge of lncRNAs and provide some potential lncRNA–disease associations, the literature around well-characterized disease-specific lncRNAs is small and limits the discovery potential of this approach. Considering the complex associations between lncRNAs and other regulatory elements (Suresh et al., 2015), we hypothesize that prediction of lncRNA function could be improved by integrating more biological data, such as PCG and miRNA expression profiles, and signaling pathway and Gene Ontology (GO) information.
Although lncRNAs are increasingly recognized as regulators of normal and aberrant haematopoiesis (Garzon et al., 2014), their role in MDS has not been reported. To fill this gap, we developed the network-based lncRNA co-module function annotation method (NLCFA) and applied it to identify lncRNAs aberrantly expressed in MDS and we annotated their biological functions by integrating different types of biological data. We focused our investigation on RAEB-2 MDS, a subgroup with a significantly higher risk of leukemic transformation and poor overall survival. We first identified lincRNAs that were differentially expressed in MDS CD34+ HSPCs and then performed an integrative analysis to identify co-modules based on the PCG profiles, miRNA expression profiles, and signalling pathway information. The co-modules capture network associations between lincRNAs and these different types of biological information. The lincRNAs in each co-module were further annotated by prioritized GO terms through network propagation. We identified a number of aberrantly expressed lncRNAs and their associations with cellular processes that possibly contribute to MDS pathophysiology. Our method could be used to annotate disease-associated lncRNAs and prioritize individual lincRNAs for functional validation and targeted therapies.
2 Materials and methods
2.1 Sample collection and sequencing
Data were obtained from patients with MDS who ranged from 68 to 77 years of age (mean age 72 years). Age-matched control samples were obtained from patients without cytopenias. Bone marrow aspirates (30–100 mL) were collected in heparin/Hank’s solution and diluted 1:10 in RPMI medium prior to centrifugation and ficoll separation of the mononuclear cell fraction. CD34+ HSPC fractions were purified using anti-CD34 antibody-coated magnetic beads and an autoMACS Pro cell sorting system. The purity and yield of CD34+ cells were estimated by flow cytometry and cell counting, respectively, to achieve > 90% purity. For RNA sequencing, we analyzed 16 samples, 10 from MDS RAEB-2 subtype patients and 6 from healthy donors. In addition, microarray data of CD34+ HSPCs from 183 MDS patients and 17 healthy donors were collected from the NCBI Gene Expression Omnibus (GEO) (Edgar et al., 2002) GSE19429 (29). These data were generated using Affymetrix GeneChip Human Genome U133 Plus 2.0 arrays. We filtered out 43 samples from patients with the RAEB-2 subtype and compared them with 17 samples from healthy donors. Eight of the differentially expressed lincRNAs were selected for validation using high-throughput PCR in an independent cohort of MDS patients (see the supplementary materials).
2.2 LincRNAs sequence annotation
The human lincRNA catalog is available at the Broad Institute website (http://www.broadinstitute.org/genome_bio/human_lincrnas/?q=lincRNA_catalog, Jan.2015). We downloaded the related files on lincRNAs according to hg19 genome and constructed a lincRNAs reference library.
2.3 Protein-coding and non-coding (lincRNA) gene expression from RNA-seq datasets
The human genome hg19 (Genome Reference Consortium GRCh37) was used as the reference genome. The pipeline for identifying expression levels of lincRNAs and PCGs from RNA-Seq datasets is illustrated in Figure 1 (left side). We first mapped the raw reads to the human hg19 reference genome using Tophat software (Trapnell et al., 2009). Then the outputs of alignment were assembled to the transcripts using Cufflinks (Trapnell et al., 2013). The transcript assembly was merged by implementing Cuffmerge (Trapnell et al., 2010). Expression of each transcript was quantified using FPKM (fragments per kilobase of transcript per million fragments mapped).
Fig. 1.
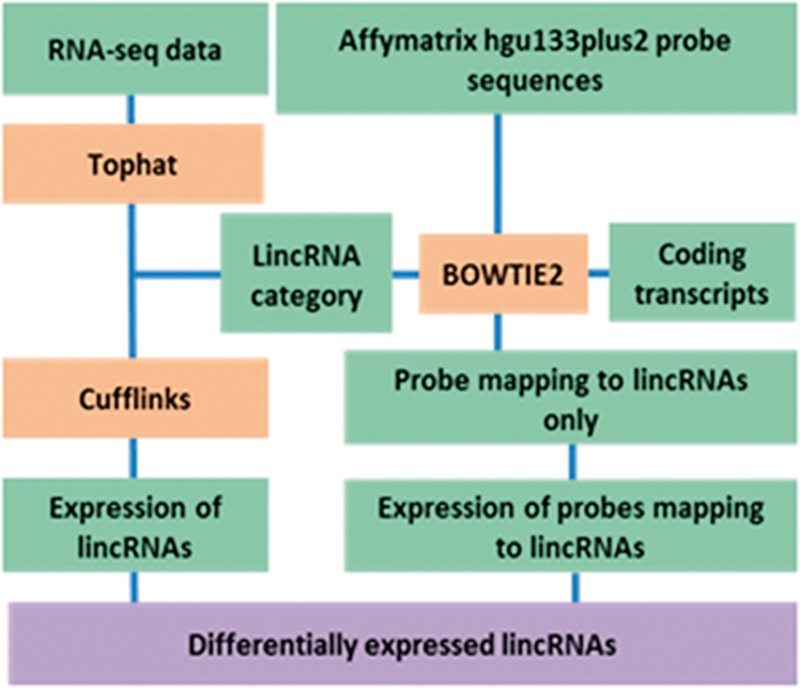
Process for identifying DE lincRNAs in MDS: Left side: Flowchart for identifying DE lincRNAs from RNA-seq datasets. Raw reads were mapped to the human genome (hg19) using Tophat. Expression of lincRNA transcripts was quantified with Cufflinks and DE lincRNAs identified using Cuffdiff. Right side: Process for identifying DE lincRNAs from microarray. All probes in HG-U133Plus2 platform were mapped to lincRNAs using Bowtie2. We kept probes mapped to lincRNAs without mismatch and removed probes which mapped to protein-coding transcripts. LincRNA expression profiles were determined using the re-annotated probes. DE lincRNAs were identified using the limma package in R. DE lincRNAs obtained from RNA-seq and microarrays were combined for further analyses
2.4 Protein-coding and non-coding (lincRNA) gene expression from microarray datasets
We first re-annotated the Affymetrix probes to lincRNAs based on the platform annotation file (Fig. 1, right side). All of the probes in the HG-U133Plus2 platform were mapped to lincRNAs and RefSeq coding transcripts using Bowtie2 (Langmead and Salzberg, 2012). We kept the probes that mapped to lincRNAs with no mismatch and removed those that mapped to protein-coding transcripts. Then the lincRNA expression profiles were determined using the re-annotated probes.
2.5 Identifying differentially expressed lincRNAs in MDS
The statistical analysis of our RNA-Seq data was performed in the R statistical computing environment (R). We applied the Cuffdiff and CummeRbund pipeline (Goff et al., 2013) to compare the expression levels of normal HSPCs with those from MDS HSPCs. Differentially expressed (DE) lincRNAs were identified with FDR < 0.05 adjusted for multiple testing. For the expression measured by microarrays, we used the re-annotated probes as described above. We identified DE lincRNAs comparing data from normal HSPCs and different MDS subtypes using the limma package (Langfelder et al., 2008) in R. DE lincRNAs were identified FDR < 0.05 adjusted using the Benjamini-Hochberg method (Benjamini and Hochberg, 1995). We combined DE lincRNAs identified by both methods (Supplementary Table S1).
2.6 miRNA expression and target gene sets
The miRNA expression dataset was obtained from experiments conducted by Dostalova Merkerova et al. (Dostalova Merkerova et al., 2011). These data were generated from CD34+ HSPCs of 39 patients with MDS and AML and 6 healthy donors, using an Illumina array platform. We selected 10 samples from patients classified with the RAEB-2 subtype of MDS. The differentially expressed miRNAs were identified by t-test statistic and Benjamini-Hochberg adjusted P-value with the threshold of 0.1. For each identified miRNA, the target genes were collected from both experimentally validated databases and prediction tools, including mirtarbase (Hsu et al., 2011), TargetScan (Lewis et al., 2005), Pictar (Krek et al., 2005) and miRanda (John et al., 2004). For those predicted results, we retained only the miRNA targets predicted by at least two tools.
2.7 Cellular pathway information
The predefined biological pathways were obtained from the Molecular Signatures Database (Liberzon et al., 2011), which contains a large number of annotated functional gene sets collected from available public databases, including BioCarta (Nishimura, 2004), KEGG (Kanehisa and Goto, 2000), PID (Schaefer et al., 2009) and Reactome (Joshi-Tope et al., 2005). We chose the canonical pathways from the curated gene sets (c2) in MsigDB V4.0, which contained 1320 metabolic and signalling pathways.
2.8 Network-based lncRNA co-module function annotation method (NLCFA)
Identifying co-modules in MDS from multiple datasets: The flowchart of integrated analysis for MDS is shown in Figure 2A. The co-expression of identified lincRNAs and PCGs was evaluated by the Pearson correlation coefficient (PCC). For each lincRNA-PCG pair, we calculated the absolute PCC with a P-value < = 0.01. Pairs with a PCCs threshold > 0.6 were used to construct the lincRNA-PCG (L-P) co-expressed association matrix. The association of miRNA-PCG (M-P) with pathway-PCG (P-P) was similarly constructed based on the miRNA target genes and pathway information. The L-P, M-P and P-P matrices were filtered by the overlapping PCGs. We applied a multi-dimensional non-negative matrix factorization (MDNMF) method to extract co-modules from the three association matrices (Fig. 2B). The objective function for MDNMF was defined as:
| (1) |
where XI represents the I type of genomics dataset that was used. W was a M × K matrix representing the basis vector and HI is a K × N matrix, representing the coefficient vectors in the reduced dimension. W and H must be non-negative. The parameter K described the number of co-modules built with the data. To find the minimum of objective function F, we used the multiplicative update algorithm to minimize the Euclidean error function. We calculated the errors between the input matrices and the model reconstructed data with different K from 5 to 15. Comparing the errors, we selected the smallest one and set 11 as the number of parameter K to build the co-modules. W and H were updated at each step by using the generalized multiplicative update rules as follows:
| (2) |
| (3) |
When we randomized the initial matrices W, H1, H2 and H3, which are iteratively updated to minimize the Euclidean distance function, we occasionally encountered a local minimum solution. To address this limitation, we repeated the optimization procedure 100 times with random initial solution matrices. The lowest object function value was selected as the final factorization solution.
Fig. 2.
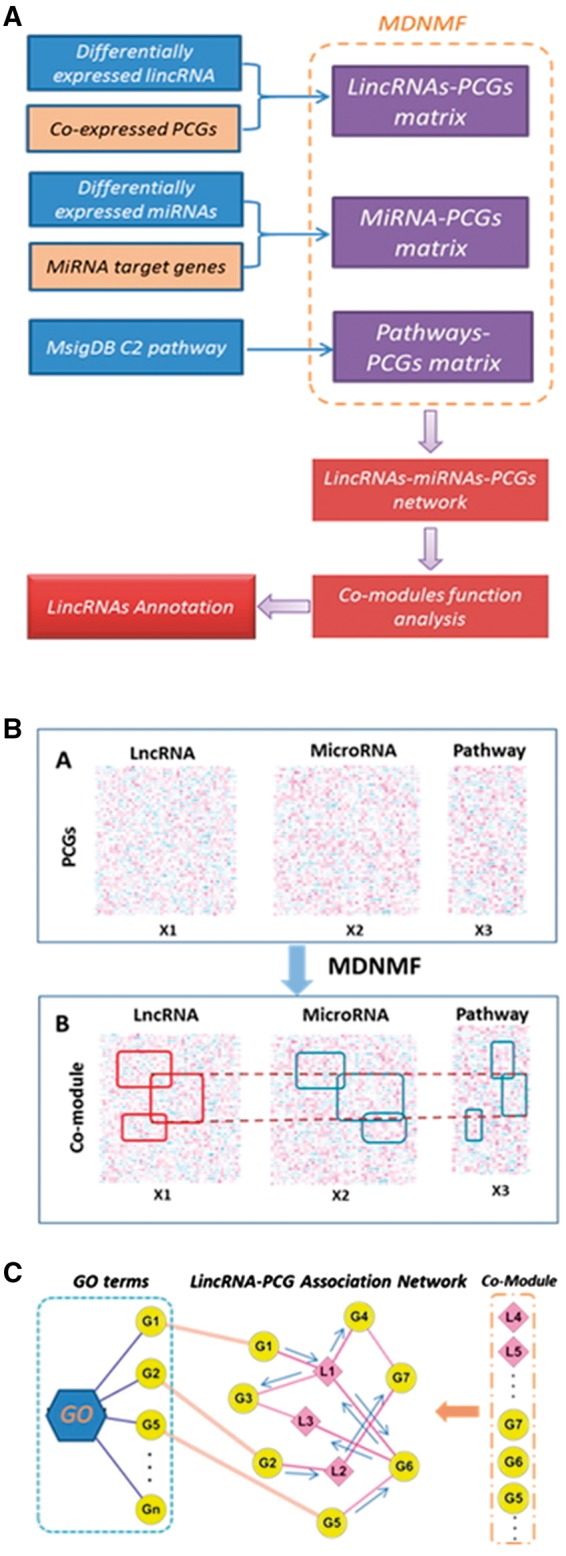
(A) Flowchart for steps in the NLCFA method. DE lincRNAs and miRNAs significantly correlated with protein coding-gene (PCGs) expression were identified. We integrated lincRNAs-PCGs (L-P), miRNAs-PCGs (M-P), pathways-PCGs (P-P) into three different association matrices. These matrices were further analyzed using the MDNMF method to identify co-modules. In each co-module, associated networks were used to annotate lincRNA function. (B) Identified co-modules in MDS. In the three associated matrices, rows correspond to the PCGs and columns correspond to lncRNAs, miRNAs and pathways. These co-module subsets contain highly correlated profiles identified using the MDNMF method. (C) Annotating lincRNA function by a network-based method. For each co-module, we constructed the interaction network and integrated protein-protein interaction. After network propagation, a lincRNAs-GO association score was assigned to each node and each lincRNA was annotated with the prioritized GO terms
Biological function and association of co-modules in MDS : For each co-module identified in MDS, we constructed the network-integrated lincRNAs, miRNAs, PCGs and pathways (Fig. 2C). We assigned the KEGG pathways, which have been categorized to six functional groups, in each co-module to the corresponding category to assess the related biological functions. The web-based tool Ingenuity Pathway Analysis (IPA, http://www.ingenuity.com/index.html) was used to identify enriched biological functions and related diseases in each co-module.
2.9 Annotating the lincRNA functions by gene ontology (GO) terms
The GO project (Ashburner et al., 2000) has developed a well-defined and structured compendium of gene products in terms of their associated biological processes, molecular functions and cellular components. We downloaded the human GO terms from the GO consortium (www.geneontology.org) and assigned terms to each gene. All the PCGs were mapped to GO terms and GO terms with at least two corresponding PCGs were retained.
LincRNAs are connected to different PCGs and share common PCGs with miRNAs, resulting in diverse associations of lincRNAs with specific functions. Based on a network propagation method used to associate genes and protein complexes with diseases (Vanunu et al., 2010), we built a weighted network to annotate lincRNAs with the prioritized GO terms. For lincRNAs in each co-module, the annotation process is illustrated in Figure 2C.
We extracted the lincRNA-PCG network (LPn) with edges representing lincRNAs co-expressed with PCGs. To connect the PCGs in LPn, we integrated protein-protein interaction (PPI) information obtained from the BioGRID database (downloaded on April 2014) by using the R PSICQUIC package. By removing duplicated PPIs, we obtained 151007 human PPIs and mapped their interactions with LPn. The PCGs were also connected with LPn if they were the targets of the same miRNA. Finally, the expanding network contained two kinds of edges: lincRNA-PCG co-expression and PCG-PCG interaction. The weight of edges W was calculated by the average PCC from the both of RNA-Seq data and microarray data. In this undirected LPn G (V,E,W), V represents all lincRNAs and PCGs, E stands for interactions between nodes in network and W denotes the weighted association of each edge. According to the network-based method, each node in the network pump flows to its neighbours and receives flows from them. The lincRNAs-GO association score was defined as follows: , where , and the a ϵ(0,1) weighed the relative importance of the contributed information of neighbourhoods and the initial information was set as 0.6. W is an adjacent matrix of weighted network. Y is a matrix representing the prior knowledge of GO terms. The initial scores of Y were defined as:, where denoted the number of neighbours belonged to this GO terms, was the number of all neighbours of node V. The mean square deviation of the association score matrix S was used to control the iterative times. The computation would be stopped if the mean square deviation between and was less than . We prioritized the nodes associated with the GO terms by the score matrix S and annotated lincRNAs with the prioritized GO terms.
3 Results
We developed the network-based lincRNA co-module function annotation NLCFA method (Fig. 2A) to integrate lincRNAs, miRNAs, PCG pathways and PPI information. This network was used to annotate lincRNA function and infer putative treatment targets in MDS.
3.1 Identification of aberrantly expressed lincRNA in MDS
To identify aberrantly expressed lincRNAs in MDS, we used RNA-Seq data from patients with RAEB-2 MDS and compared them with age-matched healthy donors. We identified 93 DE lincRNAs, using a false discovery rate (FDR) < 0.05. We also compared gene expression microarray datasets from RAEB-2 MDS patients with those from healthy donors and identified 51 DE lincRNAs with adjusted P-value <0.05. The identified DE lincRNAs from RNA-Seq and microarray datasets are listed in Supplementary Table S1 and the six overlapping lincRNAs are shown in bold. All of the DE lincRNAs were combined for further analysis. Distribution of DE lincRNAs along each human chromosome are shown in the Figure 3. Importantly, the DE lincRNAs are distributed across all human chromosomes (excluding Chr X and Chr Y) and not only enriched in chromosomal regions known to be frequently mutated in MDS (e.g. Chr 5 and Chr 7).
Fig. 3.
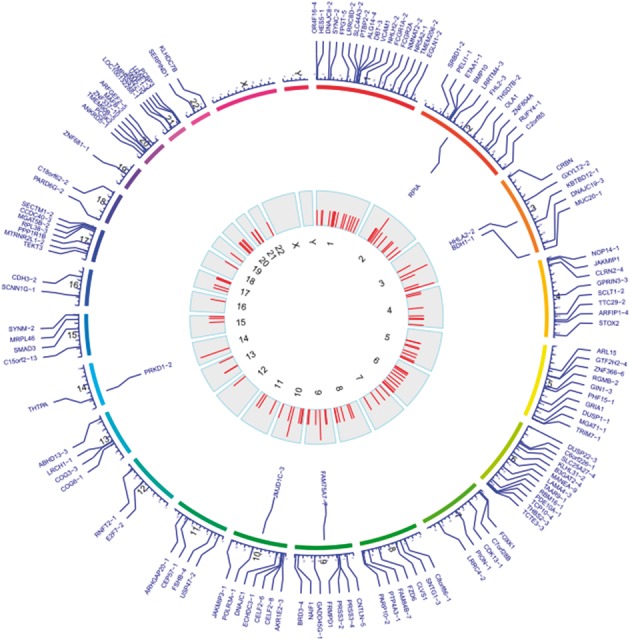
Chromosomal distribution of DE lincRNAs. The outer circle represents each human chromosome. The blue labels on the outside are the position and name of identified DE lincRNAs. The blue labels on the inside are lincRNAs identified in both RNA-seq and microarray dataset. The inside track is the histogram for the DE lincRNAs on each chromosome. The DE lincRNAs are distributed across all chromosomes. The top three chromosomes that are enriched for DE lincRNAs are chr2 (30 DE lincRNAs), chr1 (22 DE lincRNAs) and chr6 (20 DE lincRNAs)
We further analyzed microarray data from RAEB-1 and RARS subtypes of MDS patients and compared these data with the lincRNA profiles obtained from RAEB-2 MDS. We found 59 DE lincRNAs in RAEB-1 and 138 in RARS. In total, 30 DE lincRNAs from RAEB-1 and 24 from RARS overlapped those in RAEB-2. Interestingly, the number of DE lincRNAs in RAEB-1 and RAEB-2 was higher (∼36%) than the overlap between RAEB-2 and RARS (∼14%). These data suggest that the identified lincRNAs may be associated with processes involved with MDS progression and evolution.
3.2 Application of NLCFA to MDS datasets
Identification of co-modules using MDNMF: We constructed three association matrices of L-P, M-P and P-P (Fig. 2; methods). By filtering 2209 common PCGs in these three matrices, we obtained an L-P matrix consisting of 138 DE lincRNAs, an M-P matrix consisting of 89 identified miRNAs and a P-P matrix consisting of 1305 pathways. Using the MDNMF method, three matrices were factorized to eleven lincRNAs-miRNAs-pathways (LMP) co-modules, each of which covered a set of lincRNAs, miRNAs, PCGs and pathways. Removing the two co-modules not containing lincRNAs we list the lincRNAs, miRNAs, PCGs and pathways of nine co-modules in Supplementary Table S2. In total, we identified nine LMP co-modules containing 946 PCGs, 41 lincRNAs, 34 miRNAs and 268 pathways.
Biological function of the co-module networks: For each LMP co-module, we constructed an LMP association network using related PCGs and inferred biological function based on related pathways. We collated 66 KEGG pathways in co-modules and assigned them to functional categories. The 28 KEGG pathways belonging to the top three sub-categories are listed in Supplementary Table S3. There are 12 pathways in the ‘human diseases’ category belonging to the sub-category of cancers; 8 pathways in the ‘organismal systems’ category belonging to the ‘immune diseases and system’ sub-category; the remaining 8 pathways belong to the ‘signal transduction’ sub-category. Given the biology of MDS and its potential to progress to AML, it is noteworthy that the pathways in these modules are associated with ‘cancer development’ and the ‘immune system’. In fact, four pathways associated with co-modules were reported as top nine enriched KEGG pathways (Wang et al., 2013a) in MDS.
The PCGs in each co-module were also investigated using Ingenuity Pathway Analyses (IPA) to reveal associations with biological functions and diseases. We applied these analyses to each co-module and used co-module 1 as an example to illustrate our results. The top-ranked networks related to cellular movement and migration in cancer were significantly enriched in co-module 1. The associated network functions are listed in Table 1. Cancer, haematological disease and immunological diseases associated functions were top ranked. Analysis of the top-ranking networks provides information to further explore key functions within each module. The genes in the top-ranked networks included important oncogenes and tumor suppressor genes, indicating a close association of genes with cancer. Most of the other genes in co-module 1 are directly or indirectly linked with the tumor suppressor gene TP53. We have observed similar associations between the expression of lincRNA genes and TP53 in AML (Beck et al, unpublished data). We also listed the associated diseases and disorders in co-module 1 (Table 1). Cancer and some system disorders were ranked highly. Collectively, these data show that by constructing modular network maps, differentially expressed coding and non-coding gene expression profiles and other annotations can be used to identify lincRNAs with biological roles in MDS/AML.
Table 1.
The top associated diseases and functions in co-module 1
| Top diseases and disorders | Top associated network functions |
|---|---|
| Cancer | Cancer, Organismal Injury and Abnormalities, Gene Expression |
| Organismal injury and abnormalities | Cell Morphology, Cellular Assembly and Organization, Cellular Function and Maintenance |
| Connective tissue disorders | Cellular Assembly and Organization, Cellular Development, Cellular Growth and Proliferation |
| Endocrine system disorders | Cellular Development, Cellular Growth and Proliferation, Nervous System Development and Function |
| Reproductive system disease | Cancer, Hematological Disease, Immunological Disease |
The results of the IPA analysis for the other co-modules are presented in Supplementary Table S4. Most of the top-ranking functions in the other eight co-modules were also concentrated in cancer development, and four co-modules were directly associated with haematologic system development and disease. Taken together, these results indicate that PCGs, lincRNAs, miRNAs within the co-modules cooperate in cancer-associated pathways and disease pathogenesis.
3.3 Inferring biological roles for lincRNAs from network connections in MDS co-modules
We used the NLCFA to prioritize 8 MDS-associated lincRNAs and evaluated their expression using quantitative RT-PCR (qRT-PCR) in an independent cohort of CD34+ HSPCs from 21 RAEB-2 MDS patients and 4 healthy controls (see the supplementary materials for details). Five of these eight lincRNAs were differentially expressed in MDS (P < 0.05) by qRT-PCR and RNA-Seq in both cohorts (Supplementary Fig. S1, Table S5).
For example, linc-RPIA was identified in three independent patient cohorts by three profiling technologies including RNA-Seq, microarray and RT-PCR data. The linc-RPIA-associated network is shown in Figure 4A. We investigated its correlated PCGs and miRNAs using the merged top-ranking functional network based on IPA analysis (Fig. 4B). This network predicts that linc-RPIA may be involved in regulating genes involved in cancer, including FOXO1, MDM2 and TP53. lncRNAs often act similar to competing endogenous RNAs (ceRNAs) (Salmena et al., 2011) and function as molecular ‘sponges’ attracting miRNAs, thereby preventing those miRNAs from binding to their target genes. Based on this working mechanism of ceRNAs, we predicted the binding potential of linc-RPIA and miRNAs using the miRanda algorithm (John et al., 2004). linc-RPIA potentially binds miR-429 (Fig. 4B), which belongs to the miR-200 family and has tumor-suppressive capacities (Schotte et al., 2012). In the linc-RPIA network, SHC1 was an experimentally validated target gene of miR-429 and had positive and inverse correlations with linc-RPIA and miR-429, respectively.
Fig. 4.
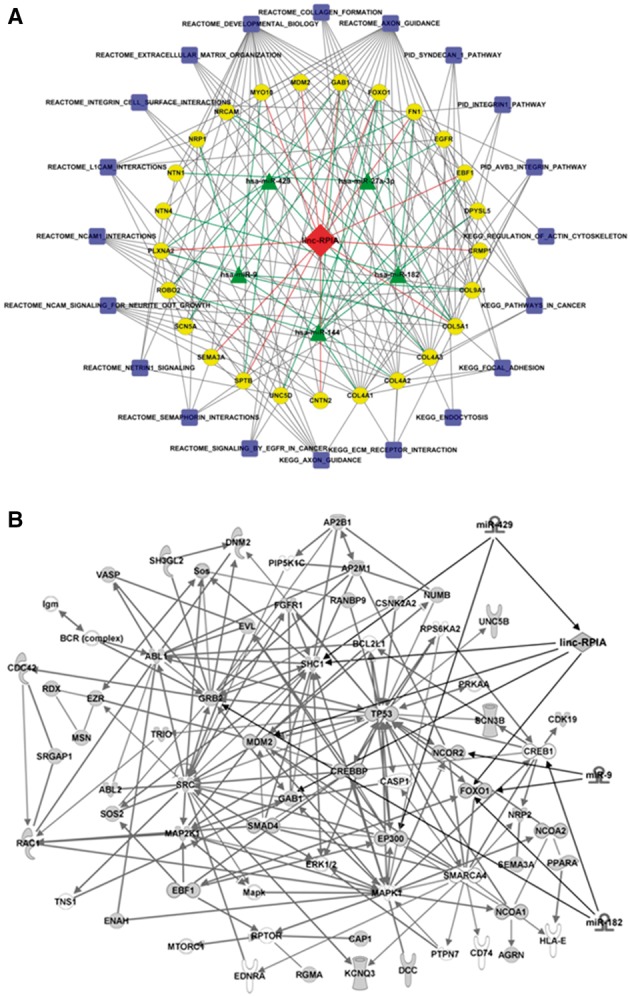
(A) Association network of linc-RPIA identified in co-module 1. In co-module 1, Linc-RPIA is predicted to regulate cancer-associated genes and is itself regulated by miR-16, miR-182 and miR-429. Most associated pathways are associated with the terms cancer or immune system. The blue squares represent pathways, the green triangles represent miRNAs, the yellow circles represent PCGs in that co-module. (B) Connected functional regulatory network for linc-RPIA. The functional networks were merged using Ingenuity Pathway Analysis (IPA). Linc-RPIA is related to TP53 and may also regulate SHC1 via an interaction with miR-429. The rhombus represents linc-RPIA. Connections between miRNAs and PCGs were obtained from IPA (Color version of this figure is available at Bioinformatics online.)
3.4 Annotating lincRNAs GO terms through network
Although the LMP network in each co-module could be constructed to associate lincRNAs with PCGs, miRNAs and signaling pathways, this analysis does not indicate which lincRNA is more important in a specific context. To resolve this issue, we used a network-based method to annotate lincRNAs with specific biological functions. We took PPIs into consideration in the analysis of LMP networks and associated corresponding GO terms with lincRNAs (see methods). The lincRNAs in each co-module were annotated with prioritized GO terms. Because the function of most lincRNAs is still unclear, we compared these data with other network-based methods (Liao et al., 2011; Wang et al., 2015) by randomly selected PCGs with known functions to evaluate the performance of our method. For each selected PCG, we searched for a set of genes functionally related to our constructed network. By doing so, we can predict the function of the selected PCGs with GO function categories, by considering the functions of their associated genes. We then compared the predicted GO terms (N_p) with known GO terms (N_k) to calculate the true positive rate (TP) and evaluate the performance using Precision = TP/N_p, and Recall = TP/N_k. The average precision and recall from the selected PCGs were used to compare the performance of our method against those published by others. Our approach significantly outperformed other methods (Supplementary Table S6) and lends support to using NLCFA to annotate lincRNA function more accurately and effectively than current alternatives.
The top ten GO terms for linc-RPIA and the other validated DE lincRNAs are listed in Supplementary Table S7. We removed the redundant GO terms using the REVIGO server. The top ten GO terms interactive and hierarchical map of linc-RPIA are shown in Supplementary Figure S2. Linc-RPIA is strongly associated with apoptosis, cell migration and cell proliferation. This result is consistent with our pathway analysis which suggests that linc-RPIA co-operates with miRNAs to regulate important cancer-related pathways (e.g. the EGFR pathway).
This observation is not limited to linc-RPIA; the association with cell migration and apoptotic process is also seen with other lincRNAs in the MDS network modules (Supplementary Table S7). Taken together, these data show that our method of associating the lincRNAs with specific functions is consistent and effective.
4 Discussion
Increasing numbers of lncRNAs have been described and annotated, but few have been functionally characterized. In this study, we used transcriptomic data from MDS and healthy CD34+ HSPCs to construct network modules consisting of lincRNAs, miRNAs and PCGs for network-based functional analysis by integrating these data with annotated signaling pathways and gene ontology. The resulting outputs provide a degree of functional annotation for differentially expressed lincRNAs in MDS and their potential role in disease pathophysiology. Importantly, these tools could be used to prioritize lincRNAs for functional validation regarding their role in disease causation and/or maintenance.
Most of the biological functions that were assigned with top rankings to lincRNAs were associated with malignancy, including those of the haematologic system. In this report we highlight results from co-module 1; however, functions of co-modules 2, 5, 6 and 7 were also significantly enriched in processes related to haematologic system development or disease. Some PCGs in these co-modules, such as RUNX1 (Bejar et al., 2011), JAK2 (Steensma et al., 2005) and PTEN (Nyakern et al., 2006), have prominent associations with MDS.
We performed an extended analysis of linc-RPIA, which was differentially expressed in RNA-Seq, microarrays and our qRT-PCR analysis cohorts (Supplementary Fig. S1). We integrated functional associations of linc-RPIA with related miRNAs and PCGs (Fig. 4). FOXO1 is co-expressed with linc-RPIA and is also regulated by miR-9 and miR-182 in this co-module. As a tumor suppressor, miR-9 is involved in the p53 related apoptotic pathway (Hsu et al., 2009) and deregulated in various types of cancers (Bandres et al., 2009; Heller et al., 2012; Tan et al., 2010). miR-9 suppresses leukemic growth (Emmrich et al., 2014) and predicts outcome in adult AML (Maki et al., 2012). miR-9 also cooperates with let-7 to inhibit the oncogenic LIN28B/HMGA2 axis. LIN28B is a highly conserved RNA-binding protein known to reprogram somatic cells into pluripotent stem cells (Yu et al., 2007). HMGA2 is a non-histone chromosomal protein which is a driver of tumor metastasis and contributes to several benign and malignant tumors (Schoenmakers et al., 1995). miR-9 is also frequently methylated and hence silenced in chronic lymphocytic leukaemia (Wang et al., 2013b). As a TLR-responsive miRNA, miR-9 induced by TLR2, TLR4 and TLR7/8 agonists is involved in the TLR-signalling pathways and innate immune responses (Bazzoni et al., 2009) where it represses its target, NF-κB subunit 1 (NFKB1) and maintains a constant level of NF-κB1 protein expression in human monocytes and neutrophils (Raisch et al., 2013). NFKB1 controls the transcription of many anti-apoptotic genes including BCL2, BCL2L1 (Bernasconi, 2008). miR-9 is frequently down-regulated, whereas BCL2 is frequently over-expressed in MDS (Calin et al., 2002; Parker et al., 2000). Conversely, IL-2-induced miR-182 inhibits FOXO1 expression and promotes clonal expansion of activated helper T cells (Stittrich et al., 2010). FOXO family members are involved in multiple pathways and several cellular processes such as cell cycle, apoptosis, metabolism, survival and tumorigenesis (Tothova et al., 2007). Akt, a primary mediator of FOXO phosphorylation, is involved in pathways of cytoprotection (Chong et al., 2002), and prevents cellular apoptosis by phosphorylating FOXO in the cytoplasm (Chong and Maiese, 2007). Following phosphorylation, FOXO1 is ubiquitinated and degraded by the proteasome (Aoki et al., 2004). In the linc-RPIA-associated network, MDM2, a suppressor of TP53, interacts with FOXO1 through Akt and TP53. MDM2 binds to FOXO1 and FOXO3A to promote their ubiquitination and degradation (Fu et al., 2009). Additionally, phosphorylation of MDM2 by Akt inhibits its interaction with ARF and enhances the degradation of TP53 (Fu et al., 2009). Our network-based annotation method suggests cross-talk between linc-RPIA and FOXO1, MDM2 and TP53 in MDS, implicating this linc-RPIA in key oncogenic signalling pathways.
We also showed that linc-RPIA may regulate SHC1 via an interaction with miR-429 (Fig. 4). SHC1 encodes three protein isoforms: p46Shc, p52Shc and p66Shc. p46Shc and p52Shc bind the adaptor protein Grb2, which then recruits SOS1 and GAB1 to activate the Ras/MEK/Erk and PI3K/Akt pathways (Zheng et al., 2013). SHC1 and GAB1 are considered significant molecular biomarkers in cancer (Brown et al., 2008; Huang et al., 2014; Seiden-Long et al., 2008). GAB1 also feeds into the RAS pathway, because sustained activation of RAS requires both GAB1-dependent and SOS1-dependent pathways. Together, these relationships suggest that linc-RPIA also plays a role in modulating RAS signaling pathways. The lincRNA-miRNA-PCGs triplet analysis detected cooperation of lincRNAs with other biological molecules in specific biological processes. In summary, our approach has identified linc-RPIA as a differentially expressed lincRNA in the RAEB-2 subtype of MDS, and implicated it in regulation of key cancer pathways.
This is the first study to profile and compare lincRNA expression profiles in normal CD34+ HSPCs and MDS cells. We have identified and validated a number of differentially expressed lincRNAs that warrant further experimental investigation. Our results further illustrate the value of using network characteristics to annotate potential functional characteristics to differentially expressed lincRNAs, and provide a framework for experimental validation of gene function. Our tools could be applied to other disease processes where comparable datasets are available.
Supplementary Material
Acknowledgements
The authors thank the members of Center for Bioinformatics and Systems Biology at Wake Forest School of Medicine. We acknowledge the Texas Advanced Computing Center (TACC) at the University of Texas at Austin and the DEMON high-performance computing (HPC) cluster at Wake Forest School of Medicine for providing HPC resources.
Funding
This work has been supported by the National Institutes of Health [1U01CA166886, 1U01AR069395, 1R01GM123037 and 1U01HL111560], National Health and Medical Research Council of Australia (NHMRC), Cure Cancer Foundation, Anthony Rothe Memorial Trust, and The Translational Cancer Research Network of the Cancer Institute of New South Wales (CINSW) and Fellowships from the NHMRC and CINSW (DB). This project is also partially funded by NSFC No.61373105 and No.61672422. Funding for open access charge: National Institutes of Health [1R01LM010185 and 1U01CA166886].
Conflict of Interest: none declared.
References
- Alessandrino E.P. et al. (2001) Myelodysplastic syndromes: recent advances. Haematologica, 86, 1124–1157. [PubMed] [Google Scholar]
- Aoki M. et al. (2004) Proteasomal degradation of the FoxO1 transcriptional regulator in cells transformed by the P3k and Akt oncoproteins. Proc. Natl. Acad. Sci. U. S. A., 101, 13613–13617. [DOI] [PMC free article] [PubMed] [Google Scholar]
- Ashburner M. et al. (2000) Gene ontology: tool for the unification of biology. The Gene Ontology Consortium. Nat. Genet., 25, 25–29. [DOI] [PMC free article] [PubMed] [Google Scholar]
- Bandres E. et al. (2009) Epigenetic regulation of microRNA expression in colorectal cancer. Int. J. Cancer, 125, 2737–2743. [DOI] [PubMed] [Google Scholar]
- Bazzoni F. et al. (2009) Induction and regulatory function of miR-9 in human monocytes and neutrophils exposed to proinflammatory signals. Proc. Natl. Acad. Sci. U. S. A., 106, 5282–5287. [DOI] [PMC free article] [PubMed] [Google Scholar]
- Bejar R. et al. (2011) Clinical effect of point mutations in myelodysplastic syndromes. N. Engl. J. Med., 364, 2496–2506. [DOI] [PMC free article] [PubMed] [Google Scholar]
- Benjamini Y., Hochberg Y. (1995) Controlling the false discovery rate – a practical and powerful approach to multiple testing. J. R. Stat. Soc. B Met., 57, 289–300. [Google Scholar]
- Bernasconi P. (2008) Molecular pathways in myelodysplastic syndromes and acute myeloid leukemia: relationships and distinctions – a review. Br. J. Haematol., 142, 695–708. [DOI] [PubMed] [Google Scholar]
- Brown L.A. et al. (2008) Amplification of 11q13 in ovarian carcinoma. Genes Chromosomes Cancer, 47, 481–489. [DOI] [PubMed] [Google Scholar]
- Cabili M.N. et al. (2011) Integrative annotation of human large intergenic noncoding RNAs reveals global properties and specific subclasses. Genes Dev., 25, 1915–1927. [DOI] [PMC free article] [PubMed] [Google Scholar]
- Calin G.A. et al. (2002) Frequent deletions and down-regulation of micro-RNA genes miR15 and miR16 at 13q14 in chronic lymphocytic leukemia. Proc. Natl. Acad. Sci. U. S. A., 99, 15524–15529. [DOI] [PMC free article] [PubMed] [Google Scholar]
- Cheetham S.W. et al. (2013) Long noncoding RNAs and the genetics of cancer. Br. J. Cancer, 108, 2419–2425. [DOI] [PMC free article] [PubMed] [Google Scholar]
- Chen X. (2015a) KATZLDA: KATZ measure for the lncRNA-disease association prediction. Sci. Rep., 5, 16840.. [DOI] [PMC free article] [PubMed] [Google Scholar]
- Chen X. (2015b) Predicting lncRNA-disease associations and constructing lncRNA functional similarity network based on the information of miRNA. Sci. Rep., 5, 13186.. [DOI] [PMC free article] [PubMed] [Google Scholar]
- Chen X. et al. (2016a) FMLNCSIM: fuzzy measure-based lncRNA functional similarity calculation model. Oncotarget, 7, 45948–45958. [DOI] [PMC free article] [PubMed] [Google Scholar]
- Chen X. et al. (2016b) IRWRLDA: improved random walk with restart for lncRNA-disease association prediction. Oncotarget, 7, 57919–57931. [DOI] [PMC free article] [PubMed] [Google Scholar]
- Chong Z.Z. et al. (2002) Erythropoietin is a novel vascular protectant through activation of Akt1 and mitochondrial modulation of cysteine proteases. Circulation, 106, 2973–2979. [DOI] [PubMed] [Google Scholar]
- Chong Z.Z., Maiese K. (2007) Erythropoietin involves the phosphatidylinositol 3-kinase pathway, 14-3-3 protein and FOXO3a nuclear trafficking to preserve endothelial cell integrity. Br. J. Pharmacol., 150, 839–850. [DOI] [PMC free article] [PubMed] [Google Scholar]
- De Santa F. et al. (2010) A large fraction of extragenic RNA pol II transcription sites overlap enhancers. PLoS Biol., 8, e1000384. [DOI] [PMC free article] [PubMed] [Google Scholar]
- Derrien T. et al. (2012) The GENCODE v7 catalog of human long noncoding RNAs: analysis of their gene structure, evolution, and expression. Genome Res., 22, 1775–1789. [DOI] [PMC free article] [PubMed] [Google Scholar]
- Dostalova Merkerova M. et al. (2011) Distinctive microRNA expression profiles in CD34+ bone marrow cells from patients with myelodysplastic syndrome. Eur. J. Hum. Genet. EJHG, 19, 313–319. [DOI] [PMC free article] [PubMed] [Google Scholar]
- Edgar R. et al. (2002) Gene Expression Omnibus: NCBI gene expression and hybridization array data repository. Nucleic Acids Res., 30, 207–210. [DOI] [PMC free article] [PubMed] [Google Scholar]
- Emmrich S. et al. (2014) miR-9 is a tumor suppressor in pediatric AML with t(8;21). Leukemia, 28, 1022–1032. [DOI] [PubMed] [Google Scholar]
- Fu W. et al. (2009) MDM2 acts downstream of p53 as an E3 ligase to promote FOXO ubiquitination and degradation. J. Biol. Chem., 284, 13987–14000. [DOI] [PMC free article] [PubMed] [Google Scholar]
- Garzon R. et al. (2014) Expression and prognostic impact of lncRNAs in acute myeloid leukemia. Proc. Natl. Acad. Sci. U. S. A., 111, 18679–18684. [DOI] [PMC free article] [PubMed] [Google Scholar]
- Goff L. et al. (2013) cummeRbund: Analysis, exploration, manipulation, and visualization of Cufflinks high-throughput sequencing data. R package version 2.18.0.
- Guo X. et al. (2013) Long non-coding RNAs function annotation: a global prediction method based on bi-colored networks. Nucleic Acids Res., 41, e35. [DOI] [PMC free article] [PubMed] [Google Scholar]
- Guttman M. et al. (2009) Chromatin signature reveals over a thousand highly conserved large non-coding RNAs in mammals. Nature, 458, 223–227. [DOI] [PMC free article] [PubMed] [Google Scholar]
- Guttman M. et al. (2011) lincRNAs act in the circuitry controlling pluripotency and differentiation. Nature, 477, 295–300. [DOI] [PMC free article] [PubMed] [Google Scholar]
- Harris N.L. et al. (2000) The World Health Organization classification of neoplasms of the hematopoietic and lymphoid tissues: report of the Clinical Advisory Committee meeting – Airlie House, Virginia, November, 1997. Hematol. J. Off. J. Eur. Haematol. Assoc. EHA, 1, 53–66. [DOI] [PubMed] [Google Scholar]
- Heller G. et al. (2012) Genome-wide miRNA expression profiling identifies miR-9-3 and miR-193a as targets for DNA methylation in non-small cell lung cancers. Clin. Cancer Res. Off. J. Am. Assoc. Cancer Res., 18, 1619–1629. [DOI] [PubMed] [Google Scholar]
- Hirai H. (2003) Molecular mechanisms of myelodysplastic syndrome. Jpn. J. Clin. Oncol., 33, 153–160. [DOI] [PubMed] [Google Scholar]
- Howe R.B. et al. (2004) The WHO classification of MDS does make a difference. Blood, 103, 3265–3270. [DOI] [PubMed] [Google Scholar]
- Hsu P.Y. et al. (2009) Xenoestrogen-induced epigenetic repression of microRNA-9-3 in breast epithelial cells. Cancer Res., 69, 5936–5945. [DOI] [PMC free article] [PubMed] [Google Scholar]
- Hsu S.D. et al. (2011) miRTarBase: a database curates experimentally validated microRNA-target interactions. Nucleic Acids Res., 39, D163–D169. [DOI] [PMC free article] [PubMed] [Google Scholar]
- Huang C. et al. (2014) Identification of melanoma biomarkers based on network modules by integrating the human signaling network with microarrays. J. Cancer Res. Therap., 10, C114–C124. [DOI] [PubMed] [Google Scholar]
- Huang Y.A. et al. (2016) ILNCSIM: improved lncRNA functional similarity calculation model. Oncotarget, 7, 25902–25914. [DOI] [PMC free article] [PubMed] [Google Scholar]
- Huarte M. et al. (2010) A large intergenic noncoding RNA induced by p53 mediates global gene repression in the p53 response. Cell, 142, 409–419. [DOI] [PMC free article] [PubMed] [Google Scholar]
- Hung T. et al. (2011) Extensive and coordinated transcription of noncoding RNAs within cell-cycle promoters. Nat. Genet., 43, 621–U196. [DOI] [PMC free article] [PubMed] [Google Scholar]
- John B. et al. (2004) Human MicroRNA targets. PLoS Biol., 2, e363. [DOI] [PMC free article] [PubMed] [Google Scholar]
- Joshi-Tope G. et al. (2005) Reactome: a knowledgebase of biological pathways. Nucleic Acids Res., 33, D428–D432. [DOI] [PMC free article] [PubMed] [Google Scholar]
- Kanehisa M., Goto S. (2000) KEGG: kyoto encyclopedia of genes and genomes. Nucleic Acids Res., 28, 27–30. [DOI] [PMC free article] [PubMed] [Google Scholar]
- Khalil A.M. et al. (2009) Many human large intergenic noncoding RNAs associate with chromatin-modifying complexes and affect gene expression. Proc. Natl. Acad. Sci. U. S. A., 106, 11667–11672. [DOI] [PMC free article] [PubMed] [Google Scholar]
- Krek A. et al. (2005) Combinatorial microRNA target predictions. Nat. Genet., 37, 495–500. [DOI] [PubMed] [Google Scholar]
- Langfelder P. et al. (2008) Defining clusters from a hierarchical cluster tree: the Dynamic Tree Cut package for R. Bioinformatics, 24, 719–720. [DOI] [PubMed] [Google Scholar]
- Langmead B., Salzberg S.L. (2012) Fast gapped-read alignment with Bowtie 2. Nat. Methods, 9, 357–359. [DOI] [PMC free article] [PubMed] [Google Scholar]
- Lewis B.P. et al. (2005) Conserved seed pairing, often flanked by adenosines, indicates that thousands of human genes are microRNA targets. Cell, 120, 15–20. [DOI] [PubMed] [Google Scholar]
- Li J.H. et al. (2014) starBase v2.0: decoding miRNA-ceRNA, miRNA-ncRNA and protein-RNA interaction networks from large-scale CLIP-Seq data. Nucleic Acids Res., 42, D92–D97. [DOI] [PMC free article] [PubMed] [Google Scholar]
- Liao Q. et al. (2011) Large-scale prediction of long non-coding RNA functions in a coding-non-coding gene co-expression network. Nucleic Acids Res., 39, 3864–3878. [DOI] [PMC free article] [PubMed] [Google Scholar]
- Liberzon A. et al. (2011) Molecular signatures database (MSigDB) 3.0. Bioinformatics, 27, 1739–1740. [DOI] [PMC free article] [PubMed] [Google Scholar]
- Liu L. et al. (2015a) Modeling the relationship of epigenetic modifications to transcription factor binding. Nucleic Acids Res., 43, 3873–3885. [DOI] [PMC free article] [PubMed] [Google Scholar]
- Liu L. et al. (2015b) Mutated genes and driver pathways involved in myelodysplastic syndromes-a transcriptome sequencing based approach. Mol. bioSystems, 11, 2158–2166. [DOI] [PMC free article] [PubMed] [Google Scholar]
- Liu Y. et al. (2010) Myelodysplasia: battle in the bone marrow. Nat. Med., 16, 30–32. [DOI] [PubMed] [Google Scholar]
- Loewer S. et al. (2010) Large intergenic non-coding RNA-RoR modulates reprogramming of human induced pluripotent stem cells. Nat. Genet., 42, 1113–1117. [DOI] [PMC free article] [PubMed] [Google Scholar]
- Maki K. et al. (2012) Aberrant expression of MIR9 indicates poor prognosis in acute myeloid leukaemia. Br. J. Haematol., 158, 283–285. [DOI] [PubMed] [Google Scholar]
- Mills K.I. et al. (2009) Microarray-based classifiers and prognosis models identify subgroups with distinct clinical outcomes and high risk of AML transformation of myelodysplastic syndrome. Blood, 114, 1063–1072. [DOI] [PubMed] [Google Scholar]
- Nishimura D. (2004) BioCarta. Biotechnol. Softw. Internet Rep., 2, 117–120. [Google Scholar]
- Nyakern M. et al. (2006) Frequent elevation of Akt kinase phosphorylation in blood marrow and peripheral blood mononuclear cells from high-risk myelodysplastic syndrome patients. Leukemia, 20, 230–238. [DOI] [PubMed] [Google Scholar]
- Parker J.E. et al. (2000) The role of apoptosis, proliferation, and the Bcl-2-related proteins in the myelodysplastic syndromes and acute myeloid leukemia secondary to MDS. Blood, 96, 3932–3938. [PubMed] [Google Scholar]
- Pellagatti A. et al. (2006) Gene expression profiles of CD34+ cells in myelodysplastic syndromes: involvement of interferon-stimulated genes and correlation to FAB subtype and karyotype. Blood, 108, 337–345. [DOI] [PubMed] [Google Scholar]
- Ponjavic J. et al. (2007) Functionality or transcriptional noise? Evidence for selection within long noncoding RNAs. Genome Res., 17, 556–565. [DOI] [PMC free article] [PubMed] [Google Scholar]
- Raisch J. et al. (2013) Role of microRNAs in the immune system, inflammation and cancer. World J. Gastroenterol., 19, 2985–2996. [DOI] [PMC free article] [PubMed] [Google Scholar]
- Rapicavoli N.A. et al. (2013) A mammalian pseudogene lncRNA at the interface of inflammation and anti-inflammatory therapeutics. Elife, 2, e00762. [DOI] [PMC free article] [PubMed] [Google Scholar]
- Rhyasen G.W., Starczynowski D.T. (2012) Deregulation of microRNAs in myelodysplastic syndrome. Leukemia, 26, 13–22. [DOI] [PubMed] [Google Scholar]
- Rinn J.L., Chang H.Y. (2012) Genome regulation by long noncoding RNAs. Annu. Rev. Biochem., 81, 145–166. [DOI] [PMC free article] [PubMed] [Google Scholar]
- Salmena L. et al. (2011) A ceRNA hypothesis: the Rosetta Stone of a hidden RNA language? Cell, 146, 353–358. [DOI] [PMC free article] [PubMed] [Google Scholar]
- Schaefer C.F. et al. (2009) PID: the Pathway Interaction Database. Nucleic Acids Res., 37, D674–D679. [DOI] [PMC free article] [PubMed] [Google Scholar]
- Schoenmakers E.F. et al. (1995) Recurrent rearrangements in the high mobility group protein gene, HMGI-C, in benign mesenchymal tumours. Nat. Genet., 10, 436–444. [DOI] [PubMed] [Google Scholar]
- Schotte D. et al. (2012) MicroRNAs in acute leukemia: from biological players to clinical contributors. Leukemia, 26, 1–12. [DOI] [PubMed] [Google Scholar]
- Seiden-Long I. et al. (2008) Gab1 but not Grb2 mediates tumor progression in Met overexpressing colorectal cancer cells. Carcinogenesis, 29, 647–655. [DOI] [PubMed] [Google Scholar]
- Spizzo R. et al. (2012) Long non-coding RNAs and cancer: a new frontier of translational research? Oncogene, 31, 4577–4587. [DOI] [PMC free article] [PubMed] [Google Scholar]
- Steensma D.P. et al. (2005) The JAK2 V617F activating tyrosine kinase mutation is an infrequent event in both ‘atypical’ myeloproliferative disorders and myelodysplastic syndromes. Blood, 106, 1207–1209. [DOI] [PMC free article] [PubMed] [Google Scholar]
- Stittrich A.-B. et al. (2010) The microRNA miR-182 is induced by IL-2 and promotes clonal expansion of activated helper T lymphocytes. Nat. Immunol., 11, 1057–1062. [DOI] [PubMed] [Google Scholar]
- Suresh V. et al. (2015) RPI-Pred: predicting ncRNA–protein interaction using sequence and structural information. Nucleic Acids Res., 43, 1370–1379. [DOI] [PMC free article] [PubMed] [Google Scholar]
- Tahira A.C. et al. (2011) Long noncoding intronic RNAs are differentially expressed in primary and metastatic pancreatic cancer. Mol. Cancer, 10, 141. [DOI] [PMC free article] [PubMed] [Google Scholar]
- Tan H.X. et al. (2010) MicroRNA-9 reduces cell invasion and E-cadherin secretion in SK-Hep-1 cell. Med. Oncol., 27, 654–660. [DOI] [PubMed] [Google Scholar]
- Tothova Z. et al. (2007) FoxOs are critical mediators of hematopoietic stem cell resistance to physiologic oxidative stress. Cell, 128, 325–339. [DOI] [PubMed] [Google Scholar]
- Trapnell C. et al. (2013) Differential analysis of gene regulation at transcript resolution with RNA-seq. Nat. Biotechnol., 31, 46–53. [DOI] [PMC free article] [PubMed] [Google Scholar]
- Trapnell C. et al. (2009) TopHat: discovering splice junctions with RNA-Seq. Bioinformatics, 25, 1105–1111. [DOI] [PMC free article] [PubMed] [Google Scholar]
- Trapnell C. et al. (2010) Transcript assembly and quantification by RNA-Seq reveals unannotated transcripts and isoform switching during cell differentiation. Nat. Biotechnol., 28, 511–515. [DOI] [PMC free article] [PubMed] [Google Scholar]
- Vanunu O. et al. (2010) Associating genes and protein complexes with disease via network propagation. PLoS Comput. Biol., 6, e1000641. [DOI] [PMC free article] [PubMed] [Google Scholar]
- Wang H. et al. (2013a) Discovering transcription and splicing networks in myelodysplastic syndromes. PloS One, 8, e79118. [DOI] [PMC free article] [PubMed] [Google Scholar]
- Wang L.Q. et al. (2013b) Epigenetic inactivation of miR-9 family microRNAs in chronic lymphocytic leukemia–implications on constitutive activation of NFkappaB pathway. Mol. Cancer, 12, 173.. [DOI] [PMC free article] [PubMed] [Google Scholar]
- Wang P. et al. (2015) Identification of lncRNA-associated competing triplets reveals global patterns and prognostic markers for cancer. Nucleic Acids Res., 43, 3478–3489. [DOI] [PMC free article] [PubMed] [Google Scholar]
- Xu D. et al. (2013) Long noncoding RNAs associated with liver regeneration 1 accelerates hepatocyte proliferation during liver regeneration by activating Wnt/beta-catenin signaling. Hepatology, 58, 739–751. [DOI] [PubMed] [Google Scholar]
- Yu J. et al. (2007) Induced pluripotent stem cell lines derived from human somatic cells. Science, 318, 1917–1920. [DOI] [PubMed] [Google Scholar]
- Zheng L.L. et al. (2016) deepBase v2.0: identification, expression, evolution and function of small RNAs, LncRNAs and circular RNAs from deep-sequencing data. Nucleic Acids Res., 44, D196–D202. [DOI] [PMC free article] [PubMed] [Google Scholar]
- Zheng Y. et al. (2013) Temporal regulation of EGF signalling networks by the scaffold protein Shc1. Nature, 499, 166–171. [DOI] [PMC free article] [PubMed] [Google Scholar]
Associated Data
This section collects any data citations, data availability statements, or supplementary materials included in this article.