Abstract
Motivation
A heterogeneous network topology possessing abundant interactions between biomedical entities has yet to be utilized in similarity-based methods for predicting drug–target associations based on the array of varying features of drugs and their targets. Deep learning reveals features of vertices of a large network that can be adapted in accommodating the similarity-based solutions to provide a flexible method of drug–target prediction.
Results
We propose a similarity-based drug–target prediction method that enhances existing association discovery methods by using a topology-based similarity measure. DeepWalk, a deep learning method, is adopted in this study to calculate the similarities within Linked Tripartite Network (LTN), a heterogeneous network generated from biomedical linked datasets. This proposed method shows promising results for drug–target association prediction: 98.96% AUC ROC score with a 10-fold cross-validation and 99.25% AUC ROC score with a Monte Carlo cross-validation with LTN. By utilizing DeepWalk, we demonstrate that: (i) this method outperforms other existing topology-based similarity computation methods, (ii) the performance is better for tripartite than with bipartite networks and (iii) the measure of similarity using network topology outperforms the ones derived from chemical structure (drugs) or genomic sequence (targets). Our proposed methodology proves to be capable of providing a promising solution for drug–target prediction based on topological similarity with a heterogeneous network, and may be readily re-purposed and adapted in the existing of similarity-based methodologies.
Availability and Implementation
The proposed method has been developed in JAVA and it is available, along with the data at the following URL: https://github.com/zongnansu1982/drug-target-prediction.
Supplementary information
Supplementary data are available at Bioinformatics online.
1 Introduction
Drugs may interact with molecular targets to potentially treat a plethora of diseases. Therefore, drug–target predictions play an important role in drug discovery and drug repurposing. Due to the costly biochemical experimentation (in vitro) of drug–target discovery, the pharmaceutical industry tends to focus on solely identifying particular families of ‘druggable’ proteins and developing chemical compounds that bring desired effects on them (Yıldırım et al., 2007). Researchers investigate only a few complete pharmacological profiles of desired target proteins and these small molecules are rarely systematically screened (Vogt and Mestres, 2010). Although target-specific drugs are traditionally favored in research, the pharmaceutical industry is now exploring poly-pharmacology and the repurposing of existing drugs, as seen in cases of anticancer drugs imatinib (Gleevec) and sunitinib (Sutent) (or, thalidomide, sildenafil, bupropion and fluoxetine) (Cheng et al., 2012; Yıldırım et al., 2007). The comprehensive understanding of drug–target associations, however, is relatively limited compared to the large number of chemical compounds and proteins discovered; this gap in knowledge is a strong incentive to predict associations between existing drugs and its targets (Ding et al., 2014; Yamanishi et al., 2008).
Computational (in silico) methods can complement and guide these laborious and costly experiments. Early attempts of computational prediction, using docking simulations (Cheng et al., 2007) and text mining methods (Zhu et al., 2005), are neither scalable nor adequate to handle the proteins missing 3-dimentional structure information. Also, mining an ever growing and complex scientific literature database containing redundant protein and gene names presents a challenge. To overcome these limitations, researchers have adopted diverse machine learning methods, such as classification methods (Ding et al., 2014), and rule-based inference methods (Cheng et al., 2012; Yamanishi et al., 2008) to predict drug–target s associations. Similarity measures are fundamental to these methodologies. For example, the similarity measures of drug–drug and target–target pairs can be utilized for the weighting of potential associations (Cheng et al., 2012; Yamanishi et al., 2008), or to generate distinct kernel functions to train the different classification models (Bleakley and Yamanishi, 2009; Jacob and Vert, 2008; van Laarhoven et al., 2011; Xia et al., 2010). Associating two components provides solutions for practical scenarios by finding the best combinations (Perlman et al., 2011; Yamanishi et al., 2010); leading to flexible solutions in drug–target prediction. In particular, the chemical structure (Yamanishi et al., 2008), pharmacological features (Yamanishi et al., 2010), genomic sequence (Bleakley and Yamanishi, 2009; Jacob and Vert, 2008; Yamanishi et al., 2008) may all be used for the similarity measure.
Recent studies show that the abundant topological interactions between biomedical entities in heterogeneous networks appear to be valuable for assisting in predictions (Chen et al., 2012a, b; Cheng et al., 2012; Palma et al., 2014; Wang et al., 2013). However, these topology-based methods are incapable of computing the topological similarities between biological entities; they cannot be reused and adapted in the existing similarity-based methods. Deep learning methods provide a solution for extracting features of vertices in a large network and can be adapted to compute topological similarities of two vertices (Perozzi et al., 2014; Tang et al., 2015). Therefore, adopting deep learning methods for topological similarity measure provides tremendous value in drug–target prediction by reusing and adapting the existing similarity-based methods.
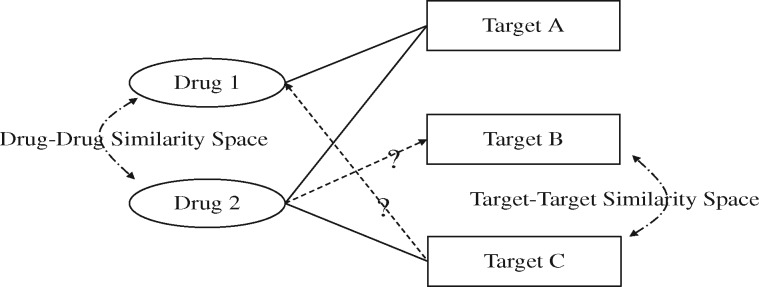
Here, we propose a similarity-based drug–target prediction method that adopts a deep learning algorithm, DeepWalk (Perozzi et al., 2014), to calculate the similarities for drug–drug and target–target pairs based on the topology of a heterogeneous network named Tripartite Linked Network (TLN), derived from the existing linked open datasets in biomedical domain (a.k.a., biomedical linked data in this article) (Bizer et al., 2009). The resulting similarity measure is used to infer drug–target association based on the ‘guilt-by-association’ principle (Bass et al., 2013) that uses drug–drug and target–target similarities as the input for drug–target prediction (Fig. 1). We benchmark DeepWalk to seven similarity computation methods (Bass et al., 2013; Tang et al., 2015) based on the bipartite and tripartite networks (drug, disease and target network), as well as two methods based on chemical structure and the genomic sequence (Bass et al., 2013; Ding et al., 2014; Yamanishi et al., 2008). Specifically, we have evaluated our method for the following benchmarks: (i) performance of a deep learning method compared to other topology-based similarity methods, (ii) value of multipartite (tripartite) network over bipartite networks and (iii) performance of topology-based similarity method over the ones relying on chemical structure and genomic sequence. The proposed method shows promising results in the drug–target association prediction, e.g. 98.96% AUC ROC score with a 10-fold cross-validation and 99.25% AUC ROC score with a Monte Carlo cross-validation. The proposed method is proven to be capable of providing a flexible solution for drug–target prediction based on a heterogeneous network and can be easily reused and adapted in the excising similarity-based methods.
Fig. 1.
Drug–target prediction based on ‘guilt-by-association’ principle. Two inputs are used: (1) the solid lines are the existing drug–target associations used as known knowledge, and (2) the dashed lines are calculated with similarity measures for drug–drug and target–target pairs. The output is the predicted associations represented with the dash lines. The ‘guilt-by-association’ principle postulates that if a vertex with unknown property shares a similar interaction profile with a vertex with known property, the former may also share the same property with the latter
2 Materials and methods
2.1 Pipeline of similarity-based drug–target prediction with heterogeneous network
The drug–target prediction method we propose is based on the topology of multipartite network of the existing drugs and protein targets. The association discovery pipeline can be separated into three steps: (i) Data preparation and benchmarking, (ii) similarity learning and (iii) association discovery. First, a multipartite network that contains the topological interactions of the existing drugs and targets is constructed with the biomedical linked data (Fig. 2). Then, the similarity scores of the drug–drug and target–target pairs are learned based on the topology of the network. Finally, new drug–target associations are discovered and evaluated based on these similarities.
Fig. 2.
Pipeline of the drug–target association discovery
2.2 Data preparation and benchmarking
This study utilized information of the various drugs, targets and diseases to form a tripartite network called Linked Tripartite Network (LTN), with the drugs, targets and diseases as the vertices and the drug–target, drug–disease and disease–target associations as the edges.
We obtained the drugs, targets and drug–target associations from DrugBank (Wishart et al., 2008) which ascertains data-rich molecular biology content found in curated sequence databases, medicinal chemistry textbooks and chemical reference handbooks, and validates the collected data with the journal articles and textbooks. We used DrugBank (version 3, generated in 2011) downloaded from (http://wifo5-03.informatik.uni-mannheim.de/drugbank/) to extract a bipartite network, which contained 4553 targets, 4408 drugs and 12 045 drug–target associations.
To form the LTN, we extracted the diseases, drug–disease and disease-gene associations from a human disease network (Goh et al., 2007) named Diseasome (http://wifo5-03.informatik.uni-mannheim.de/diseasome/), and merged these associations with the bipartite network we obtained from DrugBank. The disease–target association was created by mapping targets of DrugBank to the genes of the disease-gene associations in Diseasome based on Bio2rdf (Belleau et al., 2008), Uniprot (Consortium, 2008), HGNC (Povey et al., 2001) and OMIM (Hamosh et al., 2005). We obtained a LTN consisting of 1452 diseases, 8201 drug–disease and 1684 disease–target associations (Table 1).
Table 1.
Statistics for the Linked Tripartite Network (LTN)
| Name | Statistics |
|---|---|
| # Target (DrugBank) | 4553 |
| # Drugs (DrugBank) | 4408 |
| # Disease (Diseasome) | 1452 |
| # Drug–target associations (DrugBank) | 12 045 |
| # Drug–disease associations (Diseasome) | 8201 |
| # Disease–target associations (Diseasome) | 1684 |
| Average degree of drugs (bipartite network) | 2.73 |
| Average degree of targets (bipartite network) | 2.65 |
| Average degree of drugs (tripartite network) | 4.59 |
| Average degree of targets (tripartite network) | 3.02 |
| Average degree of diseases (tripartite network) | 6.61 |
2.3 Similarity learning
DeepWalk (Perozzi et al., 2014), a deep learning method, vectorizes the vertices (e.g. drugs and targets) in the network for similarity computation. This method obtains the local latent information of topology based on truncated random walks and maximizes the probability of a next vertex given the previous vertices in these walks. Two components are inherent in DeepWalk: (i) for each vertex , times of random walks with length are conducted with as the starting vertex, and (ii) for each walk, the SkipGram (Mikolov et al., 2013) algorithm updates the vertex representation. SkipGram maximizes the co-occurrence probability among the vertices within a window using the assumption as follows,
| (1) |
where is the latent topological representation associated with each vertex . is modeled with a matrix, where is the cardinality of vertex set , and is the dimension user input. is approximated with Hierarchial Softmax (Mnih and Hinton, 2008) by assigning the vertices to the leaves of a Huffman tree, and can be computed as,
| (2) |
where ) and is the representation assigned to the vertex ’s parent. ) is a sequence of tree vertices to identify the vertex , where and .
The similarity of two vertices and is calculated as follows,
| (3) |
where is the dimension, and , are the components of vector and respectively.
In practice, the DeepWalk method is obtained from deeplearning4j library (http://deeplearning4j.org/).
2.4 Association discovering
We adapted two popular rule-based inference methods (Cheng et al., 2012; Yamanishi et al., 2008), drug-based similarity inference (DBSI) and target-based similarity inference (TBSI), to discover the drug–target associations with the similarities obtained in Section 2.3.
DBSI predicts a drug–target association if a drug is similar with a drug that has an existing association with a target . For a pair of , a confidence score of the pair is calculated as,
| (4) |
where is the similarity between and , and if there is an existing association between and otherwise .
Similarly, TBSI predicts a drug–target association if a drug is associated with a target that has a similar target . For a pair of , a confidence score of the pair is calculated as,
| (5) |
where is the similarity between and , and if there is an existing association between and otherwise .
Operationally, for a drug or a target as the input query, the DBSI and TBSI confidences are normalized as,
| (6) |
| (7) |
where is the maximum confidence and is the minimum confidence for , and is the maximum confidence and is the minimum confidence for .
2.5 Validation and evaluation metrics
We evaluated the predictions using three kinds of validation methods based on internal and external references in each test, and reported Area Under the Receiver Operating Characteristic Curve and Recovered Fraction as the evaluation metrics.
To perform the internal validation, we implemented a 10-fold cross-validation (Wang et al., 2013), where conventionally a dataset is partitioned into 10 subsets: one subset used for testing and nine subsets for training across multiple iterations. We needed to restrict the evaluation and benchmarking of our method to the similarity measure itself, and eliminate the impact of the inference-based method (TBSI or DBSI). For this reason, we ensured that the random partition of associations for generating the test set did not create isolated vertices in the training set that hindered the performance of DBSI and TBSI. Thus, we first randomly extracted a set of associations , making sure that no isolated vertices are created. We then derived , which is the complement of in the association space. The associations were randomly partitioned into 10 subsets . Note that each subset of may contain isolated vertices. In each test of ten, a subset was used as a gold standard for testing while the nine remaining subsets of as well as were used as the training set. We also performed a Monte Carlo validation (Seal et al., 2015), where the set of associations were randomly partitioned into two parties, with the cardinality of M and , and used as gold standard predictions for the test and the rest subsets and were used as the training set. For the validation with the external reference, we used the whole dataset as our training set and validated the predictions with the newly discovered drug–target associations. In practice, a recent version of DrugBank downloaded from Bio2rdf (release 4, published in 2015, http://download.bio2rdf.org/release/4/) was used as the external reference. The targets in release 4 used different IDs from the DrugBank version 3, so we mapped them based on the uniprot IDs, which were kept the same in the two versions. Additionally, we removed the associations connected with the drugs or targets that did not exist in the DrugBank version 3 and used only the remaining new associations as the gold standard.
We calculated Area Under the Receiver Operating Characteristic Curve (AUC) and Recovered Fraction (RF) (Cheng et al., 2012; Seal et al., 2015), to assess the quality of the predicted associations. The AUC was obtained with the rankings of the true positives in a prediction list. We computed AUC with the ROC JAVA library (https://github.com/kboyd/Roc). RF in top N was obtained from , where was the number of true positive predicted associations in th query and was the number of missing associations in the gold standard.
3 Results
3.1 Comparison with topology-based similarity measures in bipartite network
In this analysis, we implemented DeepWalk using both DBSI and TBSI association discovery models in association with the topology-based similarity measures using the bipartite network for the drug–target prediction. We computed six association indices used for similarity computation in bipartite networks (Bass et al., 2013), which were Jaccard, Simpson, Geometric, Cosine, Pearson Correlation Coefficient (PCC) and Hypergeometric, and compared them with the DeepWalk results.
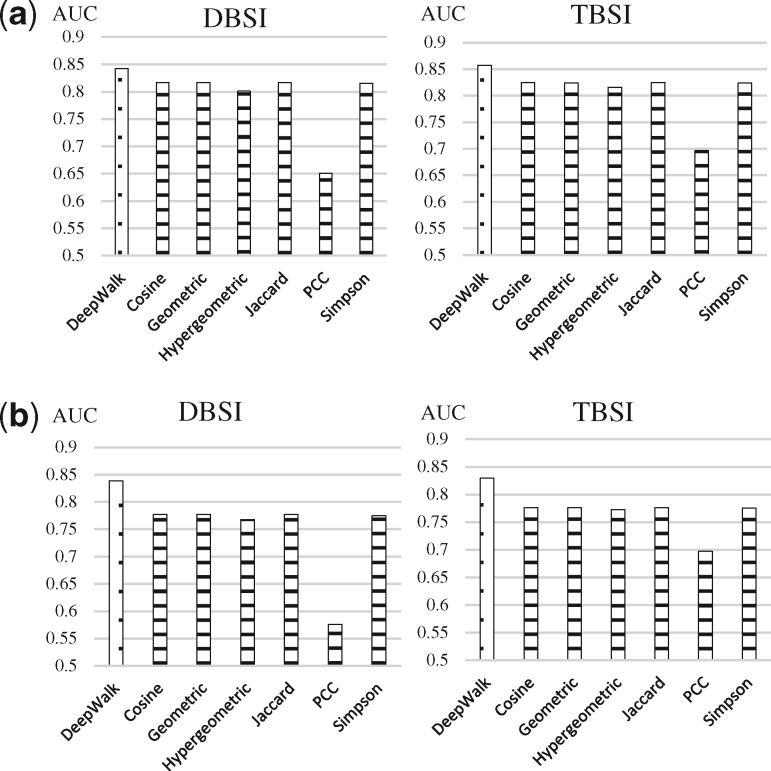
DeepWalk performed similarly to the other similarity measures in ten-fold validation (Fig. 3a, DBSI: 84.23% and TBSI: 85.75%) with the internal reference and demonstrated a slightly better performance with the external reference (Fig. 3b, DBSI: 83.86% and TBSI: 82.94%). The traditional similarity methods were almost indistinguishable in both validations except PCC (DBSI: 65.08% and TBSI: 69.63% in the ten-fold validation, DBSI: 57.53% and TBSI: 69.74% in the external validation).
Fig. 3.
Comparison of average AUC scores in two validations over bipartite network. DeepWalk is represented with a dotted bar while the others are represented with the horizontal lined bars. The Jaccard, Simpson, Geometric, Cosine measure shared Y-type vertices (targets or drugs) between two X-type nodes (drugs or targets) and the individual degree of these vertices. Pearson Correlation Coefficient (PCC) and Hypergeometric are statistic-based methods. Based on the degree and the total number of Y-type vertices in the bipartite network, the two methods employ the probability distributions to measure the likelihood of observing a certain overlap between the interaction of two X-type vertices. The hyper-parameter of DeepWalk was determined by a grid search over the parameter ranges specified in (Perozzi et al., 2014) (number of walks , learning rate , dimension , window size , walk length ). (a) 10-fold cross-validation, (b) External resource validation
We measured the top K percentage (5, 10, 15, 20, 30) and top N (10, 20, 50, 100, 500, 1000) predicted associations in the two validations. DeepWalk performed the best when the top K percentage of predicted associations were considered (Supplementary Table S1). For example, RFs of DeepWalk increase from 65.90% to 81.23% with DBSI, and from 72.75% to 83.32% with TBSI, through consideration of the top 5% and 30% predicted associations in the ten-fold validation. We also noticed that DeepWalk performed best when the top 500 and 1000 predicted associations were considered (e.g. 72.87% and 78.65% with DBSI and TBSI in top 1000 in the ten-fold validation); other methods performed best with top 10, 20, 50, 100 predicted associations (Supplementary Table S2).
3.2 Comparing the use of tripartite and bipartite network
The previous analysis used only a bipartite network. In order to determine whether the utilization of the additional disease–drug and disease–target associations improved the drug–target predictions, we compared the use of bipartite and tripartite networks. To benchmark this performance, we also compared DeepWalk to two methods that could be applied to both bi- and tripartite networks, SimRank (Jeh and Widom, 2002) and Line (Tang et al., 2015). SimRank computes vertex similarity with the structural context in a network based on a graph-theoretic mode and is applicable in any domain with object-to-object relationships. Line is a graph embedding method that represents the vertices in a network into a low-dimensional vector space. Line utilizes two kinds of network structures, local and global, to capture the first-order proximity (observed links) and second-order proximity (shared neighborhood structures) between the vertices. In the comparison, we used two variants of Line obtained from (https://github.com/tangjianpku/LINE), Line (1st) and Line (2nd), which utilizes first-order and second-order proximity respectively.
DeepWalk performed better than Line and SimRank in both types of validations with both DBSI and TBSI association models (Fig. 4). Interestingly, the use of tripartite networks affected Line(2nd) performance. In contrast, tripartite networks improved DeepWalk’s performance: from 84.23% to 87.83% with DBSI and from 85.75% to 90.31% with TBSI in the ten-fold validation (Fig. 4a); from 83.86% to 86.41% with DBSI and from 82.94% to 86.23% with TSBI in the external source validation (Fig. 4b). Using tripartite networks in DeepWalk outperformed all the topological similarity-based methods with the bipartite networks in Section 3.1. Line(1st) achieved its best performance with tripartite network using the TBSI model (AUC = 84.54%) in ten-fold cross-validation and using the DBSI model (AUC = 83.19%) in external validation). Despite slightly under-performing DeepWalk, SimRank attained comparable AUC scores for the bipartite network and the tripartite network (with TBSI). SimRank achieved its best results with tripartite network using the TBSI model (AUC = 88.19% in ten-fold cross-validation and 84.85% in external validation). We observed that DeepWalk achieved the best RF scores in all top K (except 5%) percentage and top N (500 and above) predicted associations (Supplementary Tables S3 and S4).
Fig. 4.
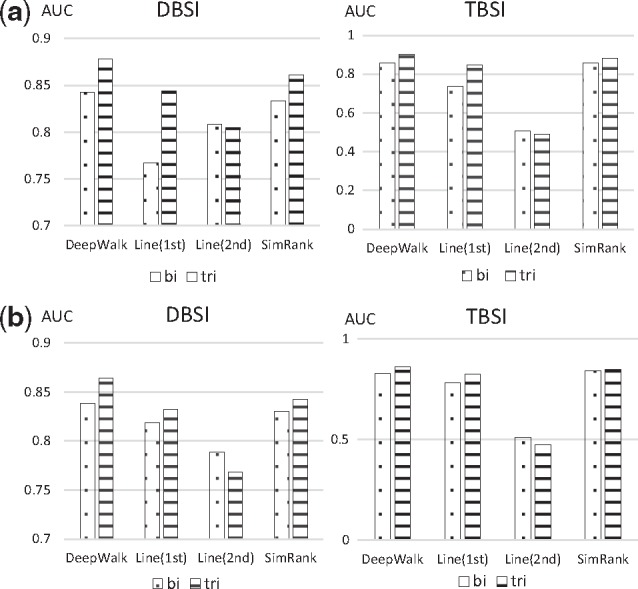
Comparison of average AUC scores of DeepWalk, Line and SimRank over bipartite and tripartite networks using both TBSI and DBSI association models. AUC scores on bipartite network are represented with the dotted bars while tripartite with the horizontal lined bars. Similar to DeepWalk, a grid search is applied to obtain the best results over the parameter ranges for SimRank (damping factor , iteration ) and Line (learning rate , , sampling size ). (a) 10-fold cross-validation, (b) External resource validation
Not all drugs or targets could be associated with diseases in LTN. Therefore, in order to determine the respective influence of drug–disease and disease–target associations in the tripartite network, we partitioned the network into two main components: (i) fully connected, and (ii) partially connected component, to generate training and test sets of associations (Fig. 5). We were able to therefore distinguish the drug–target associations in the fully connected component (referred to as FDTA) and in the partially connected component (referred to as PDTA).
Fig. 5.
Partition of the tripartite network to generate fully connected and partially connected drug–target associations (FDTA and PDTA respectively). The fully connected component contains the targets (target 2), diseases (diseases 2) and drugs (drugs 2) that are fully connected with each other. The partially connected component contains the rest of the vertices (target 1, drug 1 and disease 1) that only associated by drug–target and drug–disease relations. The statistics of each component are indicated in the table. In practice, FDTA and PDTA are generated with the Supplementary Pseudocode 1
We compared the use of tripartite and bipartite network for the prediction on FDTA and PDTA using the same methods mentioned in Section 3.1. The same settings () are used for this experiment and the following ones to conduct a consistent analysis for DeepWalk. We observed that the use tripartite networks offer the largest improvement in prediction of drugs and targets that were associated with the diseases (Fig. 6). Specifically, in the 10-fold validation, AUC scores of the FDTA were improved from 89.28% to 98.96% using the DBSI model, and from 88.14% to 98.19% using the TBSI model (Fig. 6a). In the external source validation, scores were improved from 83.52% to 91.16% using the DBSI model, and from 80.68% to 91.51% using the TBSI model (Fig. 6b). While a fully connected network is not required for DeepWalk, the performance on a partially connected network is roughly 17% lower. As suspected, the AUC scores of the PDTA were hardly improved by using tripartite network, which indicated that the addition of new associations (drug–disease and disease–target) only improved the predictions of drugs and targets directly associated with diseases. Supplementary Tables S5 and S6 show improvement of RF scores.
Fig. 6.
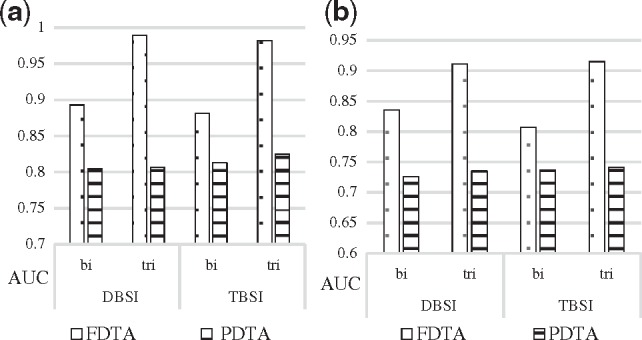
Comparison of average AUC scores of DeepWalk for predicting FDTA and PDTA in Figure 5. AUC scores for FDTA are represented with the dotted bars while PDTA with horizontal lined bars. DeepWalk settings were (γ=40, α=0.01, d=100, w=5, t=40). (a) 10-fold cross-validation, (b) External resource validation
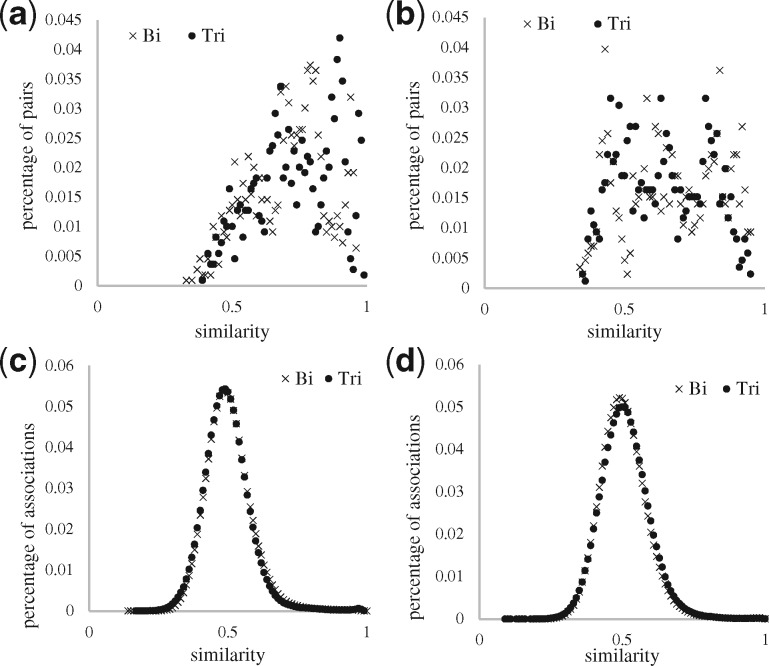
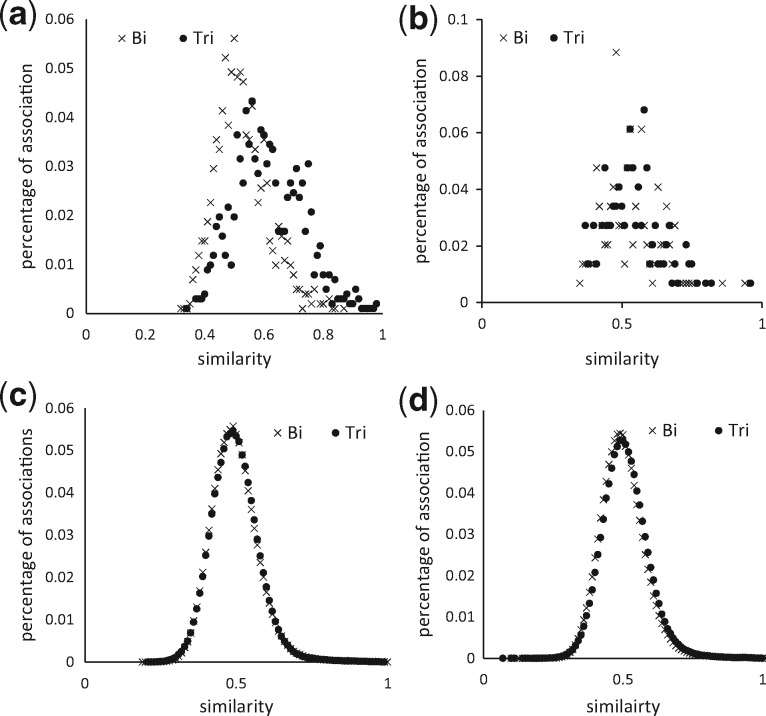
The similarity measure was the key factor for prediction. The purpose of the similarity measures for DBSI and TBSI models is to make the drug–drug and target–target pairs, to infer drug–target associations by obtaining high similarity scores for drug–target associations that are true and low similarity scores for drug–target associations that are false. Therefore, to further scrutinize the similarity measure on drug–drug and target–target pairs, two types of pairs were analyzed based on the contribution to DBSI (for drug–drug Fig. 7) and TBSI (for target–target Fig. 8) models in prediction: (i) positive pairs, which similarity is used to predict true drug–target associations, and (ii) negative pairs, which lack of similarity is used to confirm false drug–target associations. Figures 7 and 8 show how the similarity of the positive and negative pairs distribute for predicting FDTA and PDTA validated with the external source. We observed a notable improvement of the similarity calculations for FDTA by switching the input data from bipartite to tripartite network (Figs 7a and 8a), and minor changes were seen for PDTA (Figs 7b and 8b). The similarity distribution of the positive target–target pairs in the FDTA had a more remarkable improvement by using the tripartite network than with the drug–drug pairs, which was consistent with the experimental results that TBSI performed better than DBSI in Figure 6b. We also showed that using tripartite network did not improve the similarity computations for the negative pairs for both FDTA (Fig. 7c and d) and PDTA predictions (Fig. 8c and d).
Fig. 7.
Similarity distribution of positive and negative types of drug–drug pairs. (a) Positive-FDTA, (b) Positive-PDTA, (c) Negative-FDTA, (d) Negative-PDTA
Fig. 8.
Similarity distribution of positive and negative types of target–target pairs. (a) Positive-FDTA, (b) Positive-PDTA, (c) Negative-FDTA, (d) Negative-PDTA
3.3 Influence of the number of available associations (i.e. data richness)
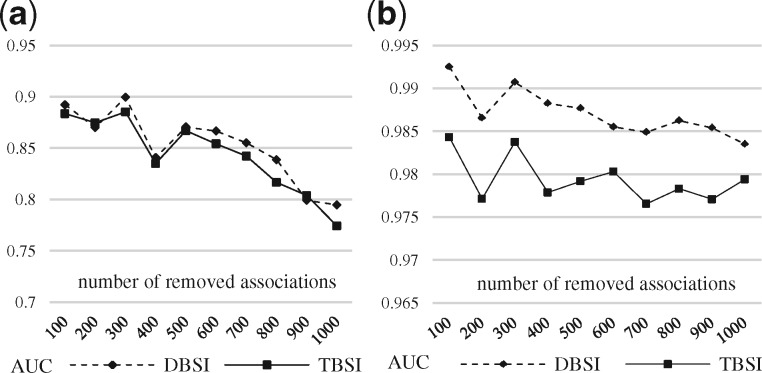
Testing the influence of the data richness (i.e. number of associations in LTN) required performing a Monte Carlo cross-validation, where M drug–target associations (100, 200, 300, 400, 500, 600, 700, 800, 900, 1000) were randomly removed from the bipartite and tripartite networks as validation data and the remained data were used for training, respectively. Both AUC scores of the bipartite and tripartite networks decreased as more associations were removed—bipartite network suffered more than tripartite network (Fig. 9). For example, the AUC score of DBSI dropped around 10% by removing 100 (89.23%) to 1000 (79.47%) associations in the bipartite network, but only dropped about 1% by removing 100 (99.25%) to 1000 (98.35%) associations in the tripartite network. Similar phenomena were observed with the RF scores from Supplementary Table S7 as well.
Fig. 9.
AUC scores of the prediction results of DeepWalk by removing M drug–target associations. (a) Bipartite, (b) Tripartite
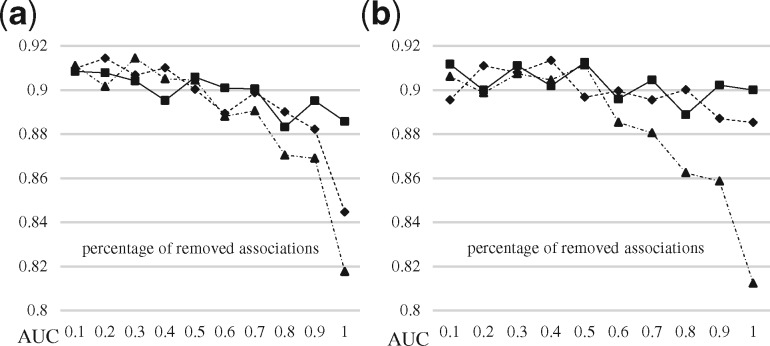
To further understand and evaluate these associations affecting the predictions within the tripartite network, we removed associations of LTN to simulate the different biomedical linked data for testing how the proposed method would perform for these datasets. The three types of associations: drug–target, drug–disease and disease–target, existed in the LTN. The drug–target associations contributed both to the similarity computation and association discovery methods (i.e. DBSI and TBSI), while the drug–disease and disease–target associations contributed only to the similarity computation. Based on the characteristics of the three types of associations, we designed three types of removal strategies: (i) ‘drug–target removed’: removing drug–target associations while preserving all the vertices connected, thus without creating isolated drug vertices (which would have an effect for DBSI) or isolated target vertices (which would have an effect for TBSI). (ii) ‘disease conserved’ which removed drug–disease or disease–target associations without isolating disease from the drugs and targets; (iii) ‘disease-related removed’ which removed drug–disease or disease–target associations without consideration of keeping diseases connected after the removal. We randomly removed P percentage of associations based on the three types of removal strategies, and trained DeepWalk with the remaining associations and validated the results with the external resources.
Figure 10 shows that the quality of the predictions of disease-related removed drops the most as the number of removed associations increases, since the removal affects both the similarity computation and association discovery methods. Without hurting the discovery method, ‘disease conserved’ has a sharper drop than ‘drug–target removed’, which indicates that the enrichment of the drug–target bipartite network (by importing drug–disease and disease–target associations without evolving the network to tripartite) results in better predictions than importing drug–target associations. The results shown in Supplementary Table S8 also support this conclusion.
Fig. 10.
AUC scores of the prediction results of DeepWalk with different types of association removal strategies. The ‘drug–target removed’ is presented with solid line, ‘disease conserved’ with dashed line, ‘disease-related removed’ with dash-dot line. (a) DBSI, (b) TBSI
3.4 Topology-based V.S. Chemical structure- or genomic sequence-based
We compared topology-based DeepWalk to chemical structure- and genomic sequence-based methods across four experiments (Ding et al., 2014; Yamanishi et al., 2008), predicting drug–target association for four kinds of targets: ‘Enzyme’, ‘GPCR’, ‘Ion channels’ and ‘Nuclear receptor’. Importantly, and to keep the comparison fair to all methods, we limited the evaluation to the subset of fully connected drug–target associations (FDTA) which drugs and targets have available chemical structure and genomics information, respectively.
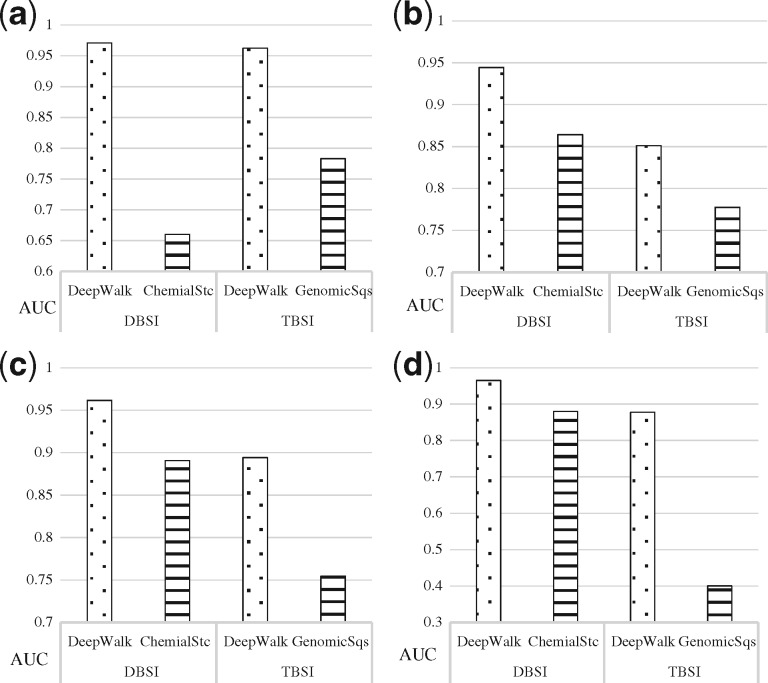
Figure 11 illustrates that DeepWalk, using topology of the tripartite networks for similarity computations, outperforms the other two methods based on chemical structure and genomic sequence in terms of AUC. The AUC scores are improved by using DeepWalk in experiments. For example, for ‘Enzyme’, the prediction based on DBSI are improved by 31.1% (97.1 for DeepWalk and 66.0% by ChemialStc), and the predictions based on TBSI are improved by 17.9% (96.2% for DeepWalk and 78.3% by GenomicSqs). The best predictions are all obtained with DeepWalk + DBSI (97.1 for ‘enzyme’, 94.4 for ‘GCPR’, 96.1 for ‘ion channel’ and 96.5 for ‘nuclear receptor’). The comparison of RF scores leads to consistent results (Supplementary Table S9).
Fig. 11.
Comparison of average AUC scores (10 fold validation) of FDTA predictions using different similarity computation methods based on topology (DeepWalk), chemical structure (ChemicalStc) and genomic sequence (GenomicSqs) for (a) Enzymes (271 drugs, 325 targets), (b) GPCR (148 drugs, 77 targets), (c) Ion Channels (129 drugs, 100 targets) and (d) Nuclear Receptors (48 drugs, 19 targets). AUC scores with DeepWalk are represented with the dotted bars while the other methods with the horizontal lined bars. (a) Enzyme, (b) GPCR, (c) Ion channel, (d) Nuclear receptor
4 Discussion
Despite successful exploitation of the topology of tripartite networks through the application of DeepWalk for similarity computation in drug–target prediction, there were a couple noted limitations. The proposed method can predict the associations between the drugs and targets that exist within the network, but may not predict new drugs or targets in some practice use scenarios. Secondly, compared to DeepWalk, the traditional topology-based method, SimRank, shows potential for top N predictions (see Supplementary Table S3 and S4), which can serve as an alternative method for these prediction efforts.
In addition to the disease information used in this study, the biomedical linked data may also provide other topological information between drugs and targets that could be used for prediction, such as side effects (Campillos et al., 2008) or drug classification systems (Perlman et al., 2011). However, the use of a more complex network may lead to new issues, such as the effect of the pathway lengths or even the size and shape of networks (Yu et al., 2016), which can be caused by data mapping/integration in the network construction.
The method we presented here is somewhat monotonous, where it only considers the diseases in the network and is still not comprehensive enough to capture all the characteristics of drugs or targets that may not be represented on a network. Considering these features, such as chemical structure, pharmacology (Yamanishi et al., 2010) and genomic sequence, may potentially improve the prediction results and may facilitate this methodology to be applied in predicting new drugs or targets. Future studies could propose a hybrid similarity measure that includes both topological and non-topological features.
In conclusion, the method proposed here assembles the similarity measure with the rule-based inference methods, DBSI and TBSI, for drug–target prediction. It is flexible, and DBSI and TBSI can be replaced by certain kernel functions based classification models (Bleakley and Yamanishi, 2009; Jacob and Vert, 2008; van Laarhoven et al., 2011; Xia et al., 2010). Therefore, the deep learning methods for similarity measures can be associated with alternative classification models, which may lead to an improved performance overall in the future.
Acknowledgments
We thank Dr. Lucila Ohno-Machado for providing helpful guidance and supervision on the overall project. We also thank Hyun-Dae Kim and Imho Jang for helping with dataset search and review.
Funding
This work has been supported by NIH through the grants U24AI117966 and P30CA023100.
Conflict of Interest: none declared.
Supplementary Material
References
- Bass J.I.F. et al. (2013) Using networks to measure similarity between genes: association index selection. Nat. Methods, 10, 1169–1176. [DOI] [PMC free article] [PubMed] [Google Scholar]
- Belleau F. et al. (2008) Bio2RDF: towards a mashup to build bioinformatics knowledge systems. J. Biomed. Inf., 41, 706–716. [DOI] [PubMed] [Google Scholar]
- Bizer C. et al. (2009) Linked data-the story so far. International Journal on Semantic Web and Information Systems, 5, 1–22. [Google Scholar]
- Bleakley K., Yamanishi Y. (2009) Supervised prediction of drug–target interactions using bipartite local models. Bioinformatics, 25, 2397–2403. [DOI] [PMC free article] [PubMed] [Google Scholar]
- Campillos M. et al. (2008) Drug target identification using side-effect similarity. Science, 321, 263–266. [DOI] [PubMed] [Google Scholar]
- Chen B. et al. (2012a) Assessing drug target association using semantic linked data. PLoS Comput. Biol., 8, e1002574.. [DOI] [PMC free article] [PubMed] [Google Scholar]
- Chen X. et al. (2012b) Drug–target interaction prediction by random walk on the heterogeneous network. Mol. BioSystems, 8, 1970–1978. [DOI] [PubMed] [Google Scholar]
- Cheng A.C. et al. (2007) Structure-based maximal affinity model predicts small-molecule druggability. Nat. Biotechnol., 25, 71–75. [DOI] [PubMed] [Google Scholar]
- Cheng F. et al. (2012) Prediction of drug–target interactions and drug repositioning via network-based inference. PLoS Comput. Biol., 8, e1002503. [DOI] [PMC free article] [PubMed] [Google Scholar]
- Consortium,U. (2008) The universal protein resource (UniProt). Nucleic Acids Res., 36, D190–D195. [DOI] [PMC free article] [PubMed] [Google Scholar]
- Ding H. et al. (2014) Similarity-based machine learning methods for predicting drug–target interactions: a brief review. Brief. Bioinf., 15, 734–747. [DOI] [PubMed] [Google Scholar]
- Goh K.-I. et al. (2007) The human disease network. Proc. Natl. Acad. Sci. U. S. A., 104, 8685–8690. [DOI] [PMC free article] [PubMed] [Google Scholar]
- Hamosh A. et al. (2005) Online Mendelian Inheritance in Man (OMIM), a knowledgebase of human genes and genetic disorders. Nucleic Acids Res., 33, D514–D517. [DOI] [PMC free article] [PubMed] [Google Scholar]
- Jacob L., Vert J.-P. (2008) Protein-ligand interaction prediction: an improved chemogenomics approach. Bioinformatics, 24, 2149–2156. [DOI] [PMC free article] [PubMed] [Google Scholar]
- Jeh G., Widom J. (2002) SimRank: a measure of structural-context similarity. In: Proceedings of the Eighth ACM SIGKDD International Conference on Knowledge Discovery and Data Mining ACM, pp. 538–543.
- Mikolov T. et al. (2013) Efficient estimation of word representations in vector space. arXiv preprint arXiv:1301.3781.
- Mnih A., Hinton G.E. (2008) A scalable hierarchical distributed language model. In Proceedings of the 21st International Conference on Neural Information Processing Systems (NIPS'08), Koller,D. et al. (eds). Curran Associates Inc., USA, 1081–1088. [Google Scholar]
- Palma G. et al. (2014) 131–146. Drug–target interaction prediction using semantic similarity and edge partitioning. In: International Semantic Web Conference. Springer.
- Perlman L. et al. (2011) Combining drug and gene similarity measures for drug–target elucidation. J. Comput. Biol., 18, 133–145. [DOI] [PubMed] [Google Scholar]
- Perozzi B. et al. (2014) Deepwalk: Online learning of social representations. In: Proceedings of the 20th ACM SIGKDD international conference on Knowledge discovery and data mining. ACM. pp. 701–710.
- Povey S. et al. (2001) The HUGO gene nomenclature committee (HGNC). Hum. Genet., 109, 678–680. [DOI] [PubMed] [Google Scholar]
- Seal A. et al. (2015) Optimizing drug–target interaction prediction based on random walk on heterogeneous networks. J. Cheminf., 7, 1.. [DOI] [PMC free article] [PubMed] [Google Scholar]
- Tang J. et al. (2015) Line: Large-scale information network embedding. In: Proceedings of the 24th International Conference on World Wide Web. ACM. pp. 1067–1077.
- van Laarhoven T. et al. (2011) Gaussian interaction profile kernels for predicting drug–target interaction. Bioinformatics, 27, 3036–3043. [DOI] [PubMed] [Google Scholar]
- Vogt I., Mestres J. (2010) Drug–target networks. Mol. Inf., 29, 10–14. [DOI] [PubMed] [Google Scholar]
- Wang W. et al. (2013) Drug target predictions based on heterogeneous graph inference. In: Pacific Symposium on Biocomputing. Pacific Symposium on Biocomputing. NIH Public Access. p. 53. [PMC free article] [PubMed]
- Wishart D.S. et al. (2008) DrugBank: a knowledgebase for drugs, drug actions and drug targets. Nucleic Acids Res., 36, D901–D906. [DOI] [PMC free article] [PubMed] [Google Scholar]
- Xia Z. et al. (2010) Semi-supervised drug-protein interaction prediction from heterogeneous biological spaces. BMC Syst. Biol., 4, S6. [DOI] [PMC free article] [PubMed] [Google Scholar]
- Yamanishi Y. et al. (2008) Prediction of drug–target interaction networks from the integration of chemical and genomic spaces. Bioinformatics, 24, i232–i240. [DOI] [PMC free article] [PubMed] [Google Scholar]
- Yamanishi Y. et al. (2010) Drug–target interaction prediction from chemical, genomic and pharmacological data in an integrated framework. Bioinformatics, 26, i246–i254. [DOI] [PMC free article] [PubMed] [Google Scholar]
- Yıldırım M.A. et al. (2007) Drug–target network. Nat. Biotechnol., 25, 1119–1126. [DOI] [PubMed] [Google Scholar]
- Yu H. et al. (2016) Prediction of drugs having opposite effects on disease genes in a directed network. BMC Syst. Biol., 10, 17. [DOI] [PMC free article] [PubMed] [Google Scholar]
- Zhu S. et al. (2005) A probabilistic model for mining implicit ‘chemical compound–gene’ relations from literature. Bioinformatics, 21, ii245–ii251. [DOI] [PubMed] [Google Scholar]
Associated Data
This section collects any data citations, data availability statements, or supplementary materials included in this article.


