Abstract
Motivation: Disease phenotype networks play an important role in computational approaches to identifying new disease-gene associations. Current disease phenotype networks often model disease relationships based on pairwise similarities, therefore ignore the specific context on how two diseases are connected. In this study, we propose a new strategy to model disease associations using context-sensitive networks (CSNs). We developed a CSN-based phenome-driven approach for disease genetics prediction, and investigated the translational potential of the predicted genes in drug discovery.
Results: We constructed CSNs by directly connecting diseases with associated phenotypes. Here, we constructed two CSNs using different data sources; the two networks contain 26 790 and 13 822 nodes respectively. We integrated the CSNs with a genetic functional relationship network and predicted disease genes using a network-based ranking algorithm. For comparison, we built Similarity-Based disease Networks (SBN) using the same disease phenotype data. In a de novo cross validation for 3324 diseases, the CSN-based approach significantly increased the average rank from top 12.6 to top 8.8% for all tested genes comparing with the SBN-based approach (). The area under the receiver operating characteristic curve for the CSN approach was also significantly higher than the SBN approach (0.91 versus 0.87, ). In addition, we predicted genes for Parkinson’s disease using CSNs, and demonstrated that the top-ranked genes are highly relevant to PD pathologenesis. We pin-pointed a top-ranked drug target gene for PD, and found its association with neurodegeneration supported by literature. In summary, CSNs lead to significantly improve the disease genetics prediction comparing with SBNs and provide leads for potential drug targets.
Availability and Implementation: nlp.case.edu/public/data/
Contact: rxx@case.edu
1 Introduction
Real-world interconnections between objects not only differ in their strengths, but more importantly, in the types of the links. Figure 1 shows two different ways of constructing social networks based on shared interests. The similarity-based network (SBN) models the relationships between two people by the number of overlapping interests, and ignores the context on how people are connected. On the other hand, the context-sensitive network (CSN) contains both ‘people’ and ‘interest’ nodes, and explictly connects people through their common interests. It captures the information that Chris shares different interests with Tylor and Jeremy, though he has two common interests with both the other two people. CSNs are therefore more informative than SBNs in data mining applications, such as social network analysis (Sun et al., 2012) and recommendation systems (Yu et al., 2014).
Fig. 1.
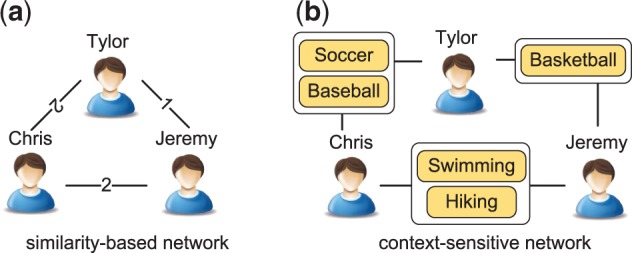
Similarity-based and context-sensitive interconnections between people sharing interested sports
In the biomedical field, data are usually represented as SBNs for new knowledge discovery. For example, previous studies construct similarity-based disease phenotype networks to understand the genotype-phenotype correlations (Barabási et al., 2011; Brunner and Van Driel, 2004; Chen and Xu, 2014; Chen, Y. et al., 2015a), predict new disease-associated genes (Chen et al., 2015b, Chen and Xu, 2015; Hwuang et al., 2012; Lage et al., 2007; Li and Patra, 2010; Ni et al., 2016; Sun et al., 2013; Vanunu et al., 2010; Wu et al., 2008, 2009) and identify new drug indications (Chen et al., 2015c; Gottlieb et al., 2011; Xu and Wang, 2015). They usually extract disease-phenotype links from literature (Xu et al., 2013; Zhou et al., 2014), ontologies (Chen et al., 2015d; Robinson et al., 2014) and databases (van Driel et al., 2006), and quantify disease-disease similarities based on the number of shared phenotypic features. Likewise, disease genetic networks connect two disease nodes if they share common genetic factors (Goh et al., 2007); the edge weights represent the number of shared genes between diseases. Other examples of SBNs include drug networks, in which drug pairs are linked if they share similar side effects (Campillos et al., 2008), gene expression profiles (Iorio et al., 2010; Vidović et al., 2013), and chemical structures (Maggiora et al., 2013).
Similarity-based disease phenotype networks do not preserve the context information on how the diseases are connected like the other SBNs. For example, the SBN in Figure 2a shows that Marfan syndrome is connected to Keutel syndrome and Kawasaki disease with similar strengths based on phenotype similarities provided in the Human Phenotype Ontology (HPO) database (Köhler et al., 2013). But the CSN in Figure 2b restores the context information and shows that the two disease pairs in fact share completely different phenotypes. In this study, we propose modeling the disease phenotypic relationships with CSNs and predicting disease-gene associations using CSNs. Figure 3b shows the structure of CSN, in which disease nodes are connected via one or more shared phenotype nodes. CSNs have two potential advantages over SBNs in disease gene prediction: first, it consists of accurate and meaningful connections between diseases, thus offers powerful false positive reduction; second, part of the phenotypes themselves may have known genetic basis, which provide additional information to identify new disease-gene associations. In addition, difference data sources may contain complimentary disease–phenotype relationships (Chen et al., 2015b,d). Here, we constructed two CSNs from the phenotype data in Unified Medical Language System (UMLS) (Bodenreider, 2004) and HPO (Köhler et al., 2013). Then we integrated the CSNs and a protein–protein interaction (PPI) network, and ranked all the genes for a given disease using a network-based algorithm. For comparison purpose, we constructed two SBNs from the same phenotype data sources and incorporate them in the phenome-driven disease gene prediction approach. We compared our approach with the SBN-based approach to demonstrate the advantages of CSNs.
Fig. 2.
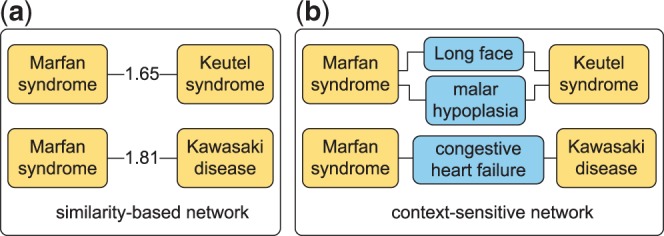
Similarity-based and context-sensitive interconnections between Marfan syndrome and two other diseases
Fig. 3.

Structure of SBN and CSN
As a case study, we predicted genes for Parkinson’s disease (PD), which has high worldwide prevalence (De Lau and Breteler, 2006), complex and unclear mechanisms (Olanow et al., 2009), and no curative treatment (Connolly and Lang, 2014). Identifying the genetic basis for PD not only plays an important role in elucidating disease mechanisms (Plenge et al., 2013), but also has the translational potential of discovering new drug targets (Hurle et al., 2013; Okada et al., 2014). We compared the prioritized genes with PD genes that were independently identified from Genome-wide association study (GWAS) meta-analysis to support the relevance of our candidate genes. We investigated the distribution of existing PD drug targets to demonstrate the translational potential of the CSN-based approach. Finally, pathway analysis allowed us to understand the functions of candidate genes and pin-point a candidate drug target gene for PD, which is also supported by evidence from literature.
2 Methods
We constructed the CSNs, and integrated them with a genetic network based on PPIs. For an interested disease, we identified the candidate genes with a network-based ranking algorithm. We evaluated if the CSNs improve the gene prediction performance comparing with the SBN approach in a de novo cross validation analysis. Finally, we predicted genes for PD as a case study and investigated the translational potenntial of the top-ranked genes.
2.1 Construct CSNs
We first constructed two CSNs using the disease-phenotype semantic relationships from UMLS and HPO. The UMLS semantic network provides 50 543 disease–phenotype pairs (disease and phenotype terms are directly associated by the semantic relationship ‘has_manifestation’ in the publicly available file MRREL.RRF). We connected diseases with their corresponding manifestations to construct the context-sensitive disease manifestation network (DMN-CSN), which contains 26 790 nodes, including 2439 diseases and 24 490 phenotypes. HPO is a different phenotype data source from UMLS; it captures the textual descriptions of disease phenotypes in OMIM as mimMiner (van Driel et al., 2006) does, but have significant improvement in quality comparing with mimMiner (Oti et al., 2009). We downloaded 98 482 disease-phenotype links from HPO and constructed the context-sensitive human phenotype network (HPN-CSN), in which two disease nodes were connected via their shared phenotype nodes. HPN-CSN contains 13 822 nodes in total, including 6947 diseases and 6875 phenotypes. Both DMN-CSN and HPN-CSN are undirected and unweighted (we currently consider all the disease-manifestation or disease-phenotype pairs that appear in the databases have the same confident level). For comparison purpose, we constructed DMN-SBN and HPN-SBN from the same two disease phenotype data sources. For DMN-SBN, disease similarities were calculated as cosine similarities between disease phenotype profiles (Chen et al., 2015d); for HPN-SBN, disease similarities were calculated as semantic similarities in the human phenotype ontology (Robinson et al., 2008). Different from CSNs, which contain disease and phenotype ndoes, SBNs contain only one kind of node, the disease nodes.
CSNs and SBNs have different structures (Table 1). CSNs are much sparser than SBNs, specially when the number of diseases is large: a disease usually has only a small number of phenotypes, but may share at least one phenotype with many other diseases. For SBNs, the size of the network increases dramatically as more diseases are covered, since the edges represent pairwise disease relationships; the calculation of edge weights is usually based on artificial definition of disease similarity, such as Jaccard, cosine or semantic similarity between vectors of phenotype features. For CSNs, the edges are defined by observational facts on disease phenotypes, and preserve the context information of disease links. In addition, CSNs capture the disease similarities in SBNs: if two diseases share many phenotypes, they are likely to be connected by many viable paths, and have a large probability to reach each other in the network. The disease relationships that are connected by common phenotypes, such as pain and fever, are automatically downweighted in CSNs: if two diseases are connected by a common phenotype, the probability of reaching one disease from the other decreases, since the phenotype in between distributes the probability to its many direct neighbors.
Table 1.
Compare the nodes and edges of the SBN and CSN version of DMN and HPO.
| Network | Nodes | Edges |
|---|---|---|
| HPN-SBN | 6390 | 12 761 463 |
| HPN-CSN | 13 822 | 98 482 |
| DMN-SBN | 2312 | 408 029 |
| DMN-CSN | 26 790 | 50 543 |
2.2 Integrate networks
We integrated HPN-CSN, DMN-CSN, with a genetic network as in Figure 4a. The genetic network was constructed from PPIs in STRING (Franceschini et al., 2013); we used the weighted PPI data, which combine different data sources, such as experiments, pathway databases, coexpression analysis and text mining. Then we connected the disease networks with the gene network using disease-gene associations from OMIM. Figure 4b shows that both disease and phenotype nodes in CSNs may link with gene nodes, because part of the phenotypes are genetic disorders themselves and have well-studied associated genes. Disease terms in HPO-CSN were naturally represented by OMIM identifiers and can be easily associated with genes using the OMIM data. We performed semantic mapping to obtain phenotype-gene links for phenotypes in HPO-CSN. We mapped the HPO identifiers for the phenotype terms first to UMLS concept unique identifiers (CUIs) using information in the ontology file in the HPO database, then to OMIM identifiers using UMLS metathesaurus. After that, we extracted the phenotype-gene links using the disease-gene association data in OMIM. A total of 3554 phenotype terms represented by HPO identifiers were found to have corresponding UMLS CUIs, and 591 were mapped to OMIM identifiers. Among them, 278 HPO identifier were found to be linked with genes through 761 phenotype-gene links. For disease and phenotype terms in DMN-CSN, which are all represented by UMLS CUIs, we directly mapped them to OMIM identifiers and then linked to genes. In the end, we established 2312 edges to connect a total of 1688 nodes, including diseases and phenotypes, in DMN-CSN with 1581 genes. In the same way, 3601 nodes in HPN-CSN were connected with 2702 genes with 4831 links.
Fig. 4.
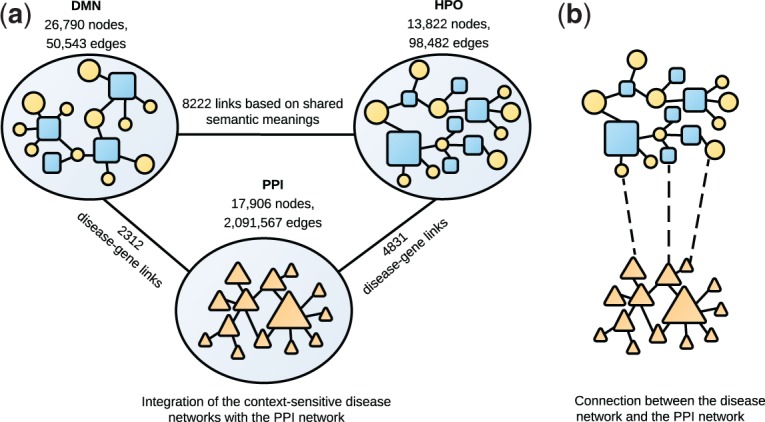
Disease gene prediction based on multiple CSNs
Next, we linked the disease or phenotype nodes in HPN-CSN and DMN-CSN if the nodes have the same semantic meanings. UMLS provides mapping between different biomedical terminologies with the same semantic meanings. Here, disease and phenotype nodes are represented by different identifiers based on their data sources in the disease networks: DMN-CSN uses the UMLS unique concept identifiers for both disease and phenotype nodes; HPN-CSN represents diseases using OMIM, OrphenNet and DECIPHER identifiers, and phenotypes using HPO identifiers. We extracted 8222 pairwise mappings between identifier systems from the UMLS Metathesaurus, and connected DMN-CSN and HPN-CSN with the mappings.
2.3 Predict disease-associated genes
Given an interested disease, the gene prediction algorithm estimates the probability of reaching each gene from the diseases in the heterogeneous network that models the interconnections of diseases, phenotypes and genes. The genes are then ranked based on the probabilities, and the top-ranked genes are considered highly related with the disease. We modeled the movements on the integrated network by two kinds of jumping probabilities: the within-subnetwork and between-subnetwork jumping probabilities. For example, a random walker starts from a seed node in DMN-CSN, and which is connected with other nodes in DMN-CSN, as well as with HPN-CSN and the gene network. Then the random walker may choose to walk to HPN-CSN with the between-subnetwork probability , to the gene network with the probability , or to its direct neighbors in DMN with the probability . If the node has multiple direct neighbors in DMN-CSN, the within-subnetwork probabilities (decided by the subnetwork structure) then determine the further distribution of the probability within DMN-CSN.
The ranking score for each gene were calculated by an iterative update. Assume p0 is a vector of initial scores for each node, is the score vector at step k + 1 and is iteratively updated by
| (1) |
where is the probability of restarting from the seed at each step, and M is the transition matrix defined based on the adjacency matrix of each subnetwork. We assumed the update converges if the score difference between iterations is smaller than . We calculated the transition matrix M in (2) and (3). The off-diagonal submatrices in (2) were calculated in (3), where is the adjacency matrix of the connection between network Ni and Nj; the diagonal submatrices were calculated in (4), where is the adjacency matrix of HPN-CSN, DMN-CSN or the PPI network.
| (2) |
| (3) |
| (4) |
2.4 Evaluate gene prediction in a de novo cross validation
We performed a de novo cross validation analysis to evaluate prediction performance. Phenotype-driven gene prediction approaches, comparing with the conventional gene function-driven approaches, has a major advantage that they predict novel genes for diseases without known genetic basis. In the cross validation, we removed all disease–gene links for a query disease each time. If the disease is connected with other disease or phenotype nodes, we also removed their connections with the genes through both disease networks. Then the query disease was set as the seed, and all the genes were ranked by the algorithm.
Our approach has a few parameters to be determined, including α in (1) and λs, the jumping probabilities between networks. We chose the parameters that optimize the performance in cross validation. We first fixed the λs, changed the value for α, and chose the α that lead to the highest average ranking for all tested disease–gene associations. Table 2 shows that the ranking result is insensitive to the variation of α; the average rank for all tested disease-gene associations in the cross validation stays the same when α is within the range . Then we fixed α and repeated the cross validation with different combinations of λs to choose values for λs. We assume that the two phenotype networks are equally important, thus set and . For different combinations of λ choices, the variation in ranking performance is shown in Table 3. Similarily, the ranking performance in cross validation is insensitive to difference in λs. In this paper, we set the parameter .
Table 2.
Average ranks for tested disease-gene associations in cross validation with different α
| α | Average rank |
|---|---|
| 0.1 | 10.9% |
| 0.3 | 9.20% |
| 0.5 | 8.80% |
| 0.7 | 8.80% |
| 0.8 | 8.80% |
| 0.9 | 8.90% |
Table 3.
Average ranks for tested disease-gene associations in cross validation with different combination λs
| Average rank | ||
|---|---|---|
| 0.1 | 0.7 | 8.80% |
| 0.3 | 0.5 | 8.80% |
| 0.5 | 0.3 | 8.80% |
| 0.7 | 0.1 | 8.80% |
We compared the performance of SBN and CSN approach in the cross validation. For the SBN-based approach, we replaced the CSNs in Figure 4 with the SBNs, and performed the disease gene prediction using the same approach. Then we evaluated if the context-sensitive disease phenotype networks improve the performance of de novo gene prediction. We directly compared the ranks for all the retained genes between SBN and CSN approaches, and generated a receiver operating characteristic (ROC) curve for both approaches. Following the previous study (Chen et al., 2011, 2015b; Hwuang et al., 2012), an ROC curve was plotted for each prioritization, and then averaged across all query diseases. For each curve, sensitivity is the percentage of retained genes that are ranked above a threshold among all the retained genes, and specificity is the percentage of negative genes (genes that are not known disease genes) ranked below the threshold among all the negative genes. Last, we calculated and compared the area under the curve (AUC) between methods.
CSN has two advantages comparing with SBN: the network consists of meaningful and accurate phenotypic relationships between diseases, and the phenotype-gene links offer additional information in suggesting strong candidate disease genes. To test the contribution of each advantage, we constructed a variant for CSN, named CSNV, by removing all the 761 and 361 phenotype-gene links in HPN-CSN and DMN-CSN. We inserted CSNV into our algorithm and performed the cross validation experiment. Then we compared the ranks for the retained genes generated by CSNV-based approach with both SBN and CSN approach.
2.5 Evaluate gene prediction stratified by disease classes
Disease phenotypes may provide leads for the genetic causes at a different degree for different disease classes. Accordingly, both CSN and SBN approach, which are phenotype-driven gene prediction approaches may have varying performance. We classified diseases in CSN and SBN into nine groups based on International Classification of Diseases (10th edition), and repeated the cross-validation experiments for each group. Then we investigated if CSNs make the same level improvement for different disease classes over SBNs.
2.6 Identify candidate genes and drug targets for PD
We used PD as an example to demonstrate that the CSN approach identifies new candidate disease genes, which has translation potential for drug discovery. PD is the second most common neurodegenerative disorder and affects 5 million people throughout the world (De Lau and Breteler, 2006). The disease genetic basis is highly complex and heterogeneous, involving many factors for the death of dopaminergic neuron, such as mitochondrial dysfunction and oxidative stress (Olanow et al., 2009). Levodopa currently remains the most effective agent in treating PD, but shows limited efficacy in reversing neuronal loss and controlling nondopamineric symptoms (Brooks, 2008). Therefore, identifying new genetic basis and new drugs are desired to improve the treatment of PD.
We first predicted genes for PD using the CSN approach. Currently, 888 PD-associated genes have been identified through GWAS meta-analysis (Lill et al., 2012) and made available online (PDgene.org). We assumed that the set of PD genes are positive examples, and compared our gene ranking with the set. We investigated the distribution of the 888 PD genes among our ranking to examine if our gene ranking tend to prioritize the relevant genes above the others. We also examined the ranks of the target genes for existing PD drugs to evaluate if the prioritized genes represent translational potential. Finally, we performed a pathway analysis on the top 5% candidate genes found by CSN using the software Ingenuity Pathway Analysis (QIAGEN Redwood City, www.qiagen.com/ingenuity) to understand the functions of the prioritized genes. We used the pathways associated with known PD genes as a reference and identified the novel PD-associated pathways found by our approach.
3 Results
3.1 CSN significantly improved the performance of gene prediction in cross validation
Our approach using CSNs achieved significantly higher ranks for all tested disease-associated genes than the SBN approach in the de novo cross validation (Table 4). The mean average rank for retained genes for all query diseases is top 8.8% using CSNs, comparing with 12.6% using SBNs (). In addition, the context preserved connections between diseases in CSN already significantly improve the gene ranking even after the phenotype-gene links were removed. The CSNV-based approach achieved a mean average rank of top 9% in all prioritizations, comparing with 12.6% for the SBN approach (). The small average contribution of phenotype-gene links in improving the gene ranking performance may due to the small number of available phenotype-gene links in the networks: the HPO-PPI connections contain 761 phenotype-gene links and 4070 disease-gene links; the DMN-PPI connections contain 361 phenotype-gene links and 1951 disease-gene links. But for individual cases, the phenotype-gene links may still play important roles in suggesting candidate disease-gene associations. Figure 5 shows the scatter plot for the tested disease-gene associations. Each point represent a gene, and the x- and y-axis shows the rank for this gene generated by SBN- and CSN-based approach, respectively. The genes on the red line have the same ranks generated from SBN and CSN. The figure shows that most genes are below the red line, thus have high rankings generated from CSN (small values on y-axis) and low rankings from SBN (large values on x-axis).
Table 4.
Mean average rank for all the evaluated genes in the de novo cross validation for the SBN and CSN disease gene prediction approaches.
| Network | Number of tests | Mean average rank |
|---|---|---|
| SBN | 3268 | 12.60% |
| CSN | 3324 | 8.80% |
| CSNV | 3323 | 9.00% |
Fig. 5.
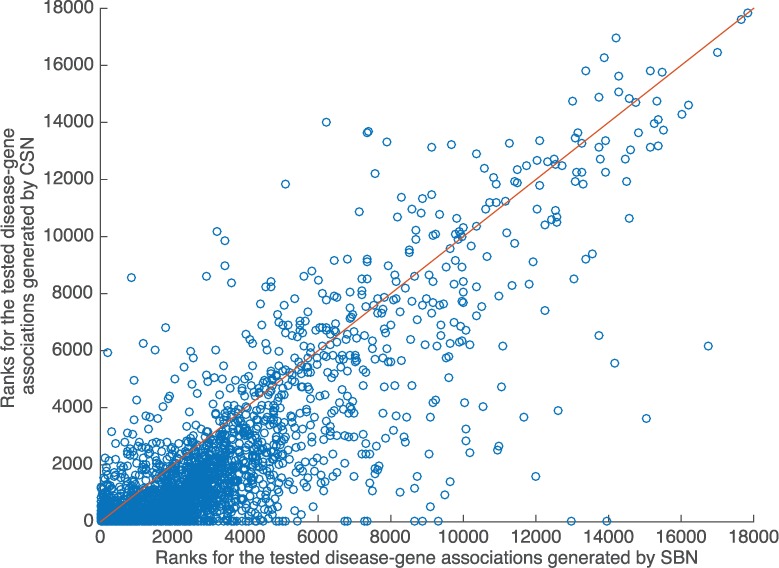
Scatter plot for the de novo cross validation for all disease-gene associations
Nearly 90% query diseases in the cross validation have only one associated genes. Table 5 shows that the CSN and CSNV approach achieved significantly higher average and median ranks for these disease-gene pairs. The CSN approach ranked the tested genes averagely in top 9%, while the SBN approach ranked them averagely in top 12.9% (). The median rank for the retained genes was 2.6% for the CSN approach comparing with 8.2% for the SBN approach (). CSNV also achieved significantly higher average rank () and median rank () than SBN. The phenotype-gene links in CSN improves the median rank for all tested genes by 10% comparing with CSNV. Figure 6 shows the scatter plot for the tests on these single-gene disease. Similar to Figure 5, most genes are under the red line, and have higher rankings generated from CSN than from SBN.
Table 5.
Average and median rank for single-gene tests in the de novo cross validation
| Network | Number of tests | Average rank | Median rank |
|---|---|---|---|
| SBN | 2935 | 12.90% | 8.2% |
| CSN | 2987 | 9.00% | 2.6% |
| CSNV | 2988 | 9.10% | 2.9% |
Fig. 6.
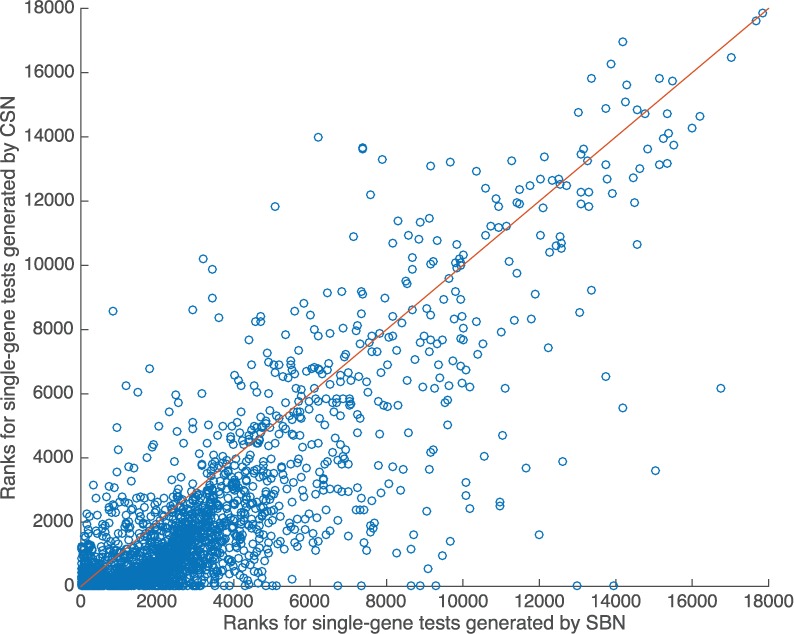
Scatter plot for the de novo cross validation for single gene diseases
We also compared the ROC curves between the CSN and SBN approach in Figure 7. CSN achieved a significantly higher overall AUC of 0.91 comparing with 0.87 obtained by the SBN approach (). Since the top-ranked genes are more important than the lower ranked genes, we examined the AUC at the false positive rate cutoff of 10%: the CSN approach achieved an AUC of 0.59, which was also significantly > 0.43 for the SBN approach ().
Fig. 7.
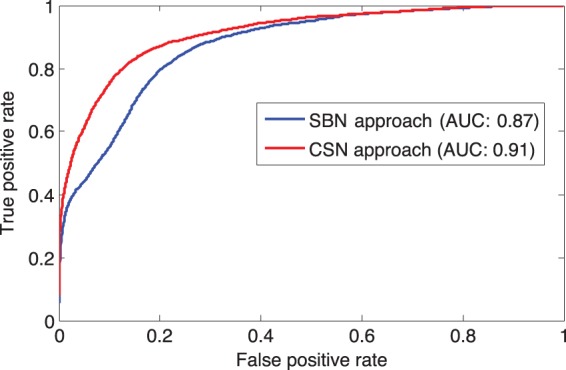
ROC curve for the cross validation test results for SBN- and CSN-based approach
3.2 Case study demonstrated how CSN improves the performance
We investigated how CSN achieved better rankings comparing to SBN using sarcoidosis as an example. Sarcoidosis (OMIM: 181000) is known to be associated with only one gene HLA-DRB1 in OMIM. We removed all connections between sarcoidosis and the gene, and used both CSN and SBN to predict the disease-gene association back.
Figure 8a shows the shortest paths from sarcoidosis to HLA-DRB1 in CSN. Sarcoidosis has 24 phenotypes in total, and 6 out of 24 direct the paths to rheumatoid arthritis, which is associated with HLA-DRB1. Since the nodes in CSN have small numbers of direct neighbors and the paths between sarcoidosis and HLA-DRB1 are short, HLA-DRB1 has a high probability of being reached by sarcoidosis and is ranked highly for sarcoidosis.
Fig. 8.
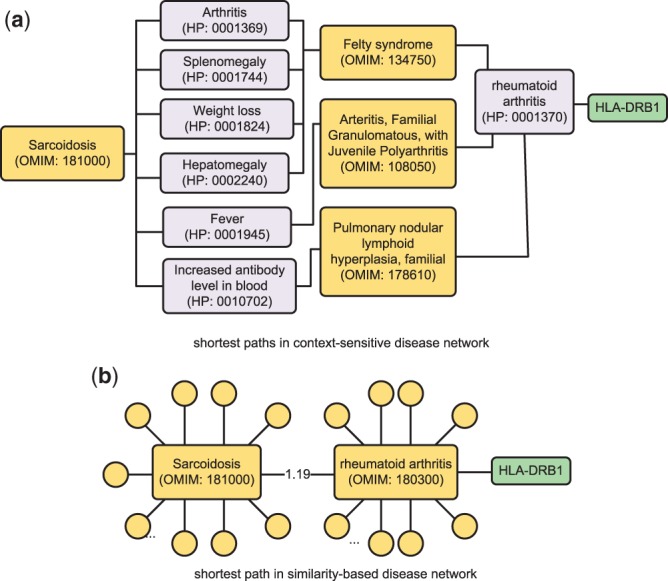
Shortest paths from sarcoidosis to HLA-DRB1 in CSN and SBN
Figure 8b shows that in SBN, sarcoidosis and HLA-DRB1 are also connected by a short path via the disease node ‘rheumatoid arthritis’. However, sarcoidosis has 5864 direct neighbors, all of which split the total probability of jumping from sarcoidosis to other nodes (total probability is 1). Hence, the probabilities for each sarcoidosis’s neighbor to be reached (edge weight in between sarcoidosis and the current neighbor normalized by the sum of edge weights between sarcoidosis and all neighbors) are almost identical: difference between the largest and smallest probability is only . The ranking scores are determined by the probability of reaching each node from the seed. As a result, the ranks for all sarcoidosis’s neighbors are sensitive to noises, since their scores are extremely close.
For example, we found the sarcoidosis—rheumatoid arthritis connection, which leads to the identification HLA-DRB1, is buried in the 5864 neighbors of sarcoidosis in SBN. The edge from sarcoidosis to rheumatoid arthritis has a weight of 1.19, and the probability of reaching rheumatoid arthritis from sarcoidosis is . In the SBN, a total of 356 neighbors for sarcoidosis has similar weights (difference < 0.05); the probabilities of reaching these neighbors from sarcoidosis is in the range between and , which are close to the probability for rheumatoid arthritis. However, rheumatoid arthritis is the only disease among them that can lead to HLA-DRB1. In the cross validation result, HLA-DRB1 is ranked in top 10% for sarcoidosis using SBN, while it is ranked in top 3% using CSN.
In summary, the case study shows that the difference in network structure for CSN and SBN contributes greatly to their performance difference. For CSN, the connections between diseases and phenotypes are sparse and based on observational facts. For SBN, the disease nodes in SBN have large numbers of neighbors (averagely, the disease nodes have 3994 direct neighbors). Therefore, the probabilities for a seed node reaching each neighbor are low, and the ranking scores for each nodes become very similar, thus sensitive to noises.
3.3 Stratified evaluation across broad types of diseases
We evaluated the performance for the nine disease classes. The CSN approach achieved higher gene ranking for all disease classes. Table 6 shows the average ranks for retained genes for each disease class in the de novo cross validation. For nervous system disorders, CSN increased the average rank for known disease genes by 59%, from top 10.9% to top 4.5%. The improvement from SBN to CSN is significant for the first four disease classes in Table 6, including nervous system disorder, malignant neoplasms, cardiovascular disease, and metabolic disorder (). We found that the disease classes with small improvements usually have specific phenotypes, which can accurately direct them to phenotypically similar diseases that also share genetic causes in SBN. On the other hand, the disease classes with large improvements are complex diseases, which are likely to share phenotype features with too many other diseases in SBN. In this case, CSNs allow more informative interconnections while SBNs tend to bury the information under large amounts of links.
Table 6.
Average rank for retained genes in the de novo cross validation for nine disease classes
| Disease class | SBN | CSN | Improvement |
|---|---|---|---|
| Nervous system disorder | 10.90% | 4.50% | 59% |
| Malignant neoplasms | 10.20% | 4.40% | 57% |
| Cardiovascular disease | 10.10% | 4.60% | 54% |
| Metabolic disorder | 11.30% | 5.70% | 50% |
| Mental disorder | 18.30% | 10.90% | 40% |
| Musculoskeletal and connective tissue disorders | 8.10% | 5.30% | 35% |
| Digestive system disorders | 13.40% | 8.90% | 34% |
| Congenital malformations and deformations | 8% | 5.70% | 29% |
| Skin and subcutaneous tissue diseases | 12.70% | 9.10% | 28% |
3.4 Translational implications of CSN: candidate gene and drug target discovery for PD
We ranked the 17 906 genes in the PPI network for PD and compared the result with 888 PD genes from the online database based on GWAS meta-analysis. Figure 9a shows that the number of PD genes drops when the rank based on our approach changes from the top to the bottom. Among the top 5% in our rank, we found 217 overlaps with the PD genes, which is a 2.5-fold enrichment () compared with the average of 1000 random gene ranks. The result shows that our candidate genes are enriched for PD genes obtained through statistical analysis on large-scale patient data, and indicates that the top-ranked genes are relevant.
Fig. 9.
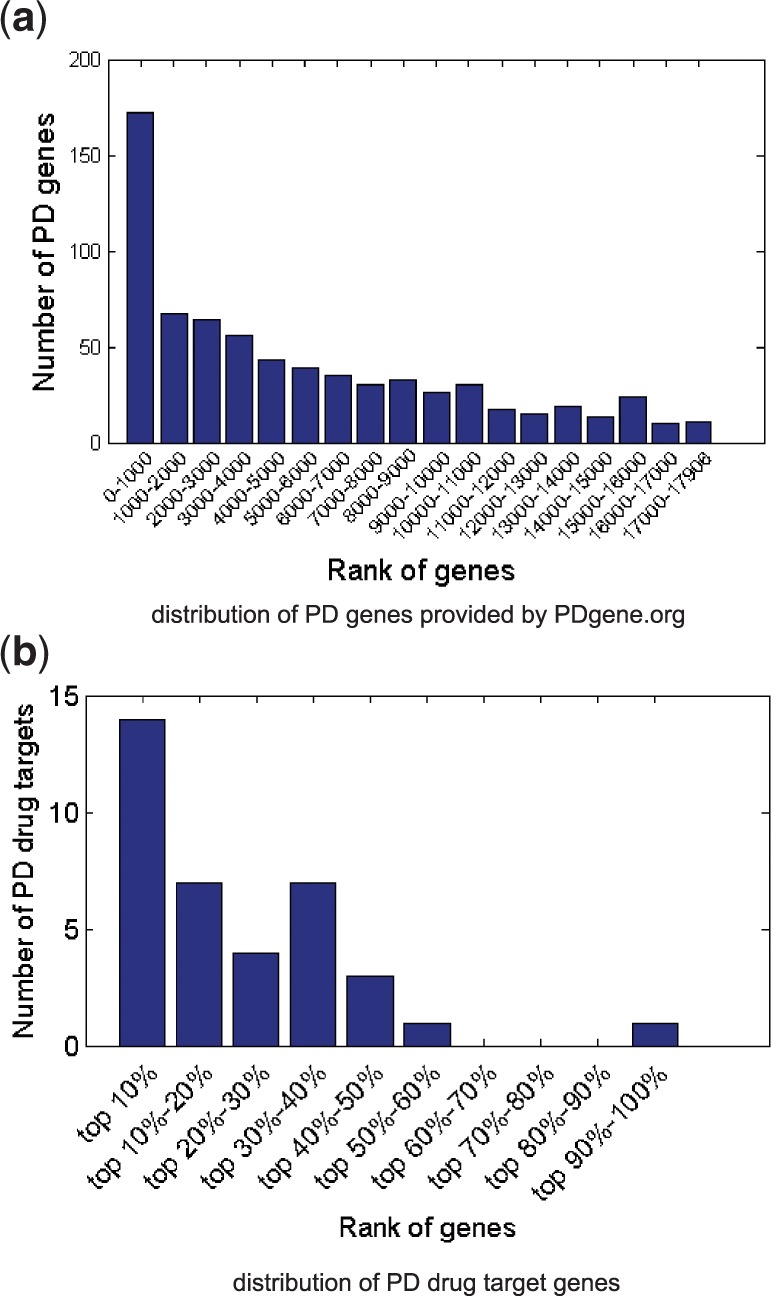
The ranking for the 888 PD genes and PD drug targets based on GWAS meta-analysis
We also evaluated the ranking of 42 target genes for 22 approved PD drugs in FDA label. Figure 9b shows that the top-ranked genes are highly enriched for the PD drug targets. A total of 11 targets were ranked within top 5%, and the number is a 5.8-fold enrichment () comparing with the random. Among them, DRD2 was ranked within top 0.6% and is one of the target genes for levodopa, which is currently the most effective drug for PD. In addition, the top-ranked drug targets besides the 11 targets for PD approved drugs represent translation potential of drug repositioning.
The pathway analysis software identified 407 significant pathways associated with the top 5% candidate genes. Highly relevant pathways among them include ‘Parkinson’s signaling’, ‘Oxidative stress response’, ‘dopamine receptor signaling’ and ‘mitochondrial dysfunction’. In addition, many cancer pathways also appear in the significant pathway list. Evidence based on previous studies support the underlying genetic association between PD and cancers (Plun-Favreau et al., 2010; Wirdefeldt et al., 2011). The identification of known PD pathways also supports the relevance of our candidate genes.
Interestingly, we found three out of the five top-ranked pathways (ranked 1, 3 and 4) with the most significant p values are involved with mechanistic target of rapamycin (mTOR) signaling (Table 7). We traced back to our gene ranking list and found that mTOR is ranked at top 2% among 17 906 human genes. The mTOR signaling pathway has a number of important physiological functions, including cell growth, proliferation, metabolism, protein synthesis, and autophagy (Hay and Sonenberg, 2004). Existing knowledge supports that it is directly related to cellular proliferation, cancer, and longevity (Lamming et al., 2012). Several previous studies discuss the potential relationship between mTOR and neurodegeneration (Bové et al., 2012), which shows evidence for its relationship with PD. In addition, mTOR is a drug target gene. Previous studies point out that rapamycin, which inhibit the mTOR signaling, shows anti-aging and neuroprotective effects (Bové et al., 2011; Kaeberlein, 2010). These evidences from literature support our prediction. Driven by the prediction result, we are currently examining the implication of mTOR pathway in PD pathophysiology and validating if rapamycin rescue neurodegeneration in PD animal models.
Table 7.
Top-ranked canonical pathways based on the top 5% candidate genes identified by CSN gene prediction approach
| Rank | Top canonical pathways |
|---|---|
| 1 | EIF2 signaling |
| 2 | Protein uniquitination pathway |
| 3 | mTOR signaling pathway |
| 4 | Regulation of eIF4 and p70S6K Signaling |
| 5 | Huntington’s Disease Signaling |
4 Discussion
In this study, we explored a novel strategy to predict disease-gene associations based on the CSNs, which capture both the semantic meaning and the strength of the links between diseases. We constructed CSNs using the disease-phenotype semantic relationships from UMLS and HPO, and integrated them with a PPI network. Cross validation shows that the CSN-based disease gene prediction achieved significantly better performance and SBN-based approach. A specific example shows that the context-sensitive interconnections between diseases and the phenotype-links in CSNs both contribute to improve the performance. A case study on PD shows that CSN-predicted genes have translational implications and have the potential to become drug targets.
Our study has a few future works. First, we currently used the most specific phenotype concepts in constructing the network and have not considered the semantic similarities between phenotypes based on the ontology hierarchy. In HPO, if two terms have the same parent in the hierarchy, they may also share commonalities and indicate overlapping genetic basis. In addition, we have not weighted the phenotype nodes in CSNs by their frequency as the previous approaches did (Chen et al., 2015b; Robinson et al., 2014; van Driel et al., 2006). We assumed that the network-based gene ranking algorithm will automatically down-weight the common phenotypes, which are less informative in implying genetic basis than the rare phenotypes: the common phenotypes are connected with more disease nodes than the rare ones, and a path that passes through the common phenotypes have lower probability of reaching the goal. In the future, we will explore different ways to leverage the relationships between phenotypes as well as weighting the importance of phenotype nodes in the network.
Second, we currently extend the standard random walk model to predict genes based on the CSNs, assuming that that paths that combining different kinds of nodes are reasonable. For example, the path ‘disease-phenotype-disease-gene’ and ‘disease-gene-disease-phenotype-gene’ are treated equally valid to make predictions on new disease-gene associations. In practice, different paths may lead to different prediction power, and should be assigned different importance. However, identifying the paths with high prediction power is not trivial. One possible approach is to automatically learn from existing disease-gene associations. Besides random walking, other advanced network ranking and clustering algorithms (Ni et al., 2014, 2015), which has extensive applications in disease gene prediction and drug discovery, may also be improved when combined with our concept of content-sensitive networks. In the future, we will explore improved algorithm to further take the advantages of CSNs.
Third, the genes identified by the computational approach need to be further validated and investigated. The computational disease gene prediction approach only provides leads on possible genetic basis for the disease. How the candidate genes affect the disease is still unclear and requires biological experiments to demonstrate. After disease mechanism is figured out, we will be able to consider the drug targets on the relevant pathway. In this study, we pin-pointed mTOR as a candidate gene and drug target for PD. Though a number of evidences support the anti-aging and neuroprotective effect of mTOR, we will further validate the result through more animal model studies.
5 Conclusion
We constructed CSNs and used them to predict disease genes. Our approach significantly improves the gene prediction comparing with the approach using similarity-based disease networks. Both the context-sensitive disease connections and the phenotype-gene links contribute in improving the gene prediction performance. We used the approach to predict genes for PD. The top ranked candidate genes are enriched for independently identified PD genes. We also identified a novel candidate drug target for PD that may have neuroprotective effects.
Funding
The project was supported by the Eunice Kennedy Shriver National Institute of Child Health and Human Development of the National Institutes of Health under the NIH Director’s New Innovator Award number DP2HD084068.
Conflict of Interest: none declared.
References
- Barabási A.L. et al. (2011) Network medicine: a network-based approach to human disease. Nat. Rev. Genet., 12, 56–68. [DOI] [PMC free article] [PubMed] [Google Scholar]
- Bové J. et al. (2011) Fighting neurodegeneration with rapamycin: mechanistic insights. Nat. Rev. Neurosci., 12, 437–452. [DOI] [PubMed] [Google Scholar]
- Bodenreider O. (2004) The unified medical language system (UMLS): integrating biomedical terminology. Nucleic Acids Res., 32, D267–D270. [DOI] [PMC free article] [PubMed] [Google Scholar]
- Brooks D.J. (2008) Optimizing levodopa therapy for Parkinson’s disease with levodopa/carbidopa/entacapone: implications from a clinical and patient perspective. Neuropsychiatr. Dis. Treat., 4, 39.. [DOI] [PMC free article] [PubMed] [Google Scholar]
- Brunner H.G., Van Driel M.A. (2004) From syndrome families to functional genomics. Nat. Rev. Genet., 5, 545–551. [DOI] [PubMed] [Google Scholar]
- Campillos M. et al. (2008) Drug target identification using side-effect similarity. Science, 321, 263–266. [DOI] [PubMed] [Google Scholar]
- Chen Y. et al. (2011) Uncover disease genes by maximizing information flow in the phenome-interactome network. Bioinformatics, 27, i167–i176. [DOI] [PMC free article] [PubMed] [Google Scholar]
- Chen Y. et al. (2015a) Disease comorbidity network guides the detection of molecular evidence for the link between colorectal cancer and obesity. AMIA Summit. Transl. Sci. Proc., 2015, 201–206. [PMC free article] [PubMed] [Google Scholar]
- Chen Y. et al. (2015b) Phenome-driven disease genetics prediction toward drug discovery. Bioinformatics, 31, i276–i283. [DOI] [PMC free article] [PubMed] [Google Scholar]
- Chen Y., Xu R. (2014) Mining cancer-specific disease comorbidities from a large observational health database. Cancer Inform., 13, 37–44.. [DOI] [PMC free article] [PubMed] [Google Scholar]
- Chen Y., Xu R. (2015) Network-based gene prediction for Plasmodium falciparum malaria towards genetics-based drug discovery. BMC Genomics, 16, 1.. [DOI] [PMC free article] [PubMed] [Google Scholar]
- Chen Y. et al. (2015c). Combining human disease genetics and mouse model phenotypes towards drug repositioning for Parkinson’s disease In AMIA Annual Symposium Proceedings 2015. American Medical Informatics Association; San Francisco, CA, pp. 1851–1860. [PMC free article] [PubMed] [Google Scholar]
- Chen Y. et al. (2015d) Comparative analysis of a novel disease phenotype network based on clinical manifestations. J. Biomed. Inform., 53, 113–120. [DOI] [PMC free article] [PubMed] [Google Scholar]
- Connolly B.S., Lang A.E. (2014) Pharmacological treatment of Parkinson’s disease: a review. jama, 311, 1670–1683. [DOI] [PubMed] [Google Scholar]
- De Lau L.M., Breteler M.M. (2006) Epidemiology of Parkinson’s disease. Lancet Neurol., 5, 525–535. [DOI] [PubMed] [Google Scholar]
- Franceschini A. et al. (2013) STRING v9. 1: protein-protein interaction networks, with increased coverage and integration. Nucleic Acids Res., 41, D808–D815. [DOI] [PMC free article] [PubMed] [Google Scholar]
- Goh K.I. et al. (2007) The human disease network. Proc. Natl. Acad. Sci. USA, 104, 8685–8690. [DOI] [PMC free article] [PubMed] [Google Scholar]
- Gottlieb A. et al. (2011) PREDICT: a method for inferring novel drug indications with application to personalized medicine. Mol. Syst. Biol., 7, 496.. [DOI] [PMC free article] [PubMed] [Google Scholar]
- Hay N., Sonenberg N. (2004) Upstream and downstream of mTOR. Genes Dev., 18, 1926–1945. [DOI] [PubMed] [Google Scholar]
- Hurle M.R. et al. (2013) Computational drug repositioning: from data to therapeutics. Clin. Pharmacol. Ther., 93, 335–341. [DOI] [PubMed] [Google Scholar]
- Hwang T. et al. (2012) Co-clustering phenome-genome for phenotype classification and disease gene discovery. Nucleic Acids Res., 40, e146.. [DOI] [PMC free article] [PubMed] [Google Scholar]
- Iorio F. et al. (2010) Discovery of drug mode of action and drug repositioning from transcriptional responses. Proc. Natl. Acad. Sci. USA, 107, 14621–14626. [DOI] [PMC free article] [PubMed] [Google Scholar]
- Kaeberlein M. (2010) Resveratrol and rapamycin: are they antiaging drugs? Bioessays, 32, 96–99. [DOI] [PubMed] [Google Scholar]
- Köhler S. et al. (2013) The Human Phenotype Ontology project: linking molecular biology and disease through phenotype data. Nucleic Acids Res., 42, D966–D974. [DOI] [PMC free article] [PubMed] [Google Scholar]
- Lage K. et al. (2007) A human phenome-interactome network of protein complexes implicated in genetic disorders. Nat. Biotechnol., 25, 309–316. [DOI] [PubMed] [Google Scholar]
- Lamming D.W. et al. (2012) Rapamycin-induced insulin resistance is mediated by mTORC2 loss and uncoupled from longevity. Science, 335, 1638–1643. [DOI] [PMC free article] [PubMed] [Google Scholar]
- Li Y., Patra J.C. (2010) Genome-wide inferring gene-phenotype relationship by walking on the heterogeneous network. Bioinformatics, 26, 1219–1224. [DOI] [PubMed] [Google Scholar]
- Lill C.M. et al. (2012) Comprehensive research synopsis and systematic meta-analyses in Parkinson’s disease genetics: the PDGene database. PLoS Genet., 8, e1002548. [DOI] [PMC free article] [PubMed] [Google Scholar]
- Maggiora G. et al. (2013) Molecular similarity in medicinal chemistry: miniperspective. J. Med. Chem., 57, 3186–3204. [DOI] [PubMed] [Google Scholar]
- Ni J. et al. (2016) Disease gene prioritization by integrating tissue-specific molecular networks using a robust multi-network model. BMC Bioinformatics, 17, 453.. [DOI] [PMC free article] [PubMed] [Google Scholar]
- Ni J. et al. (2015) Flexible and robust multi-network clustering. In: Proceedings of the 21th ACM SIGKDD International Conference on Knowledge Discovery and Data Mining. ACM, Sydney, NSW, Australia, pp. 835–844.
- Ni J. et al. (2014) Inside the atoms: ranking on a network of networks. In: Proceedings of the 20th ACM SIGKDD international conference on Knowledge discovery and data mining. ACM, New York, pp. 1356–1365.
- Okada Y. et al. (2014) Genetics of rheumatoid arthritis contributes to biology and drug discovery. Nature, 506, 376–381. [DOI] [PMC free article] [PubMed] [Google Scholar]
- Olanow C.W. et al. (2009) The scientific and clinical basis for the treatment of Parkinson’s disease. Neurology, 72(21 Suppl. 4), S1–S136. [DOI] [PubMed] [Google Scholar]
- Oti M. et al. (2009) The biological coherence of human phenome databases, The AmeriCSN. J. Hum. Genet., 85, 801–808. [DOI] [PMC free article] [PubMed] [Google Scholar]
- Plenge R.M. et al. (2013) Validating therapeutic targets through human genetics. Nat. Rev. Drug Discov., 12, 581–594. [DOI] [PubMed] [Google Scholar]
- Plun-Favreau H. et al. (2010) Cancer and neurodegeneration: between the devil and the deep blue sea. PLoS Genet., 6, e1001257.. [DOI] [PMC free article] [PubMed] [Google Scholar]
- Robinson P.N. et al. (2008) The Human Phenotype Ontology: a tool for annotating and analyzing human hereditary disease. Am. J. Hum. Genet., 83, 610–615. [DOI] [PMC free article] [PubMed] [Google Scholar]
- Robinson P.N. et al. (2014) Improved exome prioritization of disease genes through cross-species phenotype comparison. Genome Res., 24, 340–348. [DOI] [PMC free article] [PubMed] [Google Scholar]
- Sun Y. et al. (2012) Integrating meta-path selection with user-guided object clustering in heterogeneous information networks. In: Proceedings of the 18th ACM SIGKDD International Conference on Knowledge Discovery and Data Mining. ACM, Beijing, China, pp. 1348–1356.
- van Driel M.A. et al. (2006) A text-mining analysis of the human phenome. Eur. J. Hum. Genet., 14, 535–542. [DOI] [PubMed] [Google Scholar]
- Vanunu O. et al. (2010) Associating genes and protein complexes with disease via network propagation. PLoS Comput. Biol., 6, e1000641.. [DOI] [PMC free article] [PubMed] [Google Scholar]
- Vidović D. et al. (2013) Large-scale integration of small molecule-induced genome-wide transcriptional responses, Kinome-wide binding affinities and cell-growth inhibition profiles reveal global trends characterizing systems-level drug action. Front. Genet., 5, 342.. [DOI] [PMC free article] [PubMed] [Google Scholar]
- Wirdefeldt K. et al. (2011) Epidemiology and etiology of Parkinson’s disease: a review of the evidence. Eur. J. Epidemiol., 26, 1–58. [DOI] [PubMed] [Google Scholar]
- Wu X. et al. (2008) Networkbased global inference of human disease genes. Mol. Syst. Biol., 4, 189.. [DOI] [PMC free article] [PubMed] [Google Scholar]
- Wu X. et al. (2009) Align human interactome with phenome to identify causative genes and networks underlying disease families. Bioinformatics, 25, 98–104. [DOI] [PubMed] [Google Scholar]
- Xu R. et al. (2013) Towards building a disease-phenotype knowledge base: extracting disease-manifestation relationship from literature. Bioinformatics, 29, 2186–2194. [DOI] [PMC free article] [PubMed] [Google Scholar]
- Xu R., Wang Q. (2015) PhenoPredict: a disease phenome-wide drug repositioning approach towards schizophrenia drug discovery. J. Biomed. Inform., 56, 348–355. [DOI] [PMC free article] [PubMed] [Google Scholar]
- Yu X. et al. (2014) Personalized entity recommendation: a heterogeneous information network approach. In: Proceedings of the 7th ACM international conference on Web search and data mining. ACM, New York, NY, pp. 283–292.
- Zhou X. et al. (2014) Human symptoms-disease network. Nat. Commun., 5, 4212. doi: 10.1038/ncomms5212. [DOI] [PubMed] [Google Scholar]


