Abstract
Background: Gene- and pathway-based analyses offer a useful alternative and complement to the usual single SNP-based analysis for GWAS. On the other hand, most existing gene- and pathway-based tests are not highly adaptive, and/or require the availability of individual-level genotype and phenotype data. It would be desirable to have highly adaptive tests applicable to summary statistics for single SNPs. This has become increasingly important given the popularity of large-scale meta-analyses of multiple GWASs and the practical availability of either single GWAS or meta-analyzed GWAS summary statistics for single SNPs.
Results: We extend two adaptive tests for gene- and pathway-level association with a univariate trait to the case with GWAS summary statistics without individual-level genotype and phenotype data. We use the WTCCC GWAS data to evaluate and compare the proposed methods and several existing methods. We further illustrate their applications to a meta-analyzed dataset to identify genes and pathways associated with blood pressure, demonstrating the potential usefulness of the proposed methods. The methods are implemented in R package aSPU, freely and publicly available.
Availability and implementation: https://cran.r-project.org/web/packages/aSPU/
Contact: weip@biostat.umn.edu
Supplementary information: Supplementary data are available at Bioinformatics online.
1 Introduction
In spite of the tremendous success of genome-wide association studies (GWASs), due to modest to small effect sizes of the majority of causal SNPs for complex and common disease, large sample sizes and more powerful statistical tests are always needed. Furthermore, even when some associated SNPs or loci are identified by the most popular single SNP-based analysis, it is often extremely difficult to offer a functional interpretation that can shed light on the underlying biology. As alternatives, gene- and pathway-based analyses have been proposed and applied for single traits, demonstrating their useful and complementary roles (Fan et al., 2015; Pan, 2009; Schaid et al., 2012; Wang et al., 2007, 2010; Wu et al., 2010). A statistical challenge is that, due to unknown true association patterns, there is no uniformly most powerful test to detect multiple SNP-single trait associations; an association test may perform well for one dataset, but not necessarily for another. For example, the presence of non-associated SNPs will largely diminish the power of a standard test if no effective SNP selection or weighting is adopted (Petersen et al., 2013). Pan et al. (2014) proposed a data-adaptive (aSPU) approach based on estimating and selecting the most powerful test among a class of so-called sum of powered score (SPU) tests, which cover several popular tests as special cases, such as the burden test, a variance component test and a univariate test. The main idea is to use various values of a parameter to construct data-driven and varying weights for the SNPs, thus adaptive to unknown signal sparsity and association directions among the multiple SNPs being tested. Furthermore, Pan et al. (2015) extended the methodology to pathway analysis (aSPUpath). In particular, two parameters are introduced such that the test is adaptive at both the SNP and gene levels. As demonstrated therein, due to their high data-adaptivity, the two adaptive tests remained powerful across a wide range of scenarios.
However, the two adaptive tests for gene- and pathway-single trait associations are only applicable to the case with individual-level genotype and phenotype data. Due to various reasons, it is often difficult for many researchers to obtain access to individual-level data. At the same time, it is easier to obtain access to some summary statistics, e.g. P-values, of individual SNPs in a GWAS. In addition, use of some summary statistics is often necessary for practical meta analyses, which have become increasingly popular and important for complex disease and traits (de Bakker et al., 2008). Here we propose extending the two highly adaptive tests to the case with only summary statistics for individual SNPs, demonstrating their applications to a meta-analyzed GWAS dataset for blood pressure (Ehret et al., 2011).
In numerical examples we compared our methods with gene-based GATES (Li et al., 2011) and three pathway-based approaches, GATES-Simes (Gui et al., 2011), HYST (Li et al., 2012) and MAGMA (de Leeuw et al., 2015). All methods are for a single (univariate) trait. GATES adopts an extended Simes procedure to correct multiple testing while calculating the P-value quickly based on SNP summary statistics. GATES-Simes extends the main idea of GATES to extract the most significant gene-level P-value for a pathway, whereas HYST uses Fisher’s method to combine multiple genes’ P-values. MAGMA is based on multiple regression. We also considered one gene set enrichment analysis (GSEA) method, i-GSEAGWAS (Zhang et al., 2013), an extension of GSEA (Subramanian et al., 2005) to GWAS summary statistics. Note that here our goal is global association testing in the category of ‘self-contained tests’ with a null hypothesis H0 that none of any genes in a pathway is associated with disease, in contrast to enrichment or competitive testing with a null hypothesis that the proportion of associated genes in a pathway is no more than that in the rest of the genes; since rejecting implies rejecting H0, a global testing is often more powerful than an enrichment analysis (Goeman et al., 2007).
The proposed methods are available in R package aSPU, which is downloadable from CRAN.
2 Methods
We first assume that individual genotype and phenotype data are available, facilitating the derivation of our proposed methods later. Suppose for individual , we have a quantitative or binary trait Yi, and a vector of the genotype scores for k SNPs , possibly drawn from either a single gene or a pathway with multiple genes. As usual we use the additive coding for each SNP: Xij = 0, 1 or 2 is the count of an allele at SNP j for subject i. We also assume a vector of covariates Wi. We adopt a generalized linear model (GLM):
where is the link function (i.e. the identity function for a quantitative trait, or a logit function for a binary trait). We would like to test the null hypothesis ; that is, there is no association between any SNP and the trait under H0. The score vector for β is
where is the estimated mean of Yi in the null model (under H0). The covariance matrix of U can be estimated as
with its mean under H0 as
| (1) |
where and .
2.1 A gene-based adaptive test with summary statistics
Now, suppose that we do not have individual-level data (Yi, Xi)’s but only single SNP-based summary statistics, say Z-scores with for ; the approximation is based on the asymptotic equivalence between the Wald test and the score test. A key observation is that
where the last approximation is based on Eq. (1). Note that Corr(X) can be easily estimated from some reference panel, e.g. the CEU sample in the Hapmap data or 1000 Genome data, for a similar target population. Accordingly, we obtain an estimate of , say R.
Mimicking the SPU and aSPU tests for individual genotype and phenotype data, we can now define the corresponding tests with only summary statistics Z:
| (2) |
where is the P-value of the SPUs test, and is often used. Note that since as an even integer , we define .
An optimal choice of γ depends on the unknown SNP-trait association patterns. For example, if most SNPs are (almost) equally associated with the trait in the same direction, then the burden test SPUs(1) will be (nearly) most powerful; if only one or few SNPs are associated with the trait, then using a larger γ, e.g. SPUs(8) or SPUs(), is expected to be more powerful; on the other hand, if the truth is between the above two extremes, then using an intermediate , e.g. SPUs(2) that is similar to a variance-component test like KMR or SKAT (Liu et al., 2007; Pan, 2011; Wu et al., 2010), may have higher power. Note that SPUs() is exactly the same as the univariate minimum P-value method most often used in GWAS. Since we do not know the optimal value of γ, we try multiple ones in Γ and then estimate and select the best one by aSPUs. Note that, in our experience, often SPUs(8) and SPUs() give almost identical results, hence we do not try any γ values between 8 and in Γ.
By the asymptotic distribution of U, we know that for a large n, under H0, Z follows a multivariate normal distribution N(0, R), where R is the correlation matrix of Xi that can be estimated from some reference panel as discussed. Based on this known null distribution of Z, we use Monte Carlo simulations to obtain the P-values of the SPUs and aSPUs tests. Specifically, (i) we generate independent for ; (ii) calculate the null SPU test statistics ; (iii) the P-value for is , and that for is ; (iv) calculate ; (v) finally the P-value for the aSPUs test is .
Sometimes only the P-values for individual SNPs are available while we do not know the association direction for each SNP. In this case, we calculate , where pj is the P-value for SNP j and is the CDF of the standard normal distribution N(0, 1). Then we will replace Zj’s by ’ s in the above formula (2) (and do so similarly for the null statistics too).
2.2 A pathway-based adaptive test with summary statistics
The idea of substituting a Score vector with Z-scores can be similarly extended to an adaptive pathway-level test (Pan et al., 2015). Given a pathway S with genes, we partition its Z-scores as with subvector for gene g (with kg SNPs). Then we define the gene- and pathway-based SPU tests as
where two integers and are used to adaptively weight the SNPs and genes respectively. For example, a larger γG (or γ) is more effective when there are a smaller number of genes (or SNPs) associated with the trait. Since the optimal values of () are unknown, to adaptively choose (), we propose
aiming to select the most powerful one from multiple PathSPU tests. We used and as in Pan et al. (2015). A Monte Carlo simulation scheme as described for the SPUs and aSPUs tests is used to obtain the P-values. However, now the dimension of Z is possibly larger, leading to a much larger correlation matrix R. For computational efficiency, we assume that any SNPs in different chromosomes are independent, leading to a block-diagonal R.
Given that most genes and pathways will not be significant in most applications, we employ a stage-wise strategy to gradually increase the simulation number B to save computing time for aSPUs and aSPUsPath. In the later applications, we first performed B = 5000 simulations for all genes and pathways, and then increased B to 106 or 107 for those genes (or 105 for pathways) with a P-value < 0.003.
3 Applications
3.1 WTCCC data
To demonstrate the validity and performance of our proposed method, we designed a ‘Control–Control’ experiment and a usual Case–Control experiment using Wellcome Trust Case Control Consortium (WTCCC) GWAS data for Crohn’s disease (CD) (Consortium, 2007). CD is an autoimmune disease with a strong genetic component. The WTCCC GWAS dataset contains about 2000 CD-affected cases and about 3000 controls with a total of 500 568 SNPs. Following the WTCCC’s quality control (QC) recommendations, we removed subjects and SNPs that did not pass the QC criteria, resulting in 469 612 SNPs in 1748 case subjects and 2938 control subjects. We further removed SNPs with MAF <5% since we would use a small reference panel to infer the LD structure for a set of SNPs.
In a Control–Control experiment, we randomly divided the controls into two groups, each with 1469 samples, then tested for possible association between the group indicator and a gene or a pathway. Since no association was expected, the goal was to investigate how well a method could control type I errors or false positives. In a Case–Control analysis, the two groups contained 1748 cases and 2938 controls respectively, and we’d like to see the power of a method to detect possible associations. We calculated the Z-score for each SNP based on individual-level data, then used only the Z-scores in subsequent analyses for any summary statistics-based method. We analyzed 4572 genes mapped to 186 KEGG pathways. The significance threshold after the Bonferroni correction was 0.05/4572 = for gene-based analysis, or for pathway-based analysis. The simulation number of was used as a default, though we also used for comparison in aSPUs and aSPUsPath.
3.1.1 Choice of the reference panels
We first investigated how the choice of the reference panels in estimating LD among SNPs might influence the performance. We considered three ways to estimate a correlation matrix R among the SNPs: using (i) 90 Hapmap CEU samples, (ii) 100 randomly chosen WTCCC control samples and (iii) the whole 2938 WTCCC controls.
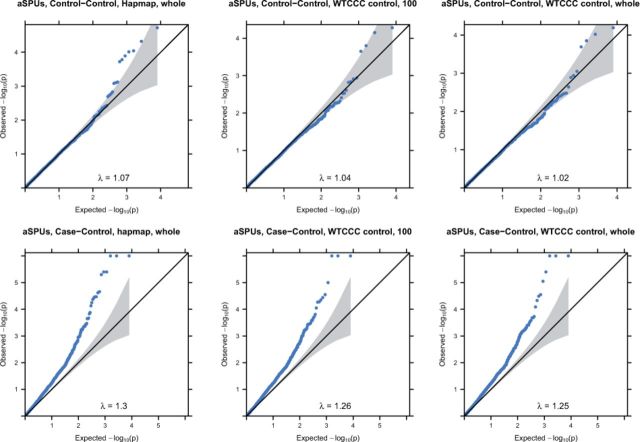
Figure 1 shows the QQ plots of the aSPUs P-values based on each of the three ways to estimate the correlation matrix for the Control–Control experiment (upper row) and Case–Control experiment (lower row). Based on the Control–Control analysis, we conclude that using the Hapmap samples seemed to give a bit inflated type I errors while the other two performed well. The less desirable performance of using the Hapmap samples could be due to the small sample size, leading to unstable estimates. However, by comparison with that of using 100 WTCCC controls, it was more likely due to some inherent differences between the two panels.
Fig. 1.
QQ plots of aSPUs P-values from a Control–Control analysis (top rows) and a Case–Control analysis (bottom row) of the WTCCC CD data. The correlation matrices were estimated using the 90 Hapmap CEU samples, 100 and all 2938 WTCCC controls respectively
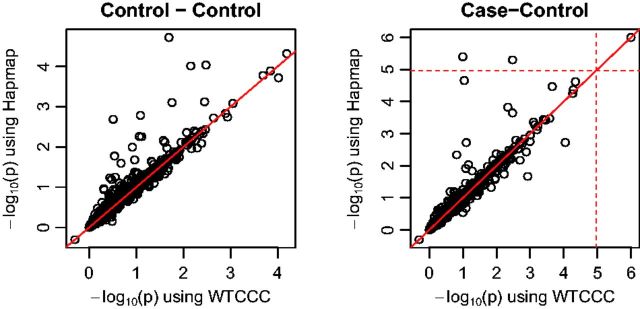
Treating using the whole WTCCC controls as the gold standard, we compared in more details about the estimated P-values in Figure 2. Most points are on the identity line. However some points are above the line, implying that using the Hapmap panel over-estimated the significance levels of several genes (i.e. with smaller P-values). Nevertheless, the agreement of the aSPUs P-values based on the reference panels was high: their correlation coefficients in both experiments were 0.98. In summary, the performance using any reference panel was mostly satisfactory with an estimated inflation factor λ close to 1 (e.g. for the Hapmap panel for the Control–Control experiment of the WTCCC data).
Fig. 2.
Comparison of transformed P-values of aSPUs with correlation matrices estimated from the Hapmap panel versus from all WTCCC controls. The dotted lines indicate the significance threshold. The Pearson correlation coefficients in the two panels are both 0.98
For comparison, we also included the QQ-plots for GATES in Supplementary Figure S1. Since GATES uses a few most significant P-values to reach a gene-level P-value, it is more robust to estimation errors of the LD structure among SNPs, giving less inflated significance levels in the extreme. However, due to its numerical approximations in P-value calculations, it had slightly higher inflation factors (e.g. for the Hapmap panel for the Control–Control experiment of the WTCCC data).
3.1.2 Choice of simulation number
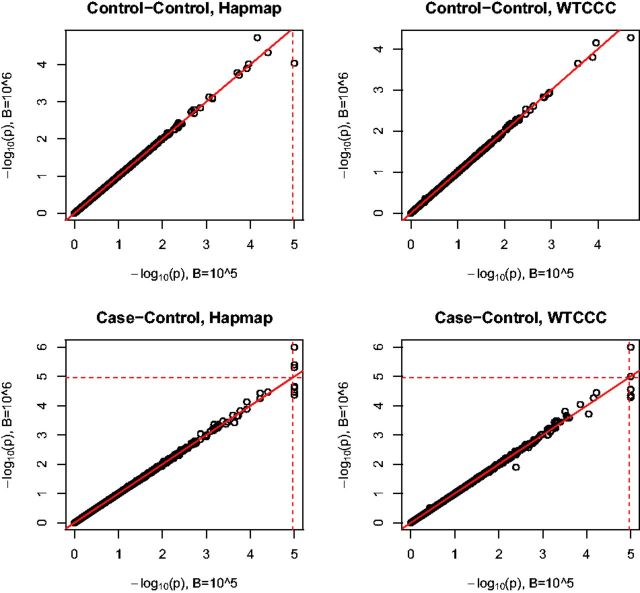
Next we investigated the effects of the simulation number B on the P-value of the aSPUs test. Figure 3 compares the results with versus ; we used either the 100 Hapmap samples or the whole WTCCC controls to estimate the correlation matrices in the Control–Control or Case–Control analysis. Overall there was barely any difference between using and . As expected, the more significant a P-value, a larger B is required. In particular, would be sufficient to estimate P-values for most genes.
Fig. 3.
Comparison of transformed P-values of aSPUs with the simulation number versus . The dotted lines indicate the Bonferroni-corrected significance threshold
3.1.3 Pathway analysis
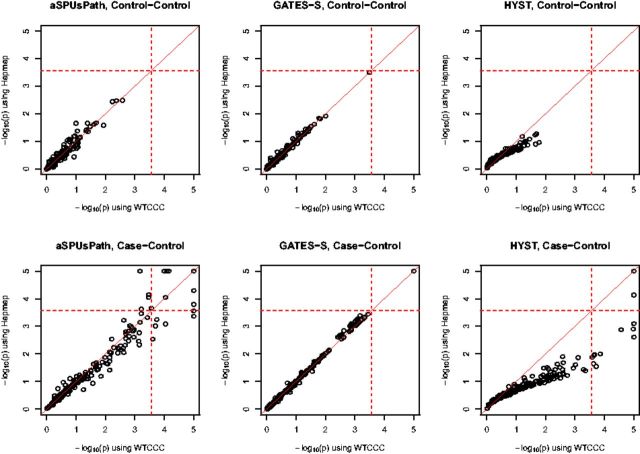
We first investigated how the choice of the reference panel might influence the performance of a pathway-level test. Again we used either the 90 Hapmap samples or all WTCCC controls to estimate the correlation matrices. Figure 4 compares the results for each of the three methods, aSPUsPath, GATES-Simes and HYST. Perhaps due to more SNPs in a gene set (pathway), aSPUsPath appeared to be more robust than aSPUs to estimation errors using a small reference panel. Again GATES-Simes was very robust due to its use of only a few top SNPs and genes to construct its test statistic. GATES-Simes identified the same 5 pathways with any choice of the reference panels based on the threshold of P < 0.00025. HYST seemed to be more influenced by incorrectly estimated correlation matrices (due to its using Fisher’s method to combine the P-values of all the genes in a pathway). HYST identified the same 3 pathways using either the Hapmap panel or 100 WTCCC controls. However, it identified 12 pathways using all WTCCC controls as the reference panel. This indicates that the accuracy of estimating the correlation matrix is critical to HYST. In comparison, aSPUsPath identified 17 significant pathways using either the 100 or all WTCCC controls as the reference panel, among which 15 pathways were common; the Pearson correlation between the two sets of the P-values was 0.998. Using the Hapmap panel, aSPUsPath identified 16 significant pathways, among which 11 pathways were common with those identified by using the whole WTCCC control as the reference panel.
Fig. 4.
Comparison of transformed p-values with the Hapmap samples versus all WTCCC controls for three pathway-level tests. The dotted lines indicate the Bonferroni-corrected significance threshold. The P-values <0.00001 pointed as 0.00001 for easier comparisons among plots
Table 1 shows 17 highly significant KEGG pathways with P-values less than 0.00001 by any of the three methods. The aSPUsPath identified nine such highly significant pathways using either all or 100 WTCCC controls as the reference panel, a much larger number than those of the other two methods, suggesting possibly higher power of aSPUsPath for the WTCCC data. Furthermore, the close performance between using the two sets of the WTCCC controls as reference panels suggested that using 100 samples from the corresponding population worked well enough in identifying significant pathways.
Table 1.
. P-values of 17 KEGG pathways for the WTCCC CD GWAS data: each pathway with a P-value <0.00001 by at least one of the aSPUsPath, GATES-Simes and HYST tests using the 90 Hapmap CEU samples, 100 WTCCC controls or all WTCCC controls to estimate the SNP correlation matrices
| aSPUsPath |
Gates-Simes |
HYST |
||||||||
|---|---|---|---|---|---|---|---|---|---|---|
| KEGG ID | Pathway Names | Hapmap | WTCCC (100) | WTCCC | Hapmap | WTCCC (100) | WTCCC | Hapmap | WTCCC (100) | WTCCC |
| hsa04060 | cytokine-cytokine receptor interaction* | <0.00001 | <0.00001 | <0.00001 | <0.00001 | <0.00001 | <0.00001 | <0.00001 | <0.00001 | <0.00001 |
| hsa04630 | Jak-STAT signaling pathway* | <0.00001 | <0.00001 | <0.00001 | <0.00001 | <0.00001 | <0.00001 | <0.00001 | <0.00001 | <0.00001 |
| hsa05131 | shigellosis | <0.00001 | <0.00001 | <0.00001 | <0.00001 | <0.00001 | <0.00001 | 0.03301 | 0.02789 | 0.00113 |
| hsa04621 | NOD-like receptor signaling pathway* | <0.00001 | <0.00001 | <0.00001 | <0.00001 | <0.00001 | <0.00001 | 0.07082 | 0.05213 | 0.00624 |
| hsa04660 | T cell receptor signaling pathway* | <0.00001 | <0.00001 | <0.00001 | 0.00080 | 0.00080 | 0.00080 | 0.02838 | 0.01994 | 0.00019 |
| hsa04972 | pancreatic secretion | <0.00001 | 0.00006 | 0.00007 | 0.00072 | 0.00072 | 0.00072 | 0.05429 | 0.05058 | 0.00248 |
| hsa04640 | Hematopoietic cell lineage | <0.00001 | 0.00005 | 0.00008 | 0.11702 | 0.11702 | 0.11702 | 0.02266 | 0.01695 | 0.00023 |
| hsa04520 | Adherens junction | <0.00001 | 0.00007 | 0.00010 | 0.00056 | 0.00056 | 0.00056 | 0.16306 | 0.15241 | 0.05554 |
| hsa05320 | Autoimmune thyroid disease | <0.00001 | 0.00080 | 0.00067 | 0.00083 | 0.00116 | 0.00120 | 0.01234 | 0.00869 | 0.00260 |
| hsa04310 | Wnt signaling pathway | 0.00005 | <0.00001 | <0.00001 | 0.00057 | 0.00056 | 0.00060 | 0.07684 | 0.06521 | 0.00311 |
| hsa05330 | allograft rejection | 0.00007 | 0.00075 | 0.00033 | 0.00060 | 0.00077 | 0.00083 | 0.00007 | 0.00004 | <0.00001 |
| hsa04622 | RIG-I-like receptor signaling pathway | 0.00009 | 0.00006 | 0.00009 | <0.00001 | <0.00001 | <0.00001 | 0.30171 | 0.29538 | 0.27116 |
| hsa04062 | chemokine signaling pathway* | 0.00016 | 0.00013 | <0.00001 | 0.00130 | 0.00130 | 0.00130 | 0.04102 | 0.03437 | 0.00044 |
| hsa04940 | type I diabetes mellitus | 0.00024 | 0.00079 | 0.00060 | 0.00065 | 0.00093 | 0.00095 | 0.00081 | 0.00028 | <0.00001 |
| hsa04360 | Axon guidance | 0.00028 | <0.00001 | <0.00001 | 0.00093 | 0.00093 | 0.00093 | 0.06270 | 0.07261 | 0.00516 |
| hsa04270 | Vascular smooth muscle contraction | 0.00043 | 0.00058 | <0.00001 | 0.00085 | 0.00085 | 0.00085 | 0.06669 | 0.06365 | 0.00423 |
| hsa05416 | viral myocarditis | 0.00097 | 0.00046 | 0.00020 | 0.00097 | 0.00147 | 0.00148 | 0.00241 | 0.00126 | <0.00001 |
Asterisks (*) indicate positive control pathways.
The five KEGG pathways that have been confirmed to be associated with susceptibility to CD by meta-analysis and replication studies (Franke et al., 2010; Jostins et al., 2012; Wang et al., 2010) are all among the 17 significant pathways.
We also performed analysis with one GSEA method, i-GSEA4GWAS, but it did not find any significant pathway.
3.2 ICBP data
We illustrate the application of the methods to the summary statistics of a meta analysis by the International Consortium for Blood Pressure Genome-Wide Association Studies (ICBP GWAS) (Ehret et al., 2011). The data include the P-values of 2.6 million SNPs for the diastolic blood pressure (DBP) based on the discovery sample of 29 studies with 69 395 individuals of European ancestry. We obtained the genomic coordinates of the SNPs and genes according to the human reference genome hg19, and assigned SNPs within 2 kb upstream or downstream a gene to the gene using software MAGMA (de Leeuw et al., 2015). About 1 095 843 (41.04%) SNPs were mapped into at least one of 17543 genes. We set the gene-level significance threshold at 0.05/17543 = based on the Bonferroni correction. We used the Hapmap CEU reference panel to estimate the correlations among the SNPs, downloaded from the Plink website (Purcell et al., 2007).
3.2.1 Gene-based analysis
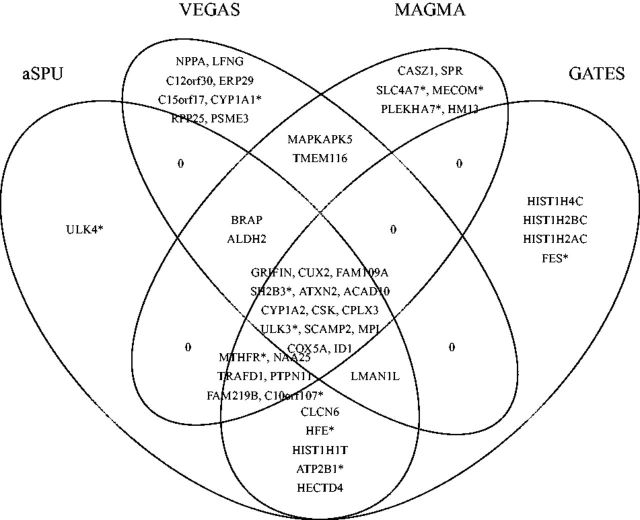
Figure 5 shows the significant genes identified by aSPUs, GATES (Li et al., 2011), VEGAS (Liu et al., 2010) and MAGMA (de Leeuw et al., 2015). We implemented the first two methods but used the original software for the latter two. In total 49 significant genes were identified by at least one method, in which 14 were common across all the methods. In comparison with a single SNP-based analysis, Ehret et al. (2011) identified 29 significant independent SNPs in 28 loci/genes for SBP and/or diastolic BP (DBP) based on a much larger sample combining both the discovery and validation samples with up to 133 661 additional individuals; even so, if only SBP was considered, 4 of the 29 SNPs were no longer significant. In contrast, as shown in Figure 5, 12 genes out of the 28 loci were detected by gene-based testing with a much smaller sample size of the discovery sample. In fact, based on single SNP analysis of only the discovery sample as used here, only 8 of the 29 independent SNPs/loci in Table 1 of Ehret et al. (2011) were significant. The Manhattan plots for the various methods are shown in Supplementary Figure S5.
Fig. 5.
Venn diagram for the significant genes identified by aSPUs, VEGAS, GATES and MAGMA, for trait DBP. The genes with a star (*) are BP-related genes in Table 1 of Ehret et al. (2011)
Since GATES is essentially a univariate method with a modified Simes procedure for multiple testing adjustment, as expected, its results were similar to that of SPUs(), which is the univariate minimum P-value method: SPUs() detected 32 associated genes, among which 28 genes overlapped with those of GATES; in comparison, SPUs(1) and SPUs(2) identified 25 and 28 significant genes, among which only 17 and 20 genes were common to those of GATES. On the other hand, the test statistic of VEGAS is , though VEGAS was implemented differently in SNP/gene mapping and covariance estimation (Liu et al., 2010), we would still expect that VEGAS and SPUs(2) performed similarly: it was confirmed that 21 of the 28 genes identified by SPUs(2) overlapped with that of VEGAS.
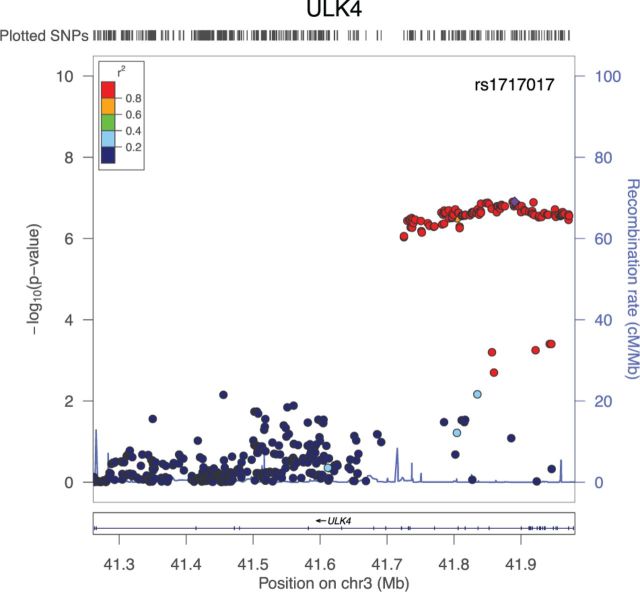
The gene ULK4 was uniquely identified by aSPUs. As shown in Figure 6, gene ULK4 contains many nearly significant SNPs and many non-significant SNPs, requiring an adaptive test like aSPUs with effective SNP weighting (or selection) to detect it. For gene HIST1H4C that was identified by GATES but not by other methods, it contained 11 SNPs; only one of the SNPs had a P-value around 2e-7 while those for other SNPs were all around 0.1 or 0.01. The P-values of aSPUs, GATES, MAGMA and VEGAS were 4.70e-6, 1.29e-6, 0.0015 and 0.00023 respectively. Due to the sparse signal with only one significant SNP, it favored a univariate method like GATES; nevertheless, due to the inclusion of SPU() (with a P-value of 2.0e-6), the P-value of the aSPUs test was almost significant. Now consider another gene BRAP that was identified by aSPUs, VEGAS and MAGMA but not by GATES. It contained 10 SNPs, 6 of which were with a P-value around 2e-6 while other SNPs were much less significant. The P-values of aSPUs, GATES, MAGMA and VEGAS were 1.3e-6, 5.06e-6, 2.065e-7 and 1e-7 respectively, confirming an advantage of aSPUs in accumulating non-sparse and weak signals with multiple moderately associated SNPs.
Fig. 6.
The significant gene ULK4 that was uniquely identified by aSPUs. The locus was also one of 28 loci identified by Ehret et al. (2011) by single SNP analysis with a much larger sample size
3.2.2 Pathway-based analysis
Finally we conducted a pathway-level analysis. We used the Kyoto Encyclopedia of Genes and Genomes (KEGG) pathways (Kanehisa et al., 2010) downloaded from MSigDB (Subramanian et al., 2005). There were 186 pathways with 4874 genes and 309 347 SNPs mapped for trait DBP. We restricted the analysis to SNPs with MAF ≥5%. We randomly removed some adjacent SNPs within 50kb in high LD with r > 0.9 based on the genotype data of the Hapmap CEU sample (release 2). We set the significance threshold at based on the Bonferroni correction.
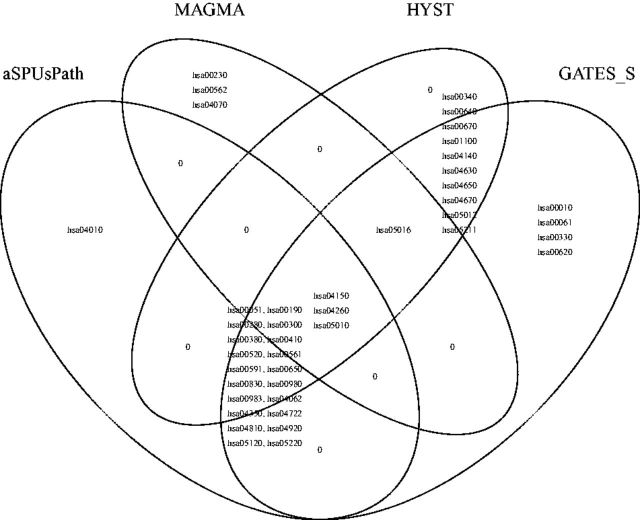
In total 42 pathways were identified to be significant, including 24 by aSPUsPath, 38 by GATES-Simes, 34 by Hyst and 7 by MAGMA, as shown in Figure 7. Here GATES-Simes and Hyst identified more pathways than aSPUsPath and MAGMA. Nevertheless, aSPUsPath uniquely identified ‘hsa04010 MAPK signaling pathway’, which contains 254 genes, including 4 known BP-related genes in Table 1 of Ehret et al. (2011); out of a total of 16503 SNPs in this pathway, 55, 21 and 6 SNPs were significant at P < 1e-5, 1e-6 and 1e-7 respectively, demonstrating multiple moderate associations (in multiple genes) and thus lower power of a univariate test like GATES-Simes.
Fig. 7.
Venn diagram for the significant KEGG pathways identified by aSPUsPath, GATES-Simes, HYST and MAGMA, for trait DBP
4 Discussion
We have proposed two adaptive tests, aSPUs and aSPUsPath, respectively for gene- and pathway-level association analyses of a univariate trait with the availability of only summary statistics, such as Z-statistics or P-values, for individual SNPs. With only summary statistics like Z-statistics or P-values, one has to recourse to some reference panel to estimate LD or correlations among SNPs, which might influence the performance of subsequent association testing. Overall, the P-values calculated from using different panels were similar as shown in our analysis of the WTCCC data. However, depending on the reference panels being used, the results for a small number of the genes or pathways could be different. Hence, caution must be taken, and an independent validation on any detected associations based on summary statistics becomes more important.
We have further illustrated the application of the proposed methods to a meta-analyzed GWAS data, demonstrating their usefulness as compared to the popular single SNP-based analysis. In addition, we have compared their performance with several other existing tests. Since there is no uniformly most powerful test for multiple SNPs, it would be desirable to have an adaptive test that can robustly maintain high, not necessarily highest, power across various scenarios, which motivated our proposed two tests (Pan et al., 2014, 2015). Our proposed tests offer an alternative and complement to existing gene- and pathway-level association testing. We have developed an R package aSPU to facilitate their use.
Supplementary Material
Acknowledgements
The authors thank the reviewers for helpful comments to improve the manuscript. This research was supported by NIH grants R01GM113250, R01HL105397 and R01HL116720, and by the Minnesota Supercomputing Institute at University of Minnesota.
Conflict of Interest: none declared.
References
- Consortium,T.W.T.C. C. (2007) Genome-wide association study of 14,000 cases of seven common diseases and 3,000 shared controls. Nature, 447, 661–678. [DOI] [PMC free article] [PubMed] [Google Scholar]
- de Bakker P. et al. (2008) Practical aspects of imputation-driven meta-analysis of genome-wide association studies. Hum. Mol. Genet., 17, R122–R128. [DOI] [PMC free article] [PubMed] [Google Scholar]
- de Leeuw C.A. et al. (2015) Magma: generalized gene-set analysis of gwas data. PLoS Comput. Biol., 11, e1004219. [DOI] [PMC free article] [PubMed] [Google Scholar]
- Ehret G.B. et al. (2011) Genetic variants in novel pathways influence blood pressure and cardiovascular disease risk. Nature, 478, 103–109. [DOI] [PMC free article] [PubMed] [Google Scholar]
- Fan R. et al. (2015) Gene level meta-analysis of quantitative traits by functional linear models. Genetics, 200, 1089–1104. [DOI] [PMC free article] [PubMed] [Google Scholar]
- Franke A. et al. (2010) Genome-wide meta-analysis increases to 71 the number of confirmed crohns disease susceptibility loci. Nat. Genet., 42, 1118–1125. [DOI] [PMC free article] [PubMed] [Google Scholar]
- Goeman J., Buhlmann P. (2007) Analyzing gene expression data in terms of gene sets: methodological issues. Bioinformatics, 23, 980–987. [DOI] [PubMed] [Google Scholar]
- Gui H. et al. (2011) Comparisons of seven algorithms for pathway analysis using the wtccc crohn’s disease dataset. BMC Res. Notes, 4, 386. [DOI] [PMC free article] [PubMed] [Google Scholar]
- Jostins L. et al. (2012) Host-microbe interactions have shaped the genetic architecture of inflammatory bowel disease. Nature, 491, 119–124. [DOI] [PMC free article] [PubMed] [Google Scholar]
- Kanehisa M. et al. (2010) Kegg for representation and analysis of molecular networks involving diseases and drugs. Nucleic Acids Res., 38, D355–D360. [DOI] [PMC free article] [PubMed] [Google Scholar]
- Li M. et al. (2011) Gates: a rapid and powerful gene-based association test using extended simes procedure. Am. J. Hum. Genet., 88, 283–293. [DOI] [PMC free article] [PubMed] [Google Scholar]
- Li M.X. et al. (2012) Hyst: A hybrid set-based test for genome-wide association studies, with application to protein-protein interaction-based association analysis. Am. J. Hum. Genet., 91, 478–488. [DOI] [PMC free article] [PubMed] [Google Scholar]
- Liu D. et al. (2007) Semiparametric regression of multidimensional genetic pathway data: least-squares kernel machines and linear mixed models. Biometrics, 63, 1079–1088. [DOI] [PMC free article] [PubMed] [Google Scholar]
- Liu J. et al. (2010) A versatile gene-based test for genome-wide association studies. Am. J. Hum. Genet., 91, 478–488. [DOI] [PMC free article] [PubMed] [Google Scholar]
- Pan W. (2009) Asymptotic tests of association with multiple snps in linkage disequilibrium. Genet. Epidemiol., 33, 497–507. [DOI] [PMC free article] [PubMed] [Google Scholar]
- Pan W. (2011) Relationship between genomic distance-based regression and kernel machine regression for multi-marker association testing. Genet. Epidemiol., 35, 211–216. [DOI] [PMC free article] [PubMed] [Google Scholar]
- Pan W. et al. (2014) A powerful and adaptive association test for rare variants. Genetics, 197, 1081–1095. [DOI] [PMC free article] [PubMed] [Google Scholar]
- Pan W. et al. (2015) A powerful pathway-based adaptive test for genetic association with common or rare variants. Am. J. Hum. Genet., 97, 86–98. [DOI] [PMC free article] [PubMed] [Google Scholar]
- Petersen A. et al. (2013) Assessing methods for assigning SNPs to genes in gene-based tests of association using common variants. PLoS One, 8, e62161. [DOI] [PMC free article] [PubMed] [Google Scholar]
- Purcell S. et al. (2007) Plink: a toolset for whole-genome association and population-based linkage analysis. Am. J. Hum. Genet., 81, 559–575. [DOI] [PMC free article] [PubMed] [Google Scholar]
- Schaid D. et al. (2012) Using the gene ontology to scan multilevel gene sets for associations in genome wide association studies. Genet. Epidemiol., 36, 3–16. [DOI] [PMC free article] [PubMed] [Google Scholar]
- Subramanian A. et al. (2005) Gene set enrichment analysis: A knowledge-based approach for interpreting genome-wide expression profiles. PNAS, 102, 15545–15550. [DOI] [PMC free article] [PubMed] [Google Scholar]
- Wang K. et al. (2007) Pathway-based approaches for analysis of genome-wide association studies. Am. J. Hum. Genet., 81, 1278–1283. [DOI] [PMC free article] [PubMed] [Google Scholar]
- Wang K. et al. (2010) Analysing biological pathways in genome-wide association studies. Nat. Rev. Genet., 65, 843–854. [DOI] [PubMed] [Google Scholar]
- Wu M. et al. (2010) Powerful SNP-set analysis for case–control genome-wide association studies. Am. J. Hum. Genet, 86, 929–942. [DOI] [PMC free article] [PubMed] [Google Scholar]
- Zhang K. et al. (2013) i-gsea4gwas: a web server for identification of pathways/gene sets associated with traits by applying an improved gene set enrichment analysis to genome-wide association study. Nucleic Acids Res., 38, W90–W95. [DOI] [PMC free article] [PubMed] [Google Scholar]
Associated Data
This section collects any data citations, data availability statements, or supplementary materials included in this article.


