
Fig. 3.
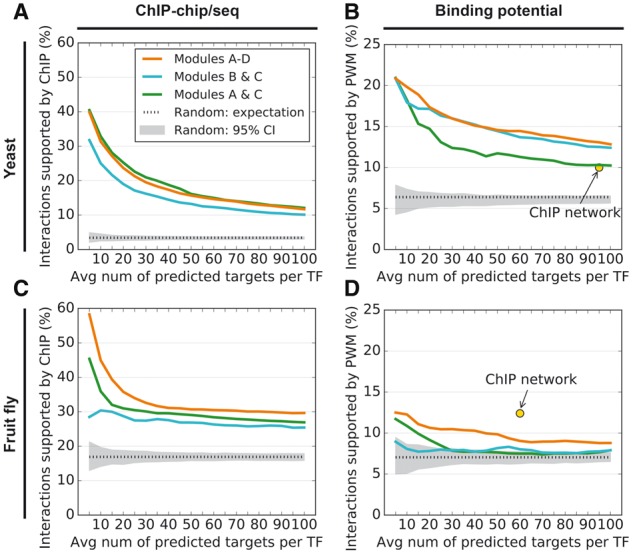
(A) Accuracy of NetProphet 1.0 on yeast after weighted averaging (Modules A & C, green line), BART after weighted averaging (Modules B & C, cyan line) and the combination of the two (Modules A–D, orange line). Horizontal axis: number of top ranked edges included in the network per TF encoded in the genome. Vertical axis: Percentage of included edges that are supported by ChIP data. Dotted line: Expected accuracy of random networks. Gray area: 95% confidence interval for random networks. (B) Same as A for PWM support. The point labeled ‘ChIP network’ indicates the number of ChIP-supported edges and the fraction of those edges that also have PWM support. (C) Same as A for the fly data. (D) Same as B for the fly data, except that the vertical axis shows support by conserved PWM hits only