Figure 3.
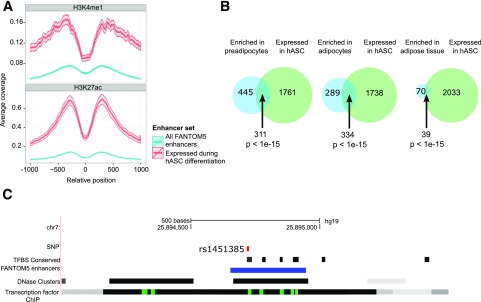
Enhancers. A: Enrichment of H3K4me1 and H3K27ac ChIP-seq reads from an independent study (24) surrounding enhancers expressed in hASCs (red) compared with all enhancers detected in the FANTOM5 project (blue). B: Overlaps between enhancers expressed during hASC adipogenesis time course (green) and enhancers enriched in primary cell types profiled in FANTOM5 (blue). From left to right: PreAds, adipocytes, and adipose tissue. Statistical significance of overlap calculated by Fisher exact test. C: Genomic context of an SNP (rs1451385) associated to waist-to-hip ratio adjusted for BMI, located in an enhancer expressed during hASC differentiation. The SNP is visualized as a red bar and the enhancer as a blue line. Locations of conserved TF binding sites (TFBS), as well as clusters of DNase hypersensitive sites and TF ChIP-seq signal, are also visualized.

