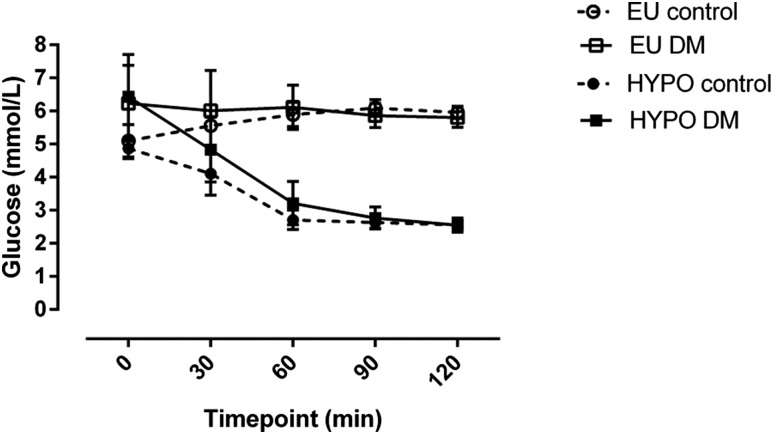
Figure 1.
Arterialized blood glucose during hyperinsulinemic-euglycemic and hypoglycemic clamps. Data are mean (SE). EU control, euglycemic clamp, control participants without diabetes; EU DM, euglycemic clamp, patients with T2DM; HYPO control, hypoglycemic clamp, control participants without diabetes; HYPO DM, hypoglycemic clamp, patients with T2DM.

