Abstract
Beiging of white adipose tissue has potential antiobesity and antidiabetes effects, yet the underlying signaling mechanisms remain to be fully elucidated. Here we show that adipose-specific knockout of Rheb, an upstream activator of mechanistic target of rapamycin complex 1 (mTORC1), protects mice from high-fat diet–induced obesity and insulin resistance. On the one hand, Rheb deficiency in adipose tissue reduced mTORC1 signaling, increased lipolysis, and promoted beiging and energy expenditure. On the other hand, overexpression of Rheb in primary adipocytes significantly inhibited CREB phosphorylation and uncoupling protein 1 (UCP1) expression. Mechanistically, fat-specific knockout of Rheb increased cAMP levels, cAMP-dependent protein kinase (PKA) activity, and UCP1 expression in subcutaneous white adipose tissue. Interestingly, treating primary adipocytes with rapamycin only partially alleviated the suppressing effect of Rheb on UCP1 expression, suggesting the presence of a novel mechanism underlying the inhibitory effect of Rheb on thermogenic gene expression. Consistent with this notion, overexpression of Rheb stabilizes the expression of cAMP-specific phosphodiesterase 4D5 (PDE4D5) in adipocytes, whereas knockout of Rheb greatly reduced cellular levels of PDE4D5 concurrently with increased cAMP levels, PKA activation, and UCP1 expression. Taken together, our findings reveal Rheb as an important negative regulator of beige fat development and thermogenesis. In addition, Rheb is able to suppress the beiging effect through an mTORC1-independent mechanism.
Introduction
Both white (WAT) and brown (BAT) adipose tissues are important regulators of energy homeostasis in animals and humans (1,2). Accumulation of WAT as a result of extra energy storage and defects in thermogenic gene expression in BAT are associated with obesity, type 2 diabetes, and other metabolic diseases (3,4). Recent studies have uncovered a subset of cells in WAT that show a “brown-like” or “beige” phenotype when induced by certain environmental or hormonal factors. This process, known as beiging, has potential antiobesity and antidiabetes effects (5–7). Extensive studies have been performed to explore the molecular mechanisms underlying the function and development of brown and beige fat at the transcriptional level (6,8). However, the upstream signaling pathways that regulate the beiging process remain to be fully elucidated.
The mechanistic target of rapamycin (mTOR) complex 1 (mTORC1) is an energy sensor that integrates various internal and external signals to regulate many cellular processes, including protein synthesis, lipid metabolism, energy expenditure, and autophagy (9,10). mTORC1 is activated by the Ras-like small guanosine 5′-triphosphatase Rheb, which binds directly to the amino-terminal lobe of the mTOR catalytic domain (11). In adipocytes, activation of the mTORC1 signaling pathway suppresses lipolysis, stimulates lipogenesis, and promotes lipid accumulation (12,13). Conversely, inhibition of mTORC1 promotes lipolysis and release of free fatty acids (FFAs), blocks adipogenesis, and impairs fat cell maintenance (14–17). The role of mTORC1 signaling in the regulation of adipocyte function in vivo, however, is less clear. mTORC1 has been suggested to act as a negative regulator of thermogenic gene expression in adipose tissue (16,18,19). However, some recent studies show that activation of mTORC1 is essential for β-adrenergic stimulation of adipose browning (20,21). These findings raise a very interesting question about whether adipose mTORC1 signaling plays distinct roles in the regulation of thermogenesis and energy homeostasis under different conditions.
In response to environmental changes, especially cold exposure, the sympathetic nervous system triggers adaptive thermogenesis in adipose tissue. The increased thermogenic activities are stimulated by β-adrenergic receptors–mediated activation of downstream effectors such as the cAMP-dependent protein kinase A (PKA) and p38 mitogen-activated protein kinase (MAPK) pathways (22). Cellular cAMP levels are regulated by adenyl cyclase and cAMP-specific phosphodiesterases (PDEs) such as PDE4D5, a PDE4 enzyme family member (23). In adipocytes, activated PKA directly phosphorylates the transcription factor CREB, which promotes the expression of key thermogenic genes such as Pgc-1α and Ucp1 (6,24). Given that the PKA signaling pathway is critical for beiging of WAT, we sought to determine whether Rheb-mTORC1 signaling had any effect on PKA activity and thermogenesis in adipose tissue.
Here we show that fat-specific knockout of Rheb, an upstream activator of the mTORC1 signaling pathway, promoted the beiging of WAT, increased energy expenditure, and protected mice from high-fat diet (HFD)–induced insulin resistance. Importantly, we showed that fat-specific knockout of Rheb enhanced cAMP levels and PKA activation by downregulation of PDE4D5 in subcutaneous WAT (sWAT). Rapamycin suppression of the mTORC1 signaling pathway had no effect on cAMP levels in primary white adipocytes, suggesting that Rheb is able to negatively regulate cAMP levels and PKA signaling via an mTORC1-independent mechanism.
Research Design and Methods
Materials and Chemicals
Antibodies against PDE3B, PDE4B, PDE4D, and PDE4D5 were from Abcam. The anti-uncoupling protein 1 (UCP1) antibody was from Sigma-Aldrich. All other antibodies were from Cell Signaling Technologies.
Animals
Fat tissue–specific Rheb knockout mice (RhebfKO) were generated by crossing female Rheb floxed mice (25) with male adiponectin-cre mice (26). The floxed littermates were used as controls. For the HFD-induced obesity experiments, the mice were randomly distributed into weight-matched groups fed a normal chow diet (ND) or an HFD (60 Kcal% fat, Cat #D12492; Research Diets Inc., New Brunswick, NJ). All animals were housed in a temperature-controlled environment with a 12-h light/12-h dark cycle and had access to food and water ad libitum.
For the in vivo insulin signaling study, mice (12 weeks old) were fasted overnight, followed by an intraperitoneal (i.p.) injection of insulin (5 units/kg body weight). Mice were sacrificed 5 min after the insulin injection, and mouse tissues were harvested for further analyses.
For β-adrenergic agonist treatment experiments, mice (12 weeks old) were injected i.p. with 1 mg/kg body weight of the β3-adrenergic receptor agonist CL 316,243 (CL; Sigma-Aldrich). All animal studies were performed under a protocol approved by the Central South University Animal Care and Use Committee.
Body Weight, Body Composition, Histological Analysis, and Immunoblotting
Mouse body weight was measured weekly. Fat mass, lean mass, fluid mass, and percentage of fat were determined using DEXA (GE Medical Systems, Madison, WI). Energy expenditure in mice was determined by metabolic cage studies at 25°C or 30°C to compare energy metabolism at standard room temperature or under thermoneutral conditions, respectively. The average oxygen consumption was normalized to lean body mass (18). Hematoxylin and eosin staining, real-time PCR, insulin, and glucose tolerance experiments were performed according to similar procedures as previously described in our recent study (18).
Measurement of Mitochondrial DNA Content
To determine mitochondrial DNA (mtDNA) content, total cellular DNA was extracted based on the proteinase K–organic solvent isolation method (27). Quantitative (q)PCR was performed using the Applied Biosystems 7900HT Fast Real-Time PCR System with primers targeting to 16s rRNA (mtDNA) or hexokinase 2 (nuclear gene) (28). Relative mtDNA levels were calculated based on the ratio of mtDNA to the nuclear gene hexokinase 2.
cAMP Assay
cAMP levels in tissue or cells were analyzed by using a colorimetric cAMP ELISA kit (Cell Biolabs), according to the manufacturer's instructions.
Cold Stress
Male mice (8 weeks old) were individually housed in cages kept at room temperature (25°C) or cold temperature (4°C) under a 12-h light/12-h dark cycle. Food and water were available ad libitum. In cold temperature (4°C) groups, mice were kept at 4°C for 4 h every day continuously for 4 days unless otherwise indicated. Inguinal sWAT was isolated and analyzed further. For cold tolerance studies, core body temperature was monitored using a telemetry system at various time points at room temperature (25°C) or after the start of cold exposure (4°C). Core body temperature tests were performed as previously described (18).
Lipolysis Measurement
RhebfKO and control mice (8 weeks old; n = 3/group) were fed the ND or HFD for 17 weeks. Inguinal and interscapular brown fat pads (∼40–60 mg) from mice fasted overnight were dissected and incubated in 500 μL KRBB (12 mmol/L HEPES, 121 mmol/L NaCl, 4.9 mmol/L KCl, 1.2 mmol/L MgSO4, and 0.33 mmol/L CaCl2) containing 2% fatty acid–free BSA and 0.1% glucose, with or without 10 μmol/L isoproterenol, at 37°C for 6 h. The incubation buffer was collected and used for FFA and glycerol analysis using the NEFA C Kit (Wako, Osaka, Japan) and Free Glycerol Reagent (Sigma-Aldrich), respectively (18,29,30).
Adipose Stromal Vascular Cell Isolation
Mouse primary stromal vascular fractions were isolated and cultured as previously described (18). Briefly, subcutaneous white fat depots from 4-week-old male C57BL/6 mice were quickly isolated and minced. The tissue pieces were digested by type II collagenase (Sigma-Aldrich). The digested tissue was filtered through a 100-mm nylon screen. Collected cells were centrifuged for 5 min. Cells were resuspended in 2 mL culture medium and seeded on a culture plate. Differentiation of cells was initiated according to previously described methods (31,32).
Coimmunoprecipitation and Western Blot
For Western blot analysis, cultured primary subcutaneous white adipocytes were transfected with plasmids encoding wild-type (WT) Flag-tagged Rheb or RhebC181S, followed by induction of differentiation. Differentiated cells were lysed in radioimmunoprecipitation assay buffer, and Rheb protein was immunoprecipitated using anti-Flag antibody (M20008L; Abmart). Proteins coimmunoprecipitated with Rheb were determined using specific antibodies as indicated.
Oxygen Consumption Rate Analysis
Mitochondrial oxygen consumption rate (OCR) in intact cells was measured using the XF-24 analyzer (Seahorse Bioscience, North Billerica, MA) as described in the manufacturer's instructions. Briefly, primary preadipocytes were seeded into XF-24 microplates and induced to differentiation at 37°C with 5% CO2. Cells were maintained at 37°C in a non-CO2 incubator for at least 1 h before assay. ATP turnover and maximal uncoupled OCRs were determined by treating the cells with oligomycin (1 μmol/L) (Sigma-Aldrich) or carbonyl cyanide 4-(trifluoromethoxy)phenylhydrazone (FCCP; 1 μmol/L) (Sigma-Aldrich), respectively. Rotenone and antimycin A (1 μmol/L each) (Sigma-Aldrich) were used to inhibit complex 1– and complex 3–dependent respiration. OCR was normalized to protein content. Each experimental condition was analyzed using four to six biological replicates (33).
Generation of Lentiviruses Encoding Rheb
Rheb lentiviruses and control viruses were generated by cotransfecting HEK293T cells with pWPI-Rheb or pWPI-control plasmid, respectively, together with packaging plasmid pMD2.G and envelope plasmid pAX2A. After 48 h, supernatant media containing viruses were collected and used to infect primary preadipocytes.
Site-Directed Mutagenesis
The expression vector pWPI is from Addgene. To construct the pWPI-flag-Rheb-WT and pWPI-flag-Rheb-C181S plasmids, the same forward primer was (pWPI-Rheb-F or pWPI-Rheb-C181S-F): 5′-CTAGCCTCGAGGTTTAAACGCCACCATGGATTATAAGGATGACGACGATAAACCTCAGTCCAAGTCCCGGAAGA-3′. The reverse PCR primer for the WT Rheb (pWPI-Rheb-R) was 5′-TGCAGCCCGTAGTTTAAACTCACATCACCGAGCACGAAGACT-3′. For RhebC181S mutant, the reverse primer (pWPI-Rheb-C181S-R) was: 5′-TGCAGCCCGTAGTTTAAACTCACATCACCGAGCTCGAAGACT-3′, in which the codon for cysteine (ACG) is replaced with serine (TCG). Mutagenesis PCRs were performed using the PrimerSTAR Max DNA Polymerase (TAKARA) with WT Rheb cDNA as a template. WT and mutant expression vectors were generated by subcloning the PCR fragments into the pWPI vector using the Quick-Fusion cloning kit (Biotool). Mutations were confirmed by DNA sequencing.
Statistical Analysis
Statistical analysis was performed using SPSS 19.0 software (SPSS Inc., Chicago, IL). Statistical analysis of the data was performed using ANOVA or the Student t test. Data shown are average ± SEM. A P value of ≤0.05 was considered to be statistically significant.
Results
Fat-Specific Knockout of Rheb Protects Mice Against HFD-Induced Obesity and Hepatosteatosis
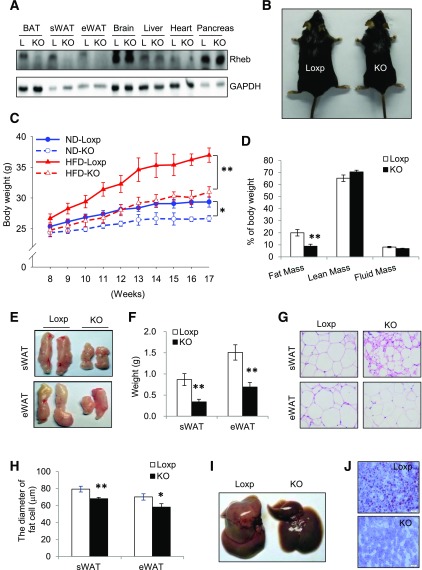
To determine the potential role of mTORC1 signaling in the regulation of adipose biology and function, we generated RhebfKO mice by crossing Rheb floxed mice (25) with adiponectin-cre mice. Rheb expression was suppressed in WAT and BAT of the RhebfKO mice but not in other tissues examined (Fig. 1A). Fat-specific knockout of Rheb had no significant effect on food intake in mice fed the ND or HFD (Supplementary Fig. 1A and B). Under ND feeding, the RhebfKO mice displayed reduced body weight (Fig. 1C), fat mass (Supplementary Fig. 1C), and basal glucose levels (Supplementary Fig. 1D), but showed no significant change in insulin sensitivity and fasting insulin levels when compared with their Loxp control mice (Supplementary Fig. 1E and F). When challenged with the HFD for 9 weeks, the RhebfKO mice were smaller in body size and displayed lower body weight and fat mass compared with the Loxp control littermates (Fig. 1B–D). In agreement with these findings, the size (Fig. 1E) and weight (Fig. 1F) of the white fat pads were significantly reduced in RhebfKO mice compared with Loxp control mice. In addition, white adipocyte cell size was smaller in the RhebfKO mice than in the control littermates (Fig. 1G and H). Fat-specific knockout of Rheb also markedly alleviated diet-induced steatosis in the liver (Fig. 1I and J), which is most likely a secondary effect stemming from the ability of RhebfKO mice to resist the metabolically deleterious effects associated with HFD feeding.
Figure 1.
RhebfKO mice are lean and resistant to HFD-induced obesity. A: Western blot analysis of Rheb expression in 6-week-old RhebfKO (KO) and Loxp (L) control mice. GAPDH was used as a loading control. eWAT, epididymal WAT. B: Representative images of mice after a 9-week HFD feeding regimen starting at 8 weeks of age. C: Body weight of mice (mean ± SEM, n = 6 – 8/group) fed the ND or HFD beginning at 8 weeks of age. D: Body composition of HFD-fed KO (n = 6) and Loxp control littermates (n = 8). E: Representative images of fat pads from HFD-fed mice. F: Weights of sWAT and eWAT of HFD-fed KO (n = 6) and Loxp control (n = 8) mice. G: Representative images of hematoxylin and eosin staining of sWAT and eWAT sections from HFD-fed KO and Loxp control mice. H: The average diameters of fat cells in KO and control mice were analyzed and quantified by the Image-Pro Plus 6.0 software. I: Representative images of liver from HFD-fed mice. J: Representative images of Oil Red O staining of liver sections from HFD-fed KO and Loxp control mice. For D–J, mice were fed the HFD for 17 weeks. Scale bars: 50 μm. Data are mean ± SEM. *P < 0.05; **P < 0.01.
Fat-Specific Knockout of Rheb Stimulates Lipolysis in Mice
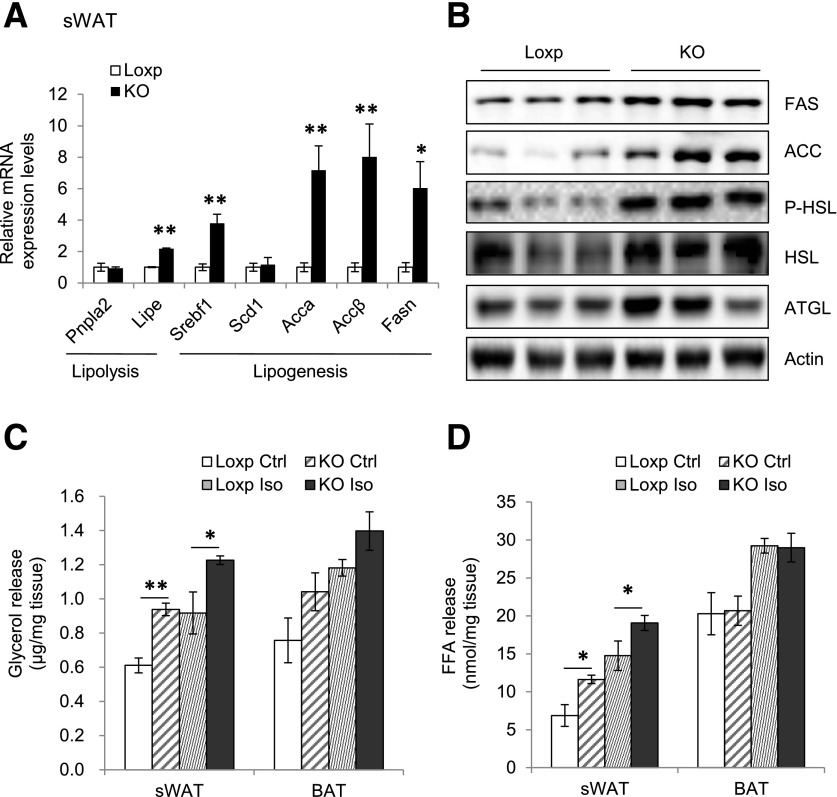
The mRNA and protein levels of hormone-sensitive lipase (HSL) were significantly higher in sWAT of RhebfKO mice compared with WT littermates (Fig. 2A and B). Consistent with increased lipolysis, the basal and β-adrenergic receptor agonist-stimulated release of glycerol and FFA was also significantly increased in sWAT of RhebfKO mice, but was not in BAT (Fig. 2C and D). Interestingly, fat-specific disruption of Rheb expression also increased the mRNA levels of several lipogenic genes, including Srebf1, Accα, Accβ, and Fasn in the sWAT of RhebfKO mice (Fig. 2A), suggesting the possible presence of a fat-futile cycle in lipid production and utilization in RhebfKO mice.
Figure 2.
Fat-specific knockout of Rheb promotes lipolysis in mice. A: The mRNA levels of lipolytic and lipogenic genes in sWAT of RhebfKO (KO) and control mice (4 months old; n = 6/group) were determined by quantitative real-time PCR. B: Western blot analyses of FAS, ACC, P-HSL, HSL, and ATGL protein levels in sWAT of RhebfKO and control mice. P, phosphorylated. Glycerol release (C) and FFA release (D) from primary subcutaneous white adipocytes isolated from RhebfKO and control (Ctrl) mice (n = 3/group) treated with or without 10 μmol/L isoproterenol (Iso) for 6 h at 37°C. Data are mean ± SEM. *P < 0.05; **P < 0.01.
Fat-Specific Knockout of Rheb Protects Mice From HFD-Induced Insulin Resistance
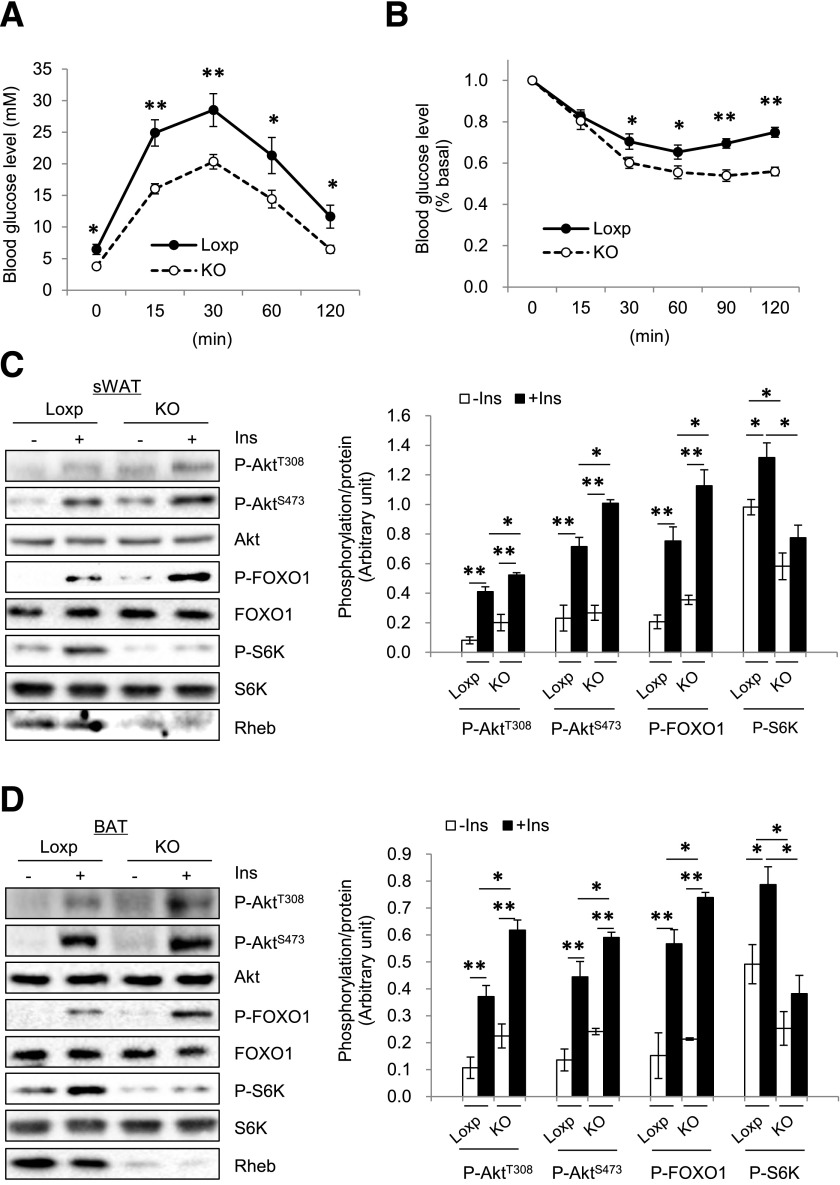
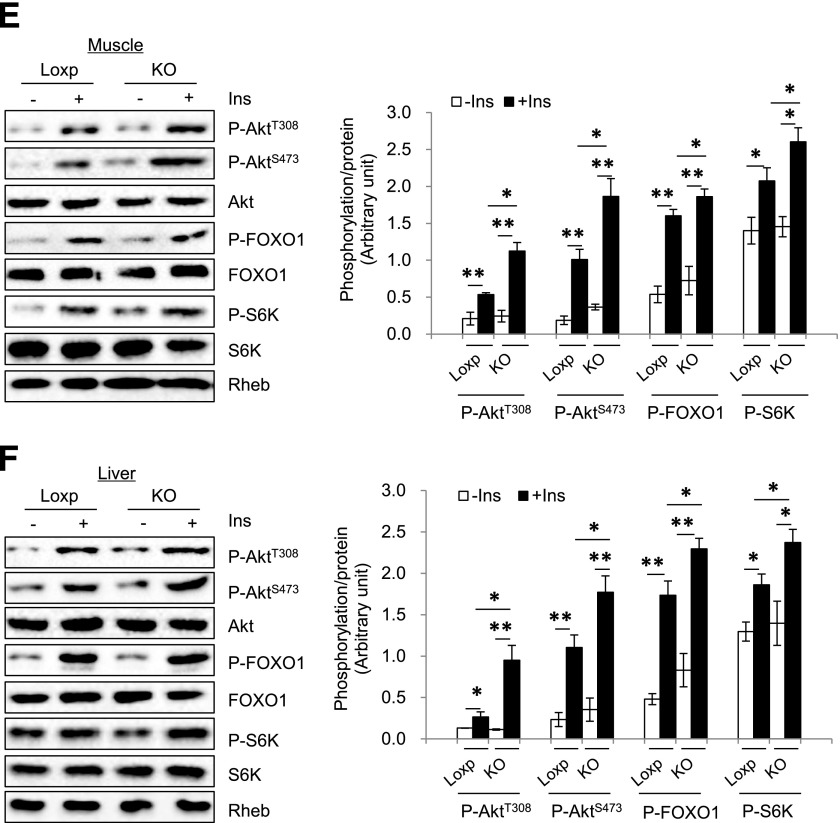
Under the HFD, RhebfKO mice showed improved glucose tolerance and insulin sensitivity compared with control mice (Fig. 3A and B). In addition, insulin-stimulated phosphorylation of Akt (both Thr308 and Ser473) and FOXO1 were higher in sWAT (Fig. 3C) and BAT (Fig. 3D) of the RhebfKO mice compared with control littermates. Insulin-stimulated Akt and FOXO1 phosphorylation was also markedly increased in muscle and liver of the RhebfKO mice compared with control littermates (Fig. 3E and F), which is probably from an indirect effect resulting from the reduced obesity in the RhebfKO mice. Consistent with this notion, although fat-specific knockout of Rheb reduced S6K phosphorylation in sWAT and BAT (Fig. 3C and D), no difference was observed in muscle and liver between RhebfKO mice and control littermates (Fig. 3E and F).
Figure 3.
Fat-specific Rheb ablation potentiates insulin signaling. RhebfKO (KO) and Loxp control mice (8 weeks old) were fed the HFD for 17 weeks. Glucose tolerance tests (A) and insulin tolerance tests (B) were performed in RhebfKO (n = 6) and Loxp control mice (n = 8). Insulin signaling in sWAT (C), BAT (D), muscle (E), and liver (F) of RhebfKO and control mice was examined by Western blot. Ins, insulin; P, phosphorylated. *P < 0.05; **P < 0.01.
Fat-Specific Knockout of Rheb Increases Energy Expenditure and Enhances Mitochondrial Respiratory Chain Activity in Mice
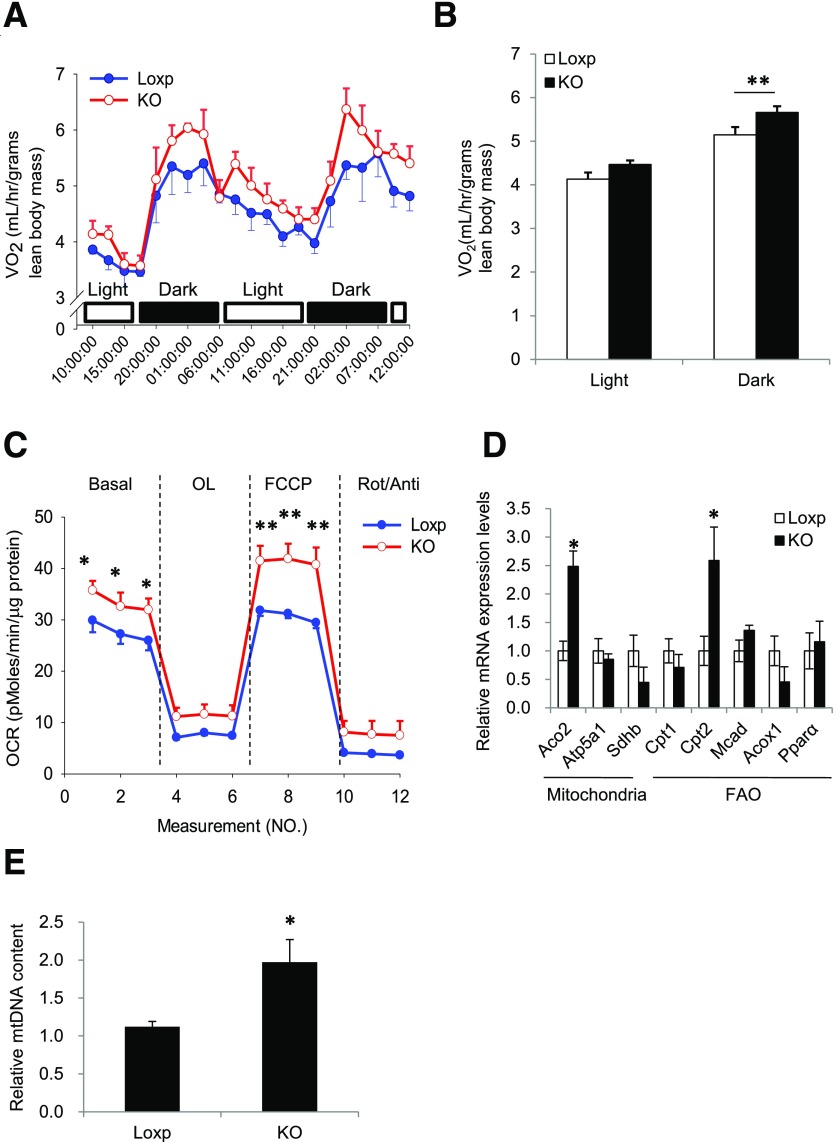
Because fat-specific Rheb knockout did not affect food intake (Supplementary Fig. 1A and physical activity (data not shown), we investigated whether energy expenditure was increased in the RhebfKO mice. Although energy expenditure was similar between RhebfKO mice and control mice at thermoneutrality (30°C) (Supplementary Fig. 2A and B), RhebfKO mice had higher OCRs in the dark compared with control littermates at room temperature (Fig. 4A and B). These findings suggest that the difference in OCRs observed at room temperature is not an inherent property of the cellular system/perturbation but a response to the environmental temperature. Given the RhebfKO mice are smaller than the WT control mice, these findings suggest a possibility that a difference in body surface area may contribute to the observed difference in energy expenditure. Increased OCR was also observed in 9-week HFD-treated RhebfKO mice compared with the Loxp controls (Supplementary Fig. 2C and D). In response to oligomycin treatment, the reduction rate of the OCR (slope) showed no difference between the Loxp and knockout groups, indicating that Rheb deficiency might have no significant effect on uncoupled respiration (ATP production). However, the total respiration and FCCP-induced uncoupled respiration were significantly higher in primary adipocytes derived from sWAT of the RhebfKO mice compared with control mice (Fig. 4C), demonstrating that the Rheb deficiency might increase mitochondrial electron transport capacity. In agreement with these findings, knockout of Rheb increased the expression of genes involved in mitochondrial biogenesis and fatty acid oxidation, including the nuclear encoded tricarboxylic acid cycle gene, Aco2 (encoding aconitase 2), and the essential fatty acid oxidation gene, Cpt2 (encoding carnitine palmitoyltransferase 2), in sWAT of mice fed the HFD (Fig. 4D and Supplementary Fig. 2E). In addition, mtDNA content was increased in sWAT of the RhebfKO mice compared with control mice (Fig. 4E). However, fat-specific knockout of Rheb had no significant effect on mitochondrial biogenesis and fatty acid oxidation gene expression in the BAT of mice fed the ND (Supplementary Fig. 2F).
Figure 4.
RhebfKO mice have higher energy expenditure and enhanced mitochondrial respiration. A: VO2 of RhebfKO (KO) and control (Loxp) mice (4 months old; n = 6/group) was measured by indirect calorimetry using the Comprehensive Lab Animal Monitoring System. B: Mean VO2 was normalized to lean body mass and analyzed by t test. C: OCR of primary white adipocytes of KO and Loxp control mice. VO2 consumption was normalized to protein content. OL, oligomycin; Rot, rotenone; Anti, antimycin. D: Quantitative real-time PCR analyses of mRNA levels of genes involved in mitochondrial and fatty acid metabolism in sWAT of 4-month-old KO and Loxp control littermates (n = 6/group) fed the ND. FAO, fatty acid oxidation. Data were normalized to β-actin and expressed as mean ± SEM. *P < 0.05; **P < 0.01 vs. control. E: The relative mtDNA content in sWAT of 4-month-old KO and Loxp control littermates (n = 6/group) fed the ND. Data were mean ± SEM. *P < 0.05.
Fat-Specific Knockout of Rheb Promotes Thermogenic Gene Expression and Beige Fat Development in Mice
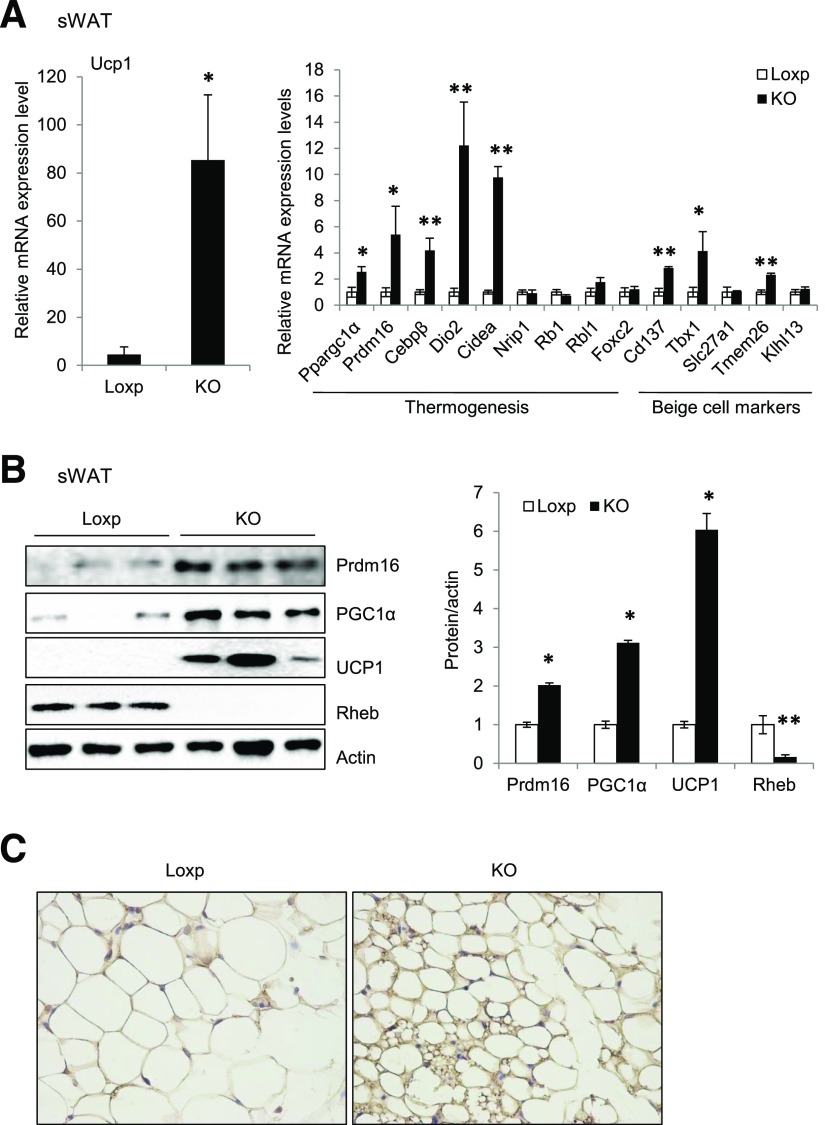
We performed whole-genome microarray assays to identify genes differentially expressed in the sWAT of RhebfKO mice versus control littermates. The microarray study showed that the mRNA levels of a number of thermogenic genes, including Ucp1, Ppargc1α, Prdm16, Dio2, Cidea, and Elovl3, were all higher in the sWAT of RhebfKO mice than in control littermates (Supplementary Fig. 3A). Real-time PCR experiments confirmed the increased expression of a subset of thermogenic genes (Ucp1, Ppargc1α, Prdm16, Cebpβ, Dio2, and Cidea) and beige cell markers (Cd137, Tbx1, and Tmem26) (6) (Fig. 5A). Consistent with the mRNA data, protein levels of UCP1, peroxisome proliferator–activated receptor-γ coactivator 1α (PGC1α), and Prdm16 were all significantly increased in sWAT of RhebfKO mice fed the ND (Fig. 5B). Increased expression of thermogenic and beige cell marker genes was also observed in sWAT of RhebfKO mice compared with controls fed the HFD (Supplementary Fig. 3B and C). Furthermore, immunohistochemistry analysis showed that UCP1 was induced in sWAT of RhebfKO mice fed the ND (Fig. 5C).
Figure 5.
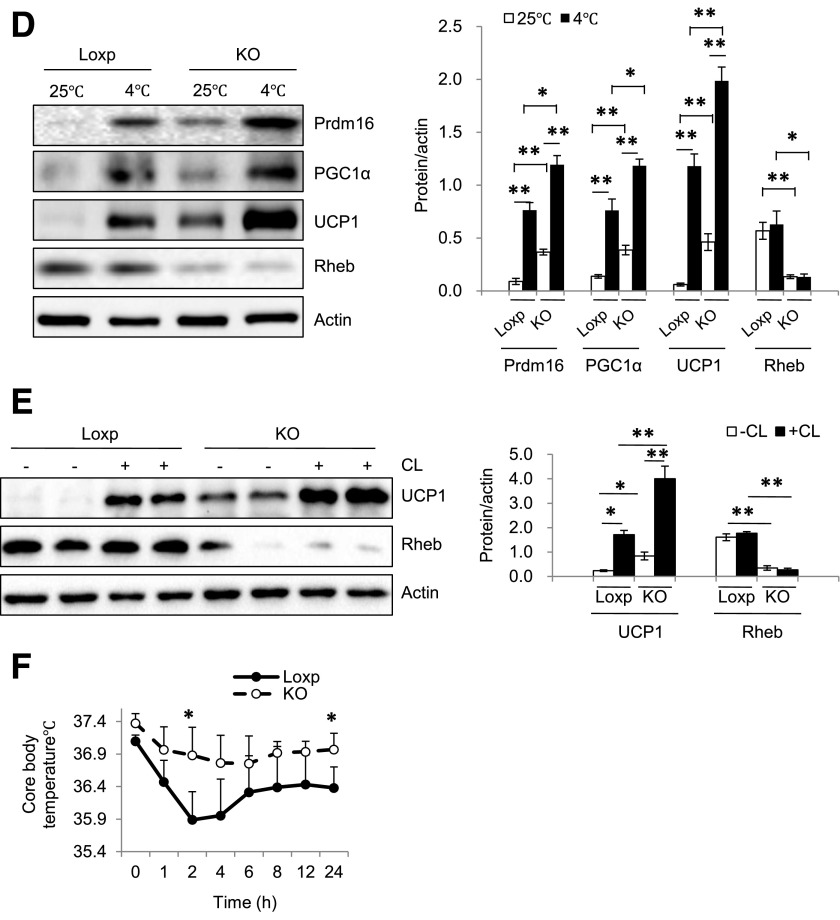
Adipose tissue Rheb ablation promotes thermogenic gene expression in WAT and increases cold tolerance. A: mRNA levels of thermogenic and beige marker genes in sWAT of RhebfKO (KO) and Loxp control mice (4 months old; n = 6/group) were quantified by quantitative real-time PCR and normalized to β-actin. B: Western blot analyses of thermogenic proteins in sWAT. C: Immunohistochemical staining of UCP1 in sWAT of KO and Loxp control mice fed the ND (original magnification ×400). D: Cold exposure–induced thermogenic protein expression in sWAT of KO and Loxp control mice (n = 3). E: UCP1 protein expression in sWAT of KO and Loxp control mice treated with CL i.p. for 24 h. F: Body temperature of 12-week-old KO and Loxp control mice exposed to cold (4°C) on the ND feeding condition (n = 4). Data are mean ± SEM. *P < 0.05, **P < 0.01 vs. control.
To determine whether disrupting Rheb signaling affects cold-induced thermogenic gene expression, we exposed RhebfKO and their floxed control mice to 4°C for 4 h/day for 4 days. At room temperature (25°C), the RhebfKO mice showed higher expression levels of UCP1, PGC1α, and Prdm16 in sWAT than the Loxp control mice (Fig. 5D). Cold exposure further enhanced the expression of these thermogenic proteins (Fig. 5D), suggesting that inhibition of Rheb signaling has a synergistic effect on cold exposure–induced thermogenesis. Consistent with this result, CL stimulation of β-adrenergic signaling enhanced UCP1 expression in sWAT of RhebfKO mice (Fig. 5E), indicating that Rheb deficiency promotes the induction of thermogenic gene expression and recruitment of beige adipocytes in WAT in response to pharmacological (β3-adrenergic receptor agonist) or physiological (cold exposure) stimuli of thermogenesis. The core body temperature was also higher in RhebfKO mice than in the floxed control mice exposed to cold (Fig. 5F). No significant difference in core body temperature was observed between these mice housed at room temperature (Supplementary Fig. 3D). Taken together, our model shows that fat-specific disruption of Rheb can promote thermogenesis in sWAT, thereby creating conditions favorable for the beiging process to occur.
Rheb Deficiency Promotes UCP1 Expression via Activation of the PKA Pathway in White Adipocytes
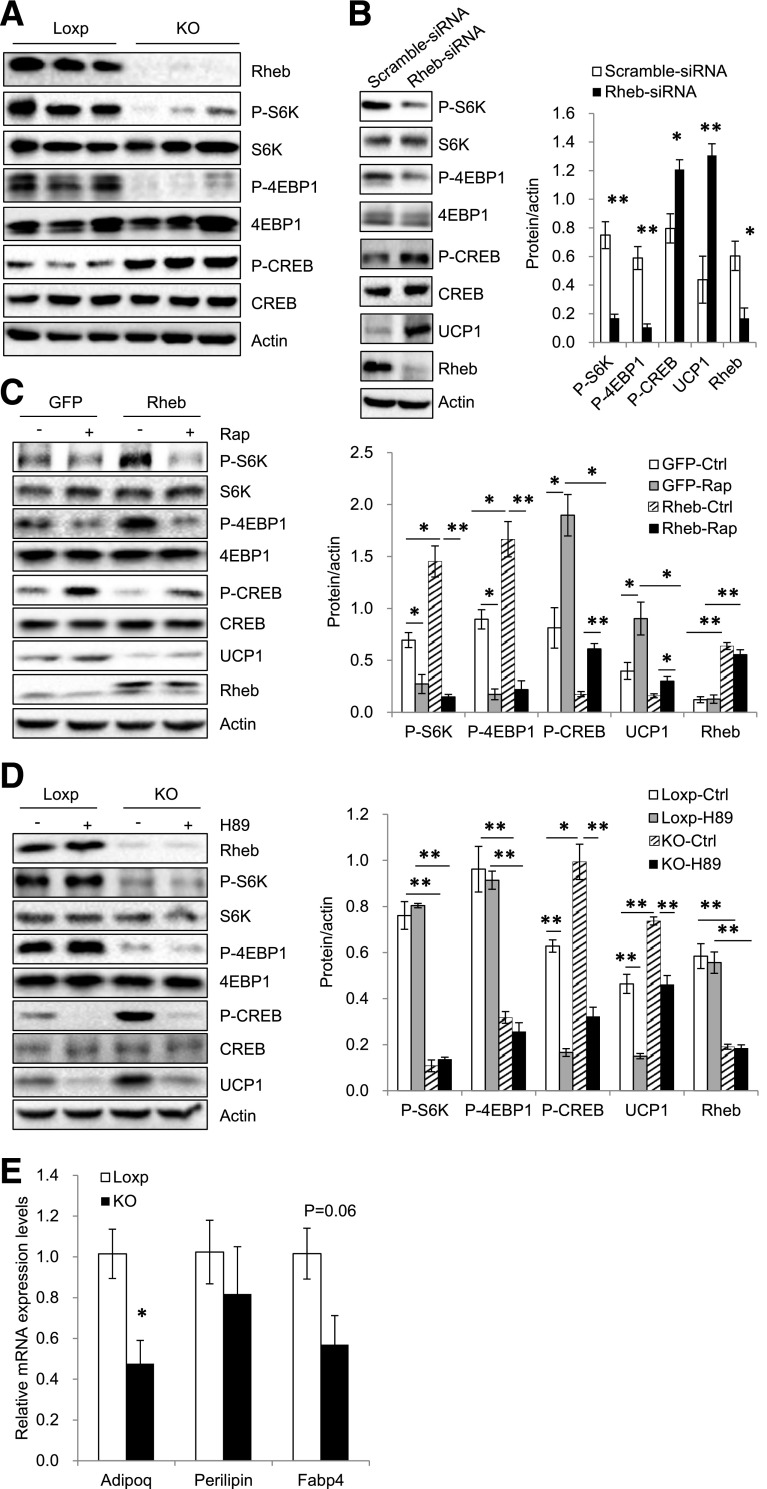
PKA activation is critical for UCP1 expression in both beige and brown fat (6). To determine whether Rheb deficiency affects PKA signaling, we measured the phosphorylation of PKA substrates and CREB in the sWAT of RhebfKO and control mice fed the ND. Fat-specific knockout of Rheb greatly increased the phosphorylation of PKA substrates (Supplementary Fig. 4A) and CREB at Ser133 (Fig. 6A), a direct PKA-mediated phosphorylation site (34). Suppressing Rheb expression also greatly enhanced CREB phosphorylation and UCP1 expression in sWAT-derived primary adipocytes (Fig. 6B), demonstrating that Rheb deficiency exerts a cell-autonomous effect on PKA signaling. In contrast, overexpression of Rheb greatly inhibited CREB phosphorylation and UCP1 expression (Fig. 6C). However, although rapamycin treatment had a stimulatory effect on UCP1 expression in control cells, it only partially rescued the inhibitory effects of Rheb on CREB phosphorylation and UCP1 expression (Fig. 6C), suggesting that Rheb is able to regulate PKA activity and UCP1 expression via mTORC1-independent mechanisms.
Figure 6.
Rheb deficiency promotes UCP1 expression via activation of the PKA pathway in white adipocytes. A: Phosphorylation (P) and protein levels of S6K, 4EBP1, and CREB in sWAT of RhebfKO (KO) and Loxp control mice after 17 weeks of ND. B: Primary adipocytes isolated from sWAT of C57BL/6 mice (4-week-old) were treated with Rheb-specific small interfering RNA (siRNA) or control siRNA for 24 h, followed by induction of differentiation at 37°C for 6 days. Phosphorylation and protein levels of S6K, 4EBP1, and CREB were analyzed by Western blotting using phosphorylated- and protein-specific antibodies. C: Primary subcutaneous white adipocytes were infected with lentivirus encoding green fluorescent protein (GFP) or both GFP and Rheb, followed by induction of differentiation. Cells were treated with or without rapamycin (Rap) (20 nmol/L) for 24 h and analyzed for protein expression using the indicated antibodies. Data are representative of three independent experiments, each with a similar result. D: Subcutaneous white preadipocytes of KO and Loxp control mice (4 weeks old) were isolated and induced to differentiation. Cells were treated with or without H89 (10 nmol/L) for 24 h and expressions of the indicated proteins were analyzed by Western blot. Data are representative of three independent experiments, each with a similar result. *P < 0.05; **P < 0.01. E: mRNA levels of adiponectin (Adipoq), FABP4, and perilipin in primary adipocytes isolated from fat-specific RhebfKO mice and their control littermates were quantified by quantitative real-time PCR and normalized with actin. Data are mean ± SEM. *P < 0.05.
To further elucidate the mechanism by which Rheb deficiency promotes UCP1 expression, we treated primary white adipocytes isolated from RhebfKO mice with the PKA inhibitor H89. H89 treatment greatly inhibited CREB phosphorylation and UCP1 expression in sWAT cells derived from RhebfKO mice (Fig. 6D), suggesting that activation of the PKA signaling pathway plays an important role in Rheb deficiency–induced UCP1 expression. However, UCP1 expression was not significantly different in BAT between RhebfKO and control mice (Supplementary Fig. 4B), indicating that the increased energy expenditure in the RhebfKO mice is most likely a result of increased thermogenic activity in the beige fat. To determine whether Rheb deficiency affects adipocyte differentiation, we examined several adipocyte differentiation markers, such as adiponectin, FABP4, and perilipin, in primary adipocytes isolated from fat-specific RhebfKO mice and their control littermates (Fig. 6E). We found that although the mRNA level of adiponectin was decreased in RhebfKO mice, fat-specific knockout of Rheb had no significant effects on the levels of FABP4 and perilipin (Fig. 6E), indicating that Rheb deficiency had no major effect on adipogenesis.
Rheb Deficiency Downregulates PDE4D5 and Increases cAMP Levels via an mTORC1-Independent Mechanism
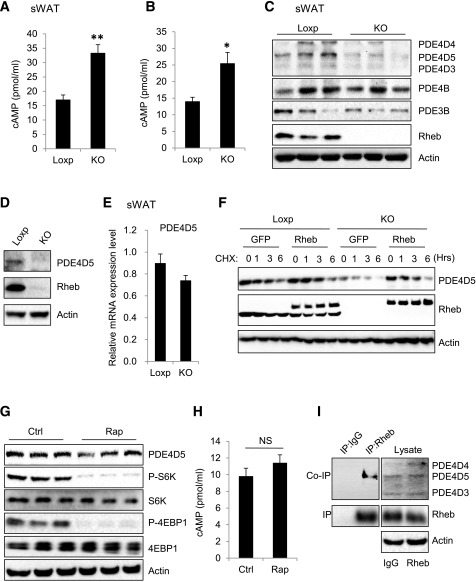
Fat-specific knockout of Rheb significantly increased cAMP levels in mouse sWAT (Fig. 7A) and in primary adipocytes (Fig. 7B). Several cAMP-selective cyclic nucleotide PDEs, including PDE4B, PDE3B, and PDE4D isoforms, have been shown to regulate cAMP levels in adipocytes (35). On the one hand, fat-specific knockout of Rheb had no significant effect on the mRNA (data not shown) and protein (Fig. 7C) levels of PDE4B and PDE3B. On the other hand, the protein (Fig. 7C and D) but not the mRNA (Fig. 7E) levels of PDE4D5 were markedly decreased in sWAT or primary white adipocytes isolated from sWAT of RhebfKO mice compared with those from the floxed control mice. Cycloheximide (CHX) treatment decreased PDE4D5 levels in primary white adipocytes in a dose-dependent manner, and the suppressing effect of CHX was greatly enhanced in primary white adipocytes isolated from RhebfKO mice (Fig. 7F). However, the inhibitory effect of CHX on PDE4D5 levels was greatly rescued by overexpressing Rheb back into the knockout cells (Fig. 7F), indicating that Rheb can maintain cellular PDE4D5 levels by promoting its stability. Interestingly, rapamycin treatment had no significant effects on PDE4D5 protein levels (Fig. 7G) or intracellular cAMP levels (Fig. 7H), suggesting that Rheb is able to regulate PDE4D5 stability and, consequently, cAMP levels via an mTORC1-independent mechanism.
Figure 7.
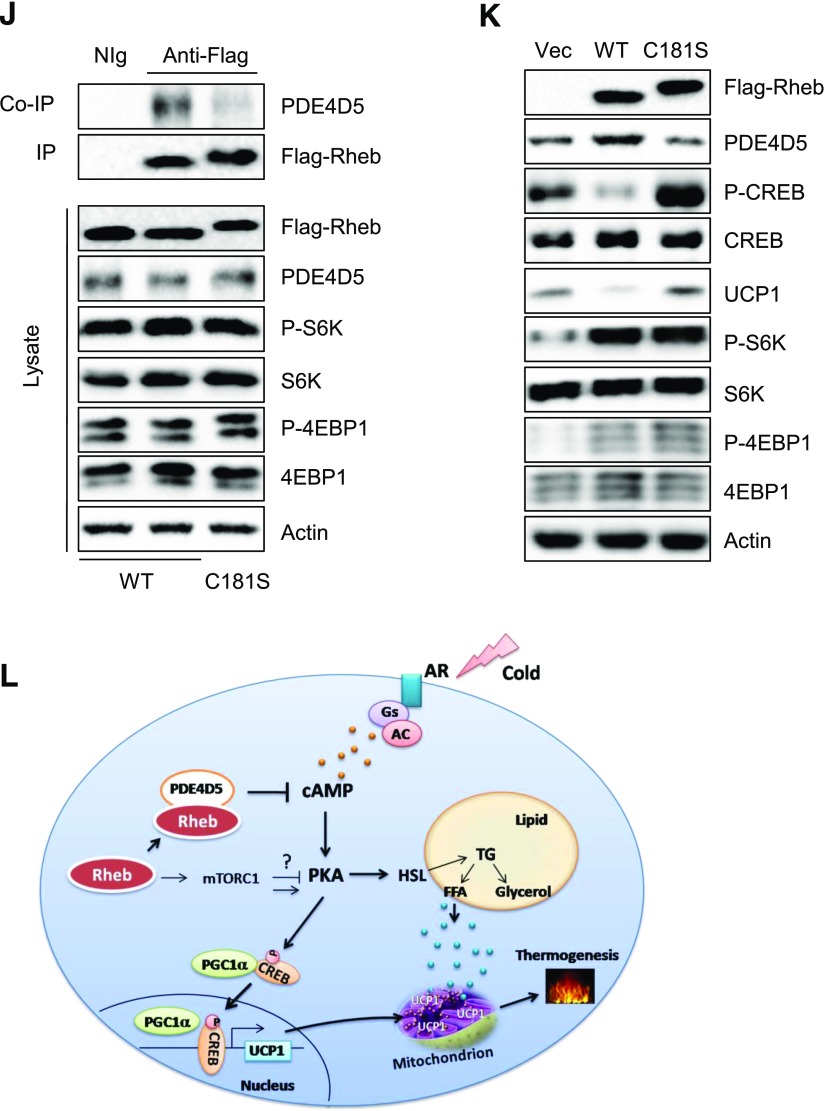
Rheb deficiency downregulates PDE4D5 and increases cAMP levels via an mTORC1-independent mechanism. A: cAMP levels in sWAT of RhebfKO (KO) and Loxp mice (n = 3/group). B: cAMP levels in the primary subcutaneous white adipocytes isolated from KO and Loxp mice. Data are mean ± SEM. *P < 0.05; **P < 0.01. C: Protein levels of PDE4D5, PDE4D4, PDE4D3, PDE4B, and PDE3B in sWAT of KO and Loxp mice. D: Protein levels of PDE4D5 in primary adipocytes from sWAT of KO and Loxp mice. E: mRNA level of PDE4D5 in sWAT of KO and Loxp control mice (4 months old; n = 4/group) were quantified by quantitative real-time PCR and normalized to β-actin. F: Subcutaneous white preadipocytes of KO and Loxp mice were infected with lentivirus encoding PDE4D5, followed by injection with lentivirus encoding green fluorescent protein (GFP) or both GFP and Rheb. Cells were treated with CHX (10 μg/mL) at the indicated times and analyzed for PDE4D5 protein expression at various times (hours) as shown. Data are representative of three independent experiments, each with a similar result. Protein levels of PDE4D5 (G) and cAMP levels (H) in primary subcutaneous white adipocytes were treated with or without rapamycin (Rap) (20 nmol/L) for 24 h. NS, not significant. I: The immunoprecipitation (IP) of Rheb and coimmunoprecipitation (co-IP) of PDE4D5 in primary subcutaneous white adipocytes. J: The IP of Flag-Rheb and co-IP of PDE4D5 in primary subcutaneous white adipocytes expressing WT Flag-tagged Rheb (WT) and Rheb mutant (C181S). K: Protein levels of PDE4D5, phosphorylated (P)-CREB, P-S6K, P-4EBP1, and UCP1 in primary subcutaneous white adipocytes isolated from RhebfKO mice expressing WT Flag-tagged Rheb (WT) and Rheb (C181S). L: A proposed model of the mechanism by which Rheb regulates thermogenesis in white adipocytes. AC, adenylyl cyclase; AR, adrenergic receptor; Gs, the Gs family alpha-subunit of G-protein; TG, triglyceride.
PDE4D5 has been found to selectively interact with Rheb in HEK293 cells (35–37). We confirmed the interaction of these two proteins in primary white adipocytes by coimmunoprecipitation experiments (Fig. 7I). To investigate the role of the Rheb-PDE4D5 interaction in regulating thermogenesis in adipocytes, we generated flag-tagged WT and the C181S mutant of Rheb (RhebC181S) by site-directed mutagenesis. RhebC181S protein expressed in primary white adipocytes migrated at a slower rate on SDS-PAGE compared with WT (Fig. 7J), probably as a result of impaired isoprenylation (38,39). Coimmunoprecipitation experiments showed that WT Rheb but not RhebC181S interacted with PDE4D5 in primary white adipocytes (Fig. 7J). Given that cysteine 181 is critical for Rheb farnesylation (40), we asked whether the Rheb-PDE4D5 interaction is dependent on Rheb farnesylation. Treating primary adipocytes with the farnesyl transferase inhibitor FTI-276 greatly inhibited the interaction between Rheb and PDE4D5 (Supplementary Fig. 5A), confirming a critical role of RhebCys181 farnesylation in regulating its binding to PDE4D5. Overexpression of WT but not the RhebC181S mutant in RhebfKO-derived primary white adipocytes notably increased the cellular levels of PDE4D5 concurrently with reduced CREB phosphorylation and UCP1 levels in primary white adipocytes (Fig. 7K). Taken together, these results demonstrated that interaction of PDE4D5 with Rheb helps to promote its stability, which may be regulated by farnesylation, thereby reducing thermogenic signaling and beiging of WAT.
Discussion
In the current study, we show that fat-specific knockout of Rheb leads to decreased adiposity in the RhebfKO mice, demonstrating an important role of Rheb in the regulation of lipid metabolism. Rheb deficiency in adipose tissue increased the mRNA and protein levels of HSL in sWAT of mice (Fig. 2A and B), suggesting that the reduced adiposity in the RhebfKO mice could be a result of increased lipolysis. Consistent with this, the basal and β-adrenergic receptor agonist–stimulated glycerol and FFA release were all significantly increased in adipocytes isolated from sWAT of RhebfKO mice compared with control mice (Fig. 2C and D). However, fat-specific ablation of Rheb also increased mRNA levels of several lipogenic genes, including Srebf1, Accα, Accβ, and Fasn in sWAT of the RhebfKO mice (Fig. 2A), which may be a result of increased insulin signaling in adipose tissue of the RhebfKO mice (Fig. 3C). Nevertheless, given that the RhebfKO mice are leaner than the control mice, it is more likely that increased lipolysis, rather than reduced lipogenesis, plays a major role in reducing adiposity in the RhebfKO mice. Rheb deficiency in BAT had no significant effect on lipolysis in BAT (Fig. 2C and D), suggesting that Rheb has a selective effect on lipid metabolism in mouse WAT and BAT. Interestingly, there seems to be a signature of increased lipogenesis in the RhebfKO mice compared with the floxed control mice, suggesting the presence of a possible futile cycle through a combination of lipolysis, lipogenesis, and some of this energy also being consumed by oxidation.
Adipose mTORC1 signaling has been well established as a key regulator of lipid metabolism, but there are some controversies on the role of mTORC1 in the regulation of thermogenesis. Inhibition of mTORC1 signaling has been shown to synergize the stimulatory effect of the β-adrenergic–cAMP/PKA pathway on HSL phosphorylation and lipolysis (17). In addition, fat-specific knockout (with aP2-Cre) of raptor enhances UCP1 expression and energy expenditure (16). These results suggest that the mTORC1 signaling pathway is a negative regulator of PKA signaling and thermogenesis. Consistent with this notion, fat-specific knockout of Grb10, a negative regulator of the mTORC1 signaling pathway, increases mTORC1 signaling and reduces energy expenditure in mice (18). However, two recent studies show that inhibition of mTORC1 by rapamycin treatment or by fat-specific knockout of raptor blocks the ability of β-adrenergic signaling to induce beige adipocytes and the browning of WAT, suggesting that activation of mTORC1 is essential for β-adrenergic–stimulated adipose browning (20,21). Similarly, we found that cold exposure for 6 and 24 h (Supplementary Fig. 3F) or 4 days (Supplementary Fig. 3E) greatly induced S6 and S6K phosphorylation in mouse adipose tissue. In addition, cold exposure–induced phosphorylation of S6 and S6K was markedly suppressed in RhebfKO mice, indicating that Rheb plays a key role in cold exposure–induced activation of the mTORC1-signaling pathway. However, exposing the mice to cold for 7 days greatly increased PKA activity and UCP1 expression but not S6, S6K, and 4EBP1 phosphorylation (Supplementary Fig. 3F). These findings reflect a complex regulatory paradigm by which the mTORC1 and β-adrenergic signaling pathways work to regulate thermogenesis in vivo. In the current study, we found that fat-specific knockout of Rheb suppresses mTORC1 signaling and increases thermogenic gene expression. However, the inhibitory effect of Rheb on UCP1 expression was only partially suppressed by rapamycin (Fig. 6C), suggesting that Rheb is able to regulate UCP1 expression via an mTORC1-independent mechanism.
How does Rheb regulate PKA activity and UCP1 expression via an mTORC1-independent mechanism? Rheb has been found to regulate B-Raf and Notch signaling (41,42). However, no significant difference in B-Raf and Notch signaling was observed in sWAT of Rheb1fKO mice compared with control mice (data not shown). p38 MAPK is an important downstream target of the β-adrenergic–cAMP/PKA signaling pathway in adipocytes, and activation of this kinase has been shown to stimulate UCP1 gene expression in brown adipocytes (34,43). On the one hand, we detected no significant difference in the protein levels or phosphorylation of p38 MAPK between sWAT of RhebfKO mice and the Loxp mice (data not shown), suggesting that activation of p38 MAPK is unlikely the mechanism underlying Rheb deficiency–induced UCP1 expression. On the other hand, Rheb deficiency greatly reduces the cellular protein levels of PDE4D5 (Fig. 7C and D), suggesting that Rheb may suppress cAMP levels by stabilizing PDE4D5. We found that WT but not the C181S mutant of Rheb interacted with PDE4D5, suggesting that the interaction, which may be regulated by Rheb farnesylation at Cys181, plays a key role in protecting PDE4D5 degradation. Taken together with the observation that overexpression of Rheb increased PDE4D5 in adipocytes (Fig. 7F), these findings suggest that Rheb may downregulate cAMP levels by stabilizing PDE4D5. However, we cannot completely exclude the possibility that Rheb may inhibit UCP1 expression and thermogenesis through additional unidentified mechanisms. Further investigations will be needed to clarify this possibility.
In conclusion, we demonstrate that fat-specific disruption of Rheb expression promotes thermogenic gene expression in sWAT, thereby revealing a key role for Rheb in the regulation of beige fat development and thermogenesis. We further identify that Rheb deficiency upregulates UCP1 expression via mTORC1-dependent and -independent mechanisms in white adipocytes. Lastly, we uncover a novel mechanism by which Rheb regulates cAMP levels and PKA activity via the stabilization of PDE4D5. Identification of key regulators of the beiging process and better understanding of the mechanisms regulating energy expenditure may guide the development of new pharmacological tools to more efficiently treat obesity and obesity-induced metabolic diseases, especially type 2 diabetes.
Supplementary Material
Article Information
Funding. This work was supported by grants from the National Nature Science Foundation of China (31471131) and the International Science & Technology Cooperation Program of China (2014DFG32490) to F.H. and by grants from the National Basic Research Program of China (2014CB910501) and the National Institutes of Health (R01-DK-100697) to F.L.
Duality of Interest. No potential conflicts of interest relevant to this article were reported.
Author Contributions. W.M. collected and assembled data and prepared the first draft of the manuscript. X.L., H.C., H.L., J.B., G.L., Q.Z., T.X., S.H., Y.Z., Z.X., and M.L. collected data. B.X. provided Rheb floxed mice and contributed to discussion. F.H. supervised students and contributed to data analysis and discussion. F.L. contributed to conceptualization and design, data analysis and interpretation, and manuscript writing; contributed financial support; and gave final approval of the manuscript. All authors reviewed and approved the manuscript. F.L. is the guarantor of this work and, as such, had full access to all the data in the study and takes responsibility for the integrity of the data and the accuracy of the data.
Footnotes
This article contains Supplementary Data online at http://diabetes.diabetesjournals.org/lookup/suppl/doi:10.2337/db16-0886/-/DC1.
References
- 1.Gesta S, Tseng YH, Kahn CR. Developmental origin of fat: tracking obesity to its source. Cell 2007;131:242–256 [DOI] [PubMed] [Google Scholar]
- 2.Rosen ED, Spiegelman BM. What we talk about when we talk about fat. Cell 2014;156:20–44 [DOI] [PMC free article] [PubMed] [Google Scholar]
- 3.Boström P, Wu J, Jedrychowski MP, et al. A PGC1-α-dependent myokine that drives brown-fat-like development of white fat and thermogenesis. Nature 2012;481:463–468 [DOI] [PMC free article] [PubMed] [Google Scholar]
- 4.Cinti S. The adipose organ at a glance. Dis Model Mech 2012;5:588–594 [DOI] [PMC free article] [PubMed] [Google Scholar]
- 5.Cinti S. Reversible physiological transdifferentiation in the adipose organ. Proc Nutr Soc 2009;68:340–349 [DOI] [PubMed] [Google Scholar]
- 6.Harms M, Seale P. Brown and beige fat: development, function and therapeutic potential. Nat Med 2013;19:1252–1263 [DOI] [PubMed] [Google Scholar]
- 7.Nedergaard J, Cannon B. The browning of white adipose tissue: some burning issues. Cell Metab 2014;20:396–407 [DOI] [PubMed] [Google Scholar]
- 8.Lo KA, Sun L. Turning WAT into BAT: a review on regulators controlling the browning of white adipocytes. Biosci Rep 2013;33:33. [DOI] [PMC free article] [PubMed] [Google Scholar]
- 9.Wullschleger S, Loewith R, Hall MN. TOR signaling in growth and metabolism. Cell 2006;124:471–484 [DOI] [PubMed] [Google Scholar]
- 10.Laplante M, Sabatini DM. mTOR signaling in growth control and disease. Cell 2012;149:274–293 [DOI] [PMC free article] [PubMed] [Google Scholar]
- 11.Long X, Lin Y, Ortiz-Vega S, Yonezawa K, Avruch J. Rheb binds and regulates the mTOR kinase. Curr Biol 2005;15:702–713 [DOI] [PubMed] [Google Scholar]
- 12.Zhang HH, Huang J, Düvel K, et al. Insulin stimulates adipogenesis through the Akt-TSC2-mTORC1 pathway. PLoS One 2009;4:e6189. [DOI] [PMC free article] [PubMed] [Google Scholar]
- 13.Chakrabarti P, English T, Shi J, Smas CM, Kandror KV. Mammalian target of rapamycin complex 1 suppresses lipolysis, stimulates lipogenesis, and promotes fat storage. Diabetes 2010;59:775–781 [DOI] [PMC free article] [PubMed] [Google Scholar]
- 14.Gagnon A, Lau S, Sorisky A. Rapamycin-sensitive phase of 3T3-L1 preadipocyte differentiation after clonal expansion. J Cell Physiol 2001;189:14–22 [DOI] [PubMed] [Google Scholar]
- 15.Kim JE, Chen J. Regulation of peroxisome proliferator-activated receptor-gamma activity by mammalian target of rapamycin and amino acids in adipogenesis. Diabetes 2004;53:2748–2756 [DOI] [PubMed] [Google Scholar]
- 16.Polak P, Cybulski N, Feige JN, Auwerx J, Rüegg MA, Hall MN. Adipose-specific knockout of raptor results in lean mice with enhanced mitochondrial respiration. Cell Metab 2008;8:399–410 [DOI] [PubMed] [Google Scholar]
- 17.Soliman GA, Acosta-Jaquez HA, Fingar DC. mTORC1 inhibition via rapamycin promotes triacylglycerol lipolysis and release of free fatty acids in 3T3-L1 adipocytes. Lipids 2010;45:1089–1100 [DOI] [PMC free article] [PubMed] [Google Scholar]
- 18.Liu M, Bai J, He S, et al. Grb10 promotes lipolysis and thermogenesis by phosphorylation-dependent feedback inhibition of mTORC1. Cell Metab 2014;19:967–980 [DOI] [PMC free article] [PubMed] [Google Scholar]
- 19.Shan T, Zhang P, Jiang Q, Xiong Y, Wang Y, Kuang S. Adipocyte-specific deletion of mTOR inhibits adipose tissue development and causes insulin resistance in mice. Diabetologia 2016;59:1995–2004 [DOI] [PMC free article] [PubMed] [Google Scholar]
- 20.Liu D, Bordicchia M, Zhang C, et al. Activation of mTORC1 is essential for β-adrenergic stimulation of adipose browning. J Clin Invest 2016;126:1704–1716 [DOI] [PMC free article] [PubMed] [Google Scholar]
- 21.Tran CM, Mukherjee S, Ye L, et al. Rapamycin blocks induction of the thermogenic program in white adipose tissue. Diabetes 2016;65:927–941 [DOI] [PMC free article] [PubMed] [Google Scholar]
- 22.Collins S, Yehuda-Shnaidman E, Wang H. Positive and negative control of Ucp1 gene transcription and the role of β-adrenergic signaling networks. Int J Obes 2010;34(Suppl. 1):S28–S33 [DOI] [PubMed] [Google Scholar]
- 23.Lynch MJ, Baillie GS, Houslay MD. cAMP-specific phosphodiesterase-4D5 (PDE4D5) provides a paradigm for understanding the unique non-redundant roles that PDE4 isoforms play in shaping compartmentalized cAMP cell signalling. Biochem Soc Trans 2007;35:938–941 [DOI] [PubMed] [Google Scholar]
- 24.Nedergaard J, Golozoubova V, Matthias A, Asadi A, Jacobsson A, Cannon B. UCP1: the only protein able to mediate adaptive non-shivering thermogenesis and metabolic inefficiency. Biochim Biophys Acta 2001;1504:82–106 [DOI] [PubMed] [Google Scholar]
- 25.Zou J, Zhou L, Du XX, et al. Rheb1 is required for mTORC1 and myelination in postnatal brain development. Dev Cell 2011;20:97–108 [DOI] [PMC free article] [PubMed] [Google Scholar]
- 26.Wang ZV, Deng Y, Wang QA, Sun K, Scherer PE. Identification and characterization of a promoter cassette conferring adipocyte-specific gene expression. Endocrinology 2010;151:2933–2939 [DOI] [PMC free article] [PubMed] [Google Scholar]
- 27.Wong LJ, Lam CW. Alternative, noninvasive tissues for quantitative screening of mutant mitochondrial DNA. Clin Chem 1997;43:1241–1243 [PubMed] [Google Scholar]
- 28.Lagouge M, Argmann C, Gerhart-Hines Z, et al. Resveratrol improves mitochondrial function and protects against metabolic disease by activating SIRT1 and PGC-1alpha. Cell 2006;127:1109–1122 [DOI] [PubMed] [Google Scholar]
- 29.Ahmadian M, Abbott MJ, Tang T, et al. Desnutrin/ATGL is regulated by AMPK and is required for a brown adipose phenotype. Cell Metab 2011;13:739–748 [DOI] [PMC free article] [PubMed] [Google Scholar]
- 30.Lass A, Zimmermann R, Haemmerle G, et al. Adipose triglyceride lipase-mediated lipolysis of cellular fat stores is activated by CGI-58 and defective in Chanarin-Dorfman Syndrome. Cell Metab 2006;3:309–319 [DOI] [PubMed] [Google Scholar]
- 31.Klein J, Fasshauer M, Ito M, Lowell BB, Benito M, Kahn CR. beta(3)-Adrenergic stimulation differentially inhibits insulin signaling and decreases insulin-induced glucose uptake in brown adipocytes. J Biol Chem 1999;274:34795–34802 [DOI] [PubMed] [Google Scholar]
- 32.Fasshauer M, Klein J, Neumann S, Eszlinger M, Paschke R. Tumor necrosis factor alpha is a negative regulator of resistin gene expression and secretion in 3T3-L1 adipocytes. Biochem Biophys Res Commun 2001;288:1027–1031 [DOI] [PubMed] [Google Scholar]
- 33.Kong X, Yu J, Bi J, et al. Glucocorticoids transcriptionally regulate miR-27b expression promoting body fat accumulation via suppressing the browning of white adipose tissue. Diabetes 2015;64:393–404 [DOI] [PMC free article] [PubMed] [Google Scholar]
- 34.Cao W, Medvedev AV, Daniel KW, Collins S. beta-Adrenergic activation of p38 MAP kinase in adipocytes: cAMP induction of the uncoupling protein 1 (UCP1) gene requires p38 MAP kinase. J Biol Chem 2001;276:27077–27082 [DOI] [PubMed] [Google Scholar]
- 35.Vezzosi D, Bertherat J. Phosphodiesterases in endocrine physiology and disease. Eur J Endocrinol 2011;165:177–188 [DOI] [PubMed] [Google Scholar]
- 36.Kim HW, Ha SH, Lee MN, et al. Cyclic AMP controls mTOR through regulation of the dynamic interaction between Rheb and phosphodiesterase 4D. Mol Cell Biol 2010;30:5406–5420 [DOI] [PMC free article] [PubMed] [Google Scholar]
- 37.Ricciarelli R, Fedele E. Phosphodiesterase 4D: an enzyme to remember. Br J Pharmacol 2015;172:4785–4789 [DOI] [PMC free article] [PubMed] [Google Scholar]
- 38.Clark GJ, Kinch MS, Rogers-Graham K, Sebti SM, Hamilton AD, Der CJ. The Ras-related protein Rheb is farnesylated and antagonizes Ras signaling and transformation. J Biol Chem 1997;272:10608–10615 [DOI] [PubMed] [Google Scholar]
- 39.Li Y, Wang Y, Kim E, et al. Bnip3 mediates the hypoxia-induced inhibition on mammalian target of rapamycin by interacting with Rheb. J Biol Chem 2007;282:35803–35813 [DOI] [PubMed] [Google Scholar]
- 40.Heard JJ, Fong V, Bathaie SZ, Tamanoi F. Recent progress in the study of the Rheb family GTPases. Cell Signal 2014;26:1950–1957 [DOI] [PMC free article] [PubMed] [Google Scholar]
- 41.Karbowniczek M, Cash T, Cheung M, Robertson GP, Astrinidis A, Henske EP. Regulation of B-Raf kinase activity by tuberin and Rheb is mammalian target of rapamycin (mTOR)-independent. J Biol Chem 2004;279:29930–29937 [DOI] [PubMed] [Google Scholar]
- 42.Karbowniczek M, Zitserman D, Khabibullin D, et al. The evolutionarily conserved TSC/Rheb pathway activates Notch in tuberous sclerosis complex and Drosophila external sensory organ development. J Clin Invest 2010;120:93–102 [DOI] [PMC free article] [PubMed] [Google Scholar]
- 43.Cao W, Daniel KW, Robidoux J, et al. p38 mitogen-activated protein kinase is the central regulator of cyclic AMP-dependent transcription of the brown fat uncoupling protein 1 gene. Mol Cell Biol 2004;24:3057–3067 [DOI] [PMC free article] [PubMed] [Google Scholar]
Associated Data
This section collects any data citations, data availability statements, or supplementary materials included in this article.


