

Abstract
Motivation: As the tree of life is populated with sequenced genomes ever more densely, the new challenge is the accurate and consistent annotation of entire clades of genomes. We address this problem with a new approach to comparative gene finding that takes a multiple genome alignment of closely related species and simultaneously predicts the location and structure of protein-coding genes in all input genomes, thereby exploiting negative selection and sequence conservation. The model prefers potential gene structures in the different genomes that are in agreement with each other, or—if not—where the exon gains and losses are plausible given the species tree. We formulate the multi-species gene finding problem as a binary labeling problem on a graph. The resulting optimization problem is NP hard, but can be efficiently approximated using a subgradient-based dual decomposition approach.
Results: The proposed method was tested on whole-genome alignments of 12 vertebrate and 12 Drosophila species. The accuracy was evaluated for human, mouse and Drosophila melanogaster and compared to competing methods. Results suggest that our method is well-suited for annotation of (a large number of) genomes of closely related species within a clade, in particular, when RNA-Seq data are available for many of the genomes. The transfer of existing annotations from one genome to another via the genome alignment is more accurate than previous approaches that are based on protein-spliced alignments, when the genomes are at close to medium distances.
Availability and implementation: The method is implemented in C ++ as part of Augustus and available open source at http://bioinf.uni-greifswald.de/augustus/.
Contact: stefaniekoenig@ymail.com or mario.stanke@uni-greifswald.de
Supplementary information: Supplementary data are available at Bioinformatics online.
1 Introduction
With recent technologies in whole-genome sequencing, the sequencing of entire clades of genomes is in progress. For example, the Genome 10K Project launched in 2009 has taken on the task of sequencing the genomes of 10 000 vertebrate species (Genome 10K Community of Scientists, 2009). Other examples include the 5000 Insect Genome Project (i5k) (Robinson et al., 2011) and the 1000 Fungal Genomes Project of the JGI.
The annotation of genomes, in turn, is a rather slow process. An important step is the identification of protein-coding genes. Although many automatic tools for gene finding are available, none of them is able to predict genes genome-wide without a substantial rate of wrong gene structures or missing genes. For instance, a survey from 2013 (Steijger et al., 2013) suggests that even the most accurate tools are merely predicting 48.53% of the genes (at least one splice form) in Drosophila melanogaster correctly, when using only RNA-Seq data as evidence. For a recent review on the subject, see Hoff and Stanke (2015).
Another evidence source besides transcriptome sequence is homology. One class of methods that exploit homology uses previously identified protein sequences from related species or from a database and performs a spliced alignment against a target genome. Examples are Exonerate (Slater and Birney, 2005) and GenomeThreader (Gremme et al., 2005) that align single protein sequences to the target genome and GeneWise (Birney et al., 2004) and Augustus-PPX (Keller et al., 2011) that take entire protein families represented as sequence profiles as input. These approaches depend on the correctness of the input proteins, their similarity to the target clade and the overlap of the respective proteomes. They are usually suited only as one component of a whole-genome annotation pipeline. The ENSEMBL pipeline, for example, uses amongst other tools GeneWise and Exonerate for protein sequence-based gene prediction. A second class of methods that exploit homology are comparative gene finders. These methods take two or more genome sequences as input and exploit that homolog genes have often a very similar gene structure. By aligning the genomes of related species, conserved regions become visible that are enriched in protein-coding exons but also other functional DNA.
Initial comparative approaches to gene finding such as Twinscan (Korf et al., 2001) simultaneously predict genes in exactly two input genomes (e.g. of human and mouse), but are rather proofs-of-concept and seem to play no substantial role in current genome annotation. To take advantage of a multiple genome alignment, alternative approaches restrict gene finding to a single target genome and use an alignment between the target and multiple related genomes to inform gene finding in the target. Examples are Contrast (Gross et al., 2007) and N-Scan (Gross and Brent, 2006). In particular, Contrast achieved striking results (58.6% sensitivity and 35.5% specificity for human on gene level). Despite the very good performance of comparative gene finding and the potential to combine homology evidence with evidence from transcriptome sequencing, Contrast and N-Scan are rarely used for whole-genome annotation. Reasons may include the fact that both require an elaborate parameter training specific to the set of ‘informant’ genomes, that has to be repeated for every genome in the clade that should be annotated, which, even if automated, leads to a running-time quadratic in the number of genomes. A methodical disadvantage is further the restriction of gene finding to a single target genome. This has the drawback that likely gene structures in the informant genomes are not taken into consideration when choosing a gene structure in the target genome.
We present a novel approach to comparative gene finding that simultaneously identifies genes in k ≥ 2 genomes and that is suitable for the annotation of entire clades of genomes, e.g. the runtime is linear in the number of genomes k. We introduce a graph-theoretical framework and formulate the problem as a binary labeling problem on a graph. In general, exact inference in this model is not tractable, however, we can take advantage of the special structure of the graph that allows decomposition into two tractable sub problems: Finding longest paths in directed acyclic graphs (DAGs), and maximum a-posteriori probability (MAP) inference on trees. A subgradient-based dual decomposition approach is derived for approximate inference, guaranteeing an upper bound on the approximation error. Dual decomposition and more generally Lagrangian relaxation has already been applied to a variety of inference problems, e.g. for the multiple sequence alignment problem (Althaus and Canzar, 2008), computer vision (Komodakis et al., 2011) and natural language processing (Rush et al., 2010). More recently, dual decomposition was adopted for integrating RNA-Seq evidence into HMM-based gene structure prediction (Inatsuki et al., 2016).
The proposed method is implemented as an extension to the gene finder Augustus (Stanke et al., 2008) and in the following referred to as Augustuscgp. The required inputs are the genomes of two or more species as well as an alignment and a phylogenetic tree of the genomes. With no further information, Augustuscgp infers gene structures de novo by only making use of the raw genomes and alignment information. Augustuscgp incorporates evidence for negative selection by computing an estimate for the ratio of non-synonymous and synonymous substitutions ω = dN∕dS for all considered candidate coding exons. Furthermore, Augustuscgp can incorporate additional evidence, e.g. from RNA-Seq and existing annotations. The latter is used for the special application of transferring a trusted annotation from a known genome to newly sequenced genomes. The performance of Augustuscgp for all three tasks—de novo/evidence-based gene finding and cross-species annotation transfer—is evaluated on two data sets, a vertebrate and a Drosophila subclade of 12 species each, and discussed in the results section.
Training the parameters of Augustuscgp is not more expensive than hitherto for a single genome. The species-specific parameters are only learned for one representative in the clade (e.g. human in a mammalian clade) with no need for retraining when more genomes are added to the clade or removed. Apart from the species-specific parameters there are only few extra cross-species parameters to adjust such as rates for exon gain and loss.
2 Methods
Here, we formally introduce the problem of comparative gene finding using a graph and a scoring function for all possible joint gene structures in k homologous sequences. The problem is NP-hard. Therefore, we developed an approximative algorithm based on dual decomposition for determining a joint gene structure with maximal score. Given the page constraint, we focus on the algorithmic part here.
2.1 The model of a joint gene structure
Let us first consider a single genomic sequence g. The space of all possible gene structures x in g can be modeled as paths from a source s to a sink ℓ in a weighted directed acyclic graph, which in the following is referred to as gene structure graph. For a conceptual example, see the graph for sequence 1 in Figure 1. A gene structure may cover one or several genes, or even just intergenic region. Gene structures with overlapping transcripts, such as from alternative splicing, are not considered here. Nodes in the gene structure graph denote candidate exons. Directed edges represent candidate introns or intergenic regions and connect two nodes if they constitute a biologically meaningful sequence of exons. Both candidate exons and introns are obtained within Augustus by random sampling of gene structures from the posterior distribution defined by a semi-Markov conditional random field. The sampling of gene structures in Augustus has previously been introduced to identify alternative transcripts (Stanke et al., 2006). In general, sampling yields just the most likely splicing variants, which do not sufficiently represent the space of all possible gene structures. To account for this, two adjustments are made. First, the posterior distribution is ‘heated’ by raising its posterior probabilities to the power of and subsequent renormalizing, . As a consequence, the sampling of less likely gene structures increases for r < 1, the sample of candidate exons is more inclusive and for candidate exons, that are frequently sampled, their heated posterior probability Pr(x) is a more conservative estimate of the probability of being correct than in the original distribution P.
Fig. 1.
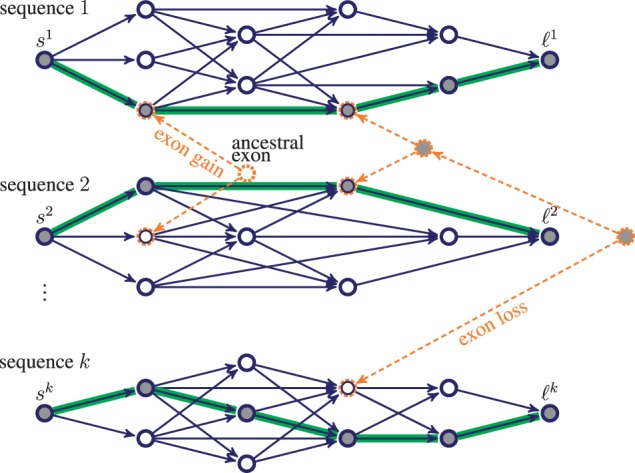
The joint gene structure graph G for a set of k homologous sequences. Nodes represent candidate exons. Blue/solid edges represent candidate introns or intergenic regions. Each path from the source si to the sink ℓi is a possible gene structure in sequence i. Homologous candidate exons are at the same time leaf nodes of phylogenetic trees (orange/dashed edges and nodes). A joint gene structure is sought: a binary labeling (filled, empty) of all nodes in G, whose restriction on the extant nodes (blue/solid) defines a collection of k paths (highlighted)
In addition, candidate exons are inserted into the graph that were not sampled. These are determined by all possible combinations of exon boundary signals (translation start/stop and donor/acceptor splice sites) that are within a given distance and that do not contain in-frame stop codons. The number of such candidate exons is within the same order of magnitude as the length of sequence g. To reduce run time and memory usage, candidate exons may be filtered by imposing a threshold on splice site scores.
The score of each source-sink path is a sum of node and edge weights. Both node and edge weights are real-valued functions of the posterior probability of the exon or intron as estimated by the relative sampling frequency of the corresponding candidate exons and introns, respectively. Exon candidates that are not sampled, are scored as if they have posterior probability 0. Furthermore, if extrinsic evidence is given, such as from RNA-Seq, then the weights indirectly depend on the evidence as candidate exons and introns that are supported by evidence typically achieve high posterior probabilities. The problem of finding an optimal gene structure in such a single genomic sequence, can be solved efficiently with standard algorithms for longest-paths problems.
Now, let us consider a syntenic region consisting of k homologous sequences. In general, there will be many, sometimes overlapping syntenic regions between the genomes or a subset of the genomes, each of which is an instance of the proposed method. These regions of synteny are determined within Augustuscgp by merging compatible alignment blocks in the input alignment to larger blocks of synteny. Note, however, that this is not a trivial task in itself, especially in cases where the genome assemblies are highly fragmented. Ideally, the syntenic regions are large enough to contain one or more genes. Let be the gene structure graph of sequence gi ( with node set Vi and edge set Ei. The gene structure graphs are now combined into a single graph by connecting homologous candidate exons via phylogenetic trees as follows: Let ∼ denote an equivalence relation on , such that for if and only if both start and end positions of candidate exons u and v map to the same positions in the alignment and are in the same reading frame. The relation ∼ partitions V into a set of equivalent classes, each of which is referred to as a homologous exon candidate tuple (HECT). All elements in a HECT are candidate exons that are putative homologs, meaning that they are believed to be derived from a common ancestor. The elements of singletons are candidate exons with no homologs in the other sequences. All exons in a HECT are linked by a phylogenetic tree by merging them with their counterparts (e.g. leaf nodes) in the tree. The tree is a copy of the input species tree in which the leaf node of species i is pruned if the HECT does not contain an exon candidate of species i.
Let denote the joint gene structure graph, in which , A is the set of all ancestral exons (interior nodes of the phylogenetic trees), is the set of all ‘intron’ or ‘intergenic’ edges (blue/solid edges in Fig. 1) and EP is the set of all phylogenetic edges (orange/dashed edges in Fig. 1) in G. The joint gene structure graph comprises all possible gene structures of all k sequences (Fig. 1). Loosely speaking, the aim is to choose exactly one gene structure, or equivalently, one source-sink path , for each sequence . In the following, such a collection of k paths is also called a joint gene structure. In mathematical terms a joint gene structure is an assignment of all nodes in G. Observe that this formal definition of a joint gene structure includes the choice of ancestral exons. A node v is assigned to 1 if it is part of the joint gene structure and 0 otherwise. We will also say that v is active if xv = 1 and inactive if xv = 0. Likewise, an edge is active if both u and v are active and there is no path from u to v that passes through active nodes other than u and v. The subset is the set of all assignments that obey the path property, e.g. each source node has exactly one outgoing active edge, each sink node has exactly one incoming active edge and all other nodes have an equal number (0 or 1) of incoming active edges and outgoing active edges.
The score of a joint gene structure x has two components, a horizontal, species-specific score and a vertical, cross-species score ):
| (1) |
The horizontal score is the sum over all weights of active nodes and active edges . The node and edge weights are the ones from gene finding in a single genomic sequence as described above. The vertical score is a sum over the trees in the graph, a function of the labels of all nodes in HECTs and can be split into a feature score and an evolutionary score. The feature score is a linear combination of different features of homologous candidate exons including selective pressure (estimated by ω = dN∕dS), phylogenetic diversity (sum of branch lengths in the tree that connects a HECT) and conservation (average Shannon entropy across all alignment columns in a HECT). It rewards candidate exons that show signs of negative selection (ω ≪ 1) and are conserved even across the more distant species. The coefficients of the linear combination are calculated using logistic regression. The evolutionary score is based on a continuous-time Markov process and assesses the evolutionary history of a joint gene structure in terms of exon gain and loss events along branches in the tree (see Fig. 1). Similar models have been used previously for intron evolution (Csűrös, 2006). In this model, the gain or loss of an exon is generally expensive and penalized depending on the branch length and two rates for exon gain λ > 0 and exon loss μ > 0. As a consequence, all candidate exons in a HECT are encouraged to agree on one assignment. If not, assignments are preferred that can be explained with few exon gain or loss events that are rather along long branches than along short branches.
2.2 Dual decomposition
Finding an optimal joint gene structure x* that maximizes the scoring function in (1), i.e.
| (2) |
is an NP-complete problem, even if the vertical score is assumed to be a simple parsimony score penalizing exon gain and loss only. This can be shown by a reduction from the 3-colorability problem (proof omitted). For this reason, an approximative approach, known as dual decomposition, has been adopted, that makes use of the observation that the problem in (2) is decomposable into two easy sub problems:
| (3) |
| (4) |
Here, the assignment x is partitioned into three disjoint assignments , where yh is an assignment of all candidate exons with no homologs in the other species (blue/solid nodes in Fig. 1), yv is an assignment of all ancestral exons (orange/dashed nodes in Fig. 1), and z is an assignment of all homologous candidate exons (mixed colored/solid and dashed nodes in Fig. 1). Problem (3) (blue/solid subgraph in Fig. 1) maximizes over the horizontal score and is equivalent to finding an optimal gene structure in each of the k sequences individually. It can be solved efficiently with an algorithm for longest-path problems. Problem (4) (orange/dashed subgraph in Fig. 1) maximizes over the vertical score and is equivalent to finding an optimal assignment of nodes in a set of disjoint trees. This can also be solved efficiently, for example with a variant of Felsenstein’s pruning algorithm (Felsenstein, 2003). However, maximizing over the sum of the horizontal and vertical score (e.g. problem (2)) is hard, due to the complicating variablesz that couple the two sub problems.
The Lagrangian Dual problem
An equivalent formulation of problem (2), in which each sub problem has its own copy of complicating variables, is
| (5) |
The constraint zh = zv ensures that the two sub problems agree on their copies of complicating variables. In the next step, Langrangian relaxation is applied by dropping the constraint and moving it into the objective function:
| (6) |
where is the set of Lagrange Multipliers, which can be regarded as penalty for violating the constraint , and is the Lagrangian Dual function. Since the Lagrangian Dual function is an upper bound on for any , the tightest upper bound, e.g. the set of Lagrange Multipliers that minimizes the Lagrangian Dual function
is sought. This is also known as the dual problem. Note that the Lagrangian Dual function is convex but, in general, not differentiable. Thus, gradient descent methods are not directly applicable. A method similar to gradient descent for minimizing convex non-differentiable functions is the subgradient method. Given an initial (e.g. ), it generates a sequence of Lagrange Multipliers by following the update rule
where is the step size at iteration t and gt is a subgradient of at that can be efficiently computed by solving the two sub problems in (6). The complete algorithm is given in Figure 2.
Fig. 2.
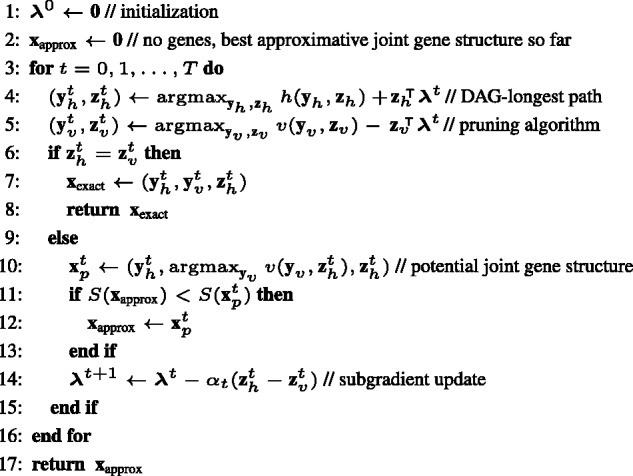
The dual decomposition algorithm for finding an optimal or near optimal joint gene structure x
The algorithm terminates either if in any iteration t the constraint is met or when the maximum number of iterations T has been reached. In the first case, an optimal joint gene structure has been found. In the second case, an approximative joint gene structure can be obtained as follows: In each iteration t, a potential joint gene structure can be recovered from the dual solution. If , i.e. when we have two inconsistent labelings of the exon candidates that are also leaf nodes in a tree, we chose to give precedence to the labeling , because it represents together with biologically valid gene structures in each of the species. We therefore chose in line 10 the optimal ancestral labeling for the labeling of the leaf nodes. The potential joint gene structure with highest score over all iterations is our best guess and at most
below the optimum.
Choosing a good step size is crucial for convergence and speed of convergence. If the sequence of step sizes is diminishing and non-summable, i.e.
convergence of the dual problem is guaranteed (Nedic and Bertsekas, 2001). Thus
For the choice of the step size, see Supplementary S1. The complexities of the longest path search and pruning algorithm are and , respectively. In our implementation although the number of intron candidates grows quadratically with the number of exon candidates. This is achieved by introducing at most two auxiliary nodes for each exon candidate. Therefore, the runtime for determining an optimal or near optimal joint gene structure is proportional to .
3 Results
3.1 Implementation
The proposed algorithm is implemented as an extension to the gene finder Augustus and is available at http://bioinf.uni-greifswald.de/augustus/ starting with the 3.1 release. Improvements to the vertical scoring function are an ongoing development and will be included in future releases. In order to call Augustus in cgp mode, the following three inputs are required: a set of two or more genomes, each in Multi-FASTA format, an alignment of the genomes in MAF format and a phylogenetic tree in NEWICK format describing the evolutionary relationship of the genomes. Each genome may be supplemented with extrinsic evidence (e.g. transcriptome data or existing annotations) in GFF format, if available. The outputs are GFF files with the gene predictions for each input genome. To keep the memory usage as low as possible, Augustus has a database API that allows the storage and retrieval of genome and evidence data from either a MySQL or an SQLite database. Augustus has no multi-threading support. Instead, it is recommended to split the alignment file into smaller chunks and then to run Augustus on each chunk in parallel. Auxiliary tools are available to join gene sets of different runs.
3.2 Datasets
We tested our method on two subclades, one of vertebrates and one of drosophilas, each containing species with different genetic distances to each other.
For the Drosophila experiments the current genomes releases of D. melanogaster and 11 other Drosophila species (Drosophila 12 Genomes Consortium, 2007) were downloaded from FlyBase (http://flybase.org). For a complete list of the species and genome releases used, see Supplementary S2. All genomes were soft-masked with RepeatMasker (Smit et al., 2015) using the standard Repbase Drosophila library and TRF (Benson, 1999). An alignment of the masked genomes was built with Progressive Cactus (Paten et al., 2011). Both Progressive Cactus and Augustuscgp require a phylogenetic tree as input with branch lengths in units of number of nucleotide substitutions per site. A detailed description of the tree reconstruction can be found in Supplementary S3.
For the vertebrate experiments, the soft-masked genomes of human (hg38), rhesus (rheMac3), mouse (mm10), rat (rn6), rabbit (oryCun2), dog (canFam3), cow (bosTau8), armadillo (dasNov3), elephant (loxAfr3), tenrec (echTel2), opossum (monDom5) and chicken (galGal4) were downloaded from the UCSC Genome Browser database (http://genome.ucsc.edu) and a 12-way alignment of the genomes extracted from the UCSC MultiZ (Blanchette et al., 2004) 100-way alignment. A phylogenetic tree of the species was extracted from the guide tree used during alignment construction.
We evaluated the accuracy of the vertebrate predictions on human and mouse and the Drosophila predictions on D. melanogaster, which have the most mature annotations in the respective clades. Table 1 gives an overview of the reference gene sets. Each reference annotation was quality filtered by removal of questionable transcripts (e.g. with in-frame stop codon, splice site pairs other than GT-AG, GC-AG or AT-AC, missing start or stop codon or a coding sequence (CDS) length not a multiple of 3) with the filtering tool gene-check from the UCSC Genome Browser group. The conventional accuracy measures sensitivity and specificity of the prediction on gene, exon and nucleotide level were calculated using the Eval package (Keibler and Brent, 2003). The evaluation was done on protein coding regions (CDS) only, although Augustus predicted untranslated regions (UTRs) in the RNA-Seq-based experiments, as well. An exon is classified as correctly predicted if both its boundaries coincide with a reference exon on the same strand. A gene is counted as correct if it matches the coding region of one splice form of a reference gene exactly.
Table 1.
Overview of reference gene sets after quality filtering with gene-check (only protein-coding genes/transcripts (Txs) are counted)
| Species | Source | Txs | Genes | Txs per Gene |
|---|---|---|---|---|
| Human | RefSeq (hg38) | 38850 | 18744 | 2.07 |
| Mouse | RefSeq (mm10) | 29613 | 20126 | 1.47 |
| D. melanogaster | FlyBase (r6.04) | 21436 | 13785 | 1.56 |
3.3 Denovo performance
As RNA-Seq data is readily available for most genomes, we only briefly summarize the results for de novo gene finding. A detailed discussion can be found in Supplementary S4. As shown in Supplementary Table S2, the new comparative approach Augustuscgp is more accurate than the standard version of Augustus that predicts genes in a single genome only, and N-Scan, a previous system for de novo gene finding. On exon level it is even competitive with Contrast, which is arguably still the most accurate de novo method for human and fly.
3.4 Performance with RNA-Seq data
It is a good policy to combine information from many different sources of evidence. Augustus allows for integration of different types of extrinsic evidence including transcriptome data (RNA-Seq, cDNA, ESTs), protein sequences, and existing annotations. In Augustuscgp extrinsic evidence is species-specific and can be provided for each or a subset of the genomes. To see how well Augustuscgp performs with extrinsic evidence, we conducted several experiments incorporating RNA-Seq data for 1 to a maximum of 4 input genomes. For the vertebrate clade paired-end RNA-Seq reads for human, rhesus, mouse and chicken and for the Drosophila clade for D. mel, D. sim, D. pse and D. vir were obtained from the Sequence Read Archive (www.ncbi.nlm.nih.gov/sra) and mapped to the corresponding (unmasked) genomes with Star (Dobin et al., 2013). The resulting spliced alignments were filtered by coverage (minimum 80% of read length) and percentage identity (minimum 92%). If a read mapped to multiple locations, only the unique best alignment (in terms of coverage and percentage identity) for that read was kept, i.e. the best alignment was also discarded if the second best was almost equally good. Table 2 shows the results for the RNA-Seq-based experiments. When only using RNA-Seq evidence for the target species (e.g. prediction in human with human as RNA-Seq source), Augustuscgp is more accurate compared to Augustus using the same evidence. Using exclusively RNA-Seq evidence of non-target genomes shows only moderate improvements over the de novo Augustuscgp predictions and the effectiveness of the RNA-Seq evidence decreases with an increasing distance of the source species to the target species, e.g. incorporating RNA-Seq evidence for the remote chicken has almost no influence on the prediction in human or mouse. This is generally to be expected, as the evidence can only be carried over to genes common to both the target and the source, but not to genes that are exclusive to the target genome. The best results for human and mouse are obtained when using the combined RNA-Seq evidence for human, rhesus, mouse and chicken (see ‘4 vert’ in Table 2). This suggests, that evidence coming from different species is complementary, which is certainly also related to the fact that the RNA-Seq libraries were derived from different tissues for different species. The same can be observed in the Drosophila experiments. Combining the D. mel evidence with the RNA-Seq evidence of the close D. sim (‘2 Dros’ in Table 2) increases the accuracy over using D. mel evidence only. However, beyond that, there are no significant improvements, when further adding RNA-Seq evidence of the more distant flies D. pse and D. vir (‘4 Dros’ in Table 2). Note, however, that such RNA-Seq data is still likely to improve the Augustuscgp accuracy on genomes close to D. pse and D. vir.
Table 2.
Sensitivity (Sn) and specificity (Sp) of the RNA-Seq-based whole-genome predictions of D. mel, human and mouse at gene, exon and nucleotide (Nuc) level (values are given in %). The source column refers to the species for which RNA-Seq evidence was incorporated for gene finding. The sources ‘4 vert’, ‘2 Dros’ and ‘4 Dros’ refer to the combined RNA-Seq evidence for (human, rhesus, mouse, chicken), (D. mel, D. sim) and (D. mel, D. sim, D. pse, D. vir), respectively
| RNA-Seq | Source | Gene Sn | Gene Sp | Exon Sn | Exon Sp | Nuc Sn | Nuc Sp |
|---|---|---|---|---|---|---|---|
| D. melanogaster | |||||||
| Augstus | D. mel | 68.01 | 73.26 | 76.46 | 90.20 | 93.39 | 97.57 |
| Augstuscgp | D. mel | 71.88 | 72.20 | 79.27 | 89.09 | 96.46 | 97.49 |
| Augstuscgp | D. sim | 67.10 | 67.43 | 77.64 | 86.67 | 95.96 | 97.71 |
| Augstuscgp | 2 Dros | 74.33 | 73.13 | 80.22 | 89.74 | 96.77 | 97.57 |
| Augstuscgp | 4 Dros | 74.46 | 73.18 | 80.31 | 89.79 | 96.79 | 97.56 |
| Human | |||||||
| Augstus | Human | 52.43 | 37.31 | 81.69 | 81.65 | 89.67 | 85.66 |
| Augstuscgp | Human | 61.30 | 50.96 | 87.62 | 86.80 | 92.23 | 89.66 |
| Augstuscgp | Rhesus | 52.00 | 44.17 | 86.43 | 84.63 | 91.64 | 89.04 |
| Augstuscgp | Mouse | 49.21 | 44.07 | 86.11 | 84.89 | 91.56 | 89.17 |
| Augstuscgp | Chicken | 46.42 | 41.98 | 85.41 | 84.46 | 91.09 | 89.18 |
| Augstuscgp | 4 vert | 66.19 | 53.97 | 88.31 | 87.43 | 92.73 | 89.72 |
| Mouse | |||||||
| Augstus | Mouse | 55.28 | 41.00 | 86.62 | 81.53 | 89.61 | 80.74 |
| Augstuscgp | Mouse | 55.81 | 52.17 | 86.98 | 87.39 | 86.07 | 88.90 |
| Augstuscgp | Human | 42.43 | 45.93 | 84.77 | 86.53 | 84.17 | 90.26 |
| Augstuscgp | Rhesus | 42.26 | 45.69 | 84.65 | 86.51 | 84.12 | 90.25 |
| Augstuscgp | Chicken | 40.26 | 43.86 | 84.18 | 86.06 | 83.89 | 90.16 |
| Augstuscgp | 4 vert | 59.00 | 54.86 | 87.55 | 88.05 | 86.45 | 89.03 |
Bold values represent the best results for the respective target species.
3.5 Liftover of existing annotations
An increasingly important strategy in genome annotation is the transfer of trusted annotations of previously existing genomes to newly sequenced genomes with a reasonable degree of sequence similarity. Approaches such as Exonerate, GeneWise and GenomeThreader (Gth) incorporate splicing models to align known protein sequences of close relatives to the target species. Augustuscgp can also transfer annotation evidence from one or more source genomes to the other genomes—via the genome alignment. To achieve this, the annotations are compiled into CDS and intron ‘hints’ similar to other extrinsic data. As a result, CDS exons and introns that are supported by such hints have higher posterior probabilities, which implicitly makes their orthologs in the other species also more likely. Note that, in contrast to protein homology-based strategies for annotation liftover, Augustuscgp can identify new genes and gene structures different from the source gene.
To test the performance of Augustuscgp for annotation liftover, we conducted several experiments with different pairs of target and source genomes. The source species were selected based on their genetic distance to the target and the completeness of their annotations. The vertebrate annotations were obtained from the RefSeq database and the Drosophila annotations from FlyBase. In the case of chicken, we added the Ensembl annotation, as the RefSeq set contained only around 6000 protein-coding genes.
For comparison with protein spliced-alignment approaches, we ran Exonerate and Gth with the same target-source pairs. Exonerate performed slightly worse than Gth, when transferring annotations within the fly clade (Supplementary S5.1). For this reason and due to the runtime requirements we chose not to run Exonerate on the vertebrate genomes (about 300 times the size of fly genomes). Gth, in turn, is considerably faster (in our experiments 77 times faster than Exonerate) by indexing the target genome via enhanced suffix arrays.
Figure 3 shows the results when choosing mouse as target and different non-mouse vertebrates as sources. The accuracy of Gth decreases rapidly with an increasing distance of the source to the target species. In particular the sensitivity decreases, e.g. when choosing the remote chicken as source, the sensitivity drops to 27%. This is to be expected, as protein-spliced alignment approaches entirely depend on the alignability of the source proteins to the target genome. Augustuscgp also looses accuracy with an increasing distance, however, when the source and target are too distant to align with, the de novo model is still effectively exploiting conservation and synteny to closer species in the clade. Combining the protein sequences of rat, human, cow and chicken does not increase the accuracy of Gth over the accuracy obtained for the single best/closest source species (rat). In the fly experiments with D.mel as target, even a loss in accuracy is observed for both Gth and Exonerate when adding the protein sequences of four more distant drosophilas (D. pse, D. wil D. vir and D. gri) to the D. ana protein set (Supplementary S5.1). Whereas the sensitivity stays approximately the same, there is an extreme loss in specificity, suggesting that most of the correctly predicted exons are already covered by the D. ana proteins, whereas more distant flies merely introduce false positive exons. Augustuscgp, in turn, shows in all experiments an increase in both sensitivity and specificity, when combining annotations, albeit only a very modest. When choosing human as target, the results are similar with the exception that both Gth and Augustuscgp yield poorer results with rat as source than with mouse, although both have the same genetic distance to human (Supplementary S5.2). This clearly demonstrates that beside the genetic distance, also the completeness of the annotation is crucial. The RefSeq annotation of rat has, for example, more than 50 000 fewer CDS exons than the RefSeq annotations of mouse and human.
Fig. 3.

F1 scores (harmonic mean of sensitivity and specificity) on exon level for transferring the annotation from a non-mouse vertebrate genome (source) to the mouse genome (target). Values are given for different source genomes with an increasing distance to the target (horizontal axis). The rightmost data points are the accuracies, when using the combined annotations of all source genomes, e.g. rat, human, cow and chicken. Augustuscgp uses a whole-genome alignment between mouse and 11 other vertebrates as well as annotation evidence (CDS and intron hints) for the source genome(s)
As shown in Figure 3, transferring the annotation from a remote species like chicken to mouse with Augustuscgp has no gain in accuracy over the de novo prediction. Based on the above findings on the vertebrate and fly clade, it can be roughly estimated for two arbitrary species with known protein sequence similarity (e.g. from BLASTP), whether a genome alignment between the species is possible and a gain in accuracy can be expected from annotation transfer (Supplementary S5.3 for assistance).
3.6 Effectiveness of dual decomposition
In the vertebrate experiments, dual decomposition was applied to approximately 10 000 syntenic regions in 97% of which an exact solution was found (on average after 150 iterations). In all other cases the approximation error was less than 1.2% of the initial error when stopping after 2500 iterations. For the Drosophila clade (≈ 4500 syntenic regions), a similar convergence speed and approximation error was observed.
Table 3 shows the runtime (sum of CPU times over all threads) and memory requirements of Augustuscgp. The values before the slash refer to de novo gene finding and cross-species annotation transfer, and the values after the slash to gene finding with RNA-Seq evidence, which in general is more expensive as a model for UTRs is included in this case. For parallelization, the genome alignment is split into smaller alignment chunks.
Table 3.
Runtime and memory requirements of Augustuscgp
| Clade | Drosophilas | Vertebrates |
|---|---|---|
| Runtime | 20/28 CPU days | 1/1.6 CPU year |
| Max size of alignment chunks | 100MB | 60MB |
| Total number of chunks | 72 | 1558 |
| Max memory per alignment chunk | 4GB/4GB | 5GB/10GB |
| Processors | 2.83 GHz | 2.8–3.2 GHz |
4 Conclusion
In this article we presented a novel approach to comparative gene finding that is suitable for gene structure annotation of entire clades. Its novelty is that it simultaneously identifies genes in multiple genomes. Previous gene finding systems were either limited to exactly two genomes or restricted the prediction and gene structure model to a single target genome. Unlike the target-informant approach that requires a repetitive training of parameters for each and every genome to be annotated, parameters only have to be trained for a single representative in the clade. Beside the CDS of a gene, our approach can also predict UTRs. This is particularly useful when incorporating RNA-Seq evidence that gives unspecific hints about both coding and non-coding parts of genes.
As a tendency, our approach favors gene structures that are in agreement across the genomes. Thus, it is likely to produce more consistent gene sets than the ones obtained from the individual annotation of each genome. This is particularly important when the objective of study is to investigate the genomic differences of several species within a clade.
The results show that the new multi-species version of Augustus is more accurate than the standard single-species version. In the de novo category where only genome evidence is used it compares favorably with N-Scan. On exon level, it is even competitive with Contrast. Although Contrast still achieves the most accurate de novo predictions for human and fly, it appears to have no practical relevance for current whole-genome annotation. Augustuscgp, in turn, is developed specifically for the increasingly important clade annotation problem with an eye towards practical aspects, e.g. efficient scalability for a large number of genomes in the clade, as few clade-specific parameters as possible, etc.
In evidence-based gene finding our findings are, that the effectiveness of RNA-Seq evidence decreases with an increasing distance of the source species to the target species. When having RNA-Seq evidence for the target species itself, there is only modest benefit from RNA-Seq evidence from other species in the clade. This may, however, be different for other clades and libraries.
Annotation can be transferred using Augustuscgp from one genome to another via the multiple genome alignment. A previously existing option to do this is the alignment of the source proteins (or transcripts) to the target genome. Genome alignments however have the advantage that the context around the exons and genes is also used to identify what is homolog. For example, initial coding exons can be very short and therefore very difficult to align correctly in a protein alignment, even if the genomes are similar, whereas a genome alignment may have no difficulty when the neighboring UTR or intron is also alignable. At very large distances, however, where genome alignments are hardly or not at all possible, protein (family) homology searches are still useful, at least to identify conserved domains of the gene.
The dual decomposition approach has proven to be a well-suited framework to efficiently obtain good approximate and even mostly exact solutions to the formal optimization problem of comparative gene finding.
A common weakness of gene predictors is to distinguish between correct candidate exons and partly correct candidate exons that only differ from each other by a few base pairs. When, for example, classifying all exons in D. mel as correctly predicted that overlap a true exon by at least 80% of the length of the longer one, Augustuscgp achieves de novo an exon sensitivity of 89.94%. In other words, around of the false negative reference exons are close to correctly predicted. We continue to work on the vertical scoring function in order to improve the precision of exon boundary prediction, using the multiple genome alignment. Improving the detection of start and stop boundaries, in particular, may reduce the number of falsely joined genes and further improve gene level accuracy.
Supplementary Material
Acknowledgement
The authors would like to gratefully acknowledge the generous amount of computer resources provided by the Wellcome Trust Sanger Institute.
Funding
This work was supported by the German National Academic Foundation [to S.K.]; the DFG Research Unit [FOR 1234]; and the German Research Foundation [GRK 1870/01].
Conflict of Interest: none declared.
References
- Althaus E., Canzar S. (2008) A Lagrangian relaxation approach for the multiple sequence alignment problem. J. Comb. Optim., 16, 127–154. [Google Scholar]
- Benson G. (1999) Tandem repeats finder: a program to analyze DNA sequences. Nucleic Acids Res., 27, 573–580. [DOI] [PMC free article] [PubMed] [Google Scholar]
- Birney E. et al. (2004) GeneWise and Genomewise. Genome Res., 14, 988–995. [DOI] [PMC free article] [PubMed] [Google Scholar]
- Blanchette M. et al. (2004) Aligning multiple genomic sequences with the threaded blockset aligner. Genome Res., 14, 708–715. [DOI] [PMC free article] [PubMed] [Google Scholar]
- Csűrös M. (2006) On the estimation of intron evolution. PLoS Comput. Biol., 2, e84.. [DOI] [PMC free article] [PubMed] [Google Scholar]
- Dobin A. et al. (2013) STAR: ultrafast universal RNA-seq aligner. Bioinformatics, 29, 15–21. [DOI] [PMC free article] [PubMed] [Google Scholar]
- Drosophila 12 Genomes Consortium (2007) Evolution of genes and genomes on the Drosophila phylogeny. Nature, 450, 203–218. [DOI] [PubMed] [Google Scholar]
- Felsenstein J. (2003). Inferring Phylogenies. Sunderland, MA: Sinauer Associates. [Google Scholar]
- Genome 10K Community of Scientists (2009) Genome 10k: a proposal to obtain whole-genome sequence for 10,000 vertebrate species. J. Hered., 100, 659–674. [DOI] [PMC free article] [PubMed] [Google Scholar]
- Gremme G. et al. (2005) Engineering a software tool for gene structure prediction in higher organisms. Inf. Softw. Technol., 47, 965–978. [Google Scholar]
- Gross S., Brent M. (2006) Using multiple alignments to improve gene prediction. J. Comp. Biol., 13, 379–393. [DOI] [PubMed] [Google Scholar]
- Gross S. et al. (2007) CONTRAST: a discriminative, phylogeny-free approach to multiple informant de novo gene prediction. Genome Biol., 8, R269+. [DOI] [PMC free article] [PubMed] [Google Scholar]
- Hoff K., Stanke M. (2015) Current methods for automated annotation of protein-coding genes. Curr. Opin. Insect Sci, 7, 8–14. [DOI] [PubMed] [Google Scholar]
- Inatsuki T. et al. (2016) Prediction of gene structures from RNA-seq data using dual decomposition. IPSJ Trans. Bioinformatics, 9, 1–6. [Google Scholar]
- Keibler E., Brent M. (2003) Eval: a software package for analysis of genome annotations. BMC Bioinformatics, 4, 50.. [DOI] [PMC free article] [PubMed] [Google Scholar]
- Keller O. et al. (2011) A novel hybrid gene prediction method employing protein multiple sequence alignments. Bioinformatics, 27, 757–763. [DOI] [PubMed] [Google Scholar]
- Komodakis N. et al. (2011) MRF energy minimization and beyond via dual decomposition. IEEE Trans. Pattern Anal. Mach. Intell., 33, 531–552. [DOI] [PubMed] [Google Scholar]
- Korf I. et al. (2001) Integrating genomic homology into gene structure prediction. Bioinformatics, 17 (Suppl 1), S140–S148. [DOI] [PubMed] [Google Scholar]
- Nedic A., Bertsekas D. (2001) Incremental subgradient methods for nondifferentiable optimization. SIAM J. Optim., 12, 109–138. [Google Scholar]
- Paten B. et al. (2011) Cactus: algorithms for genome multiple sequence alignment. Genome Res., 21, 1512–1528. [DOI] [PMC free article] [PubMed] [Google Scholar]
- Robinson G. et al. (2011) Creating a buzz about insect genomes. Science, 331, 1386. [DOI] [PubMed] [Google Scholar]
- Rush A. et al. (2010). On dual decomposition and linear programming relaxations for natural language processing. In: Proceedings of EMNLP. Association for Computational Linguistics (ACL), Stroudsburg, PA.
- Slater G., Birney E. (2005) Automated generation of heuristics for biological sequence comparison. BMC Bioinformatics, 6, 31.. [DOI] [PMC free article] [PubMed] [Google Scholar]
- Smit A. et al. (2013–2015). RepeatMasker Open-4.0. 2013–2015 <http://www.repeatmasker.org>.
- Stanke M. et al. (2006) Augustus: ab initio prediction of alternative transcripts. Nucleic Acids Res., 34, 435–439. [DOI] [PMC free article] [PubMed] [Google Scholar]
- Stanke M. et al. (2008) Using native and syntenically mapped cDNA alignments to improve de novo gene finding. Bioinformatics, 24, 637–644. [DOI] [PubMed] [Google Scholar]
- Steijger T. et al. (2013) Assessment of transcript reconstruction methods for RNA-seq. Nat. Methods, 10, 1177–1184. [DOI] [PMC free article] [PubMed] [Google Scholar]
Associated Data
This section collects any data citations, data availability statements, or supplementary materials included in this article.