Abstract
Motivation
As sequencing technologies improve their capacity to detect distinct transcripts of the same gene and to address complex experimental designs such as longitudinal studies, there is a need to develop statistical methods for the analysis of isoform expression changes in time series data.
Results
Iso-maSigPro is a new functionality of the R package maSigPro for transcriptomics time series data analysis. Iso-maSigPro identifies genes with a differential isoform usage across time. The package also includes new clustering and visualization functions that allow grouping of genes with similar expression patterns at the isoform level, as well as those genes with a shift in major expressed isoform.
Availability and implementation
The package is freely available under the LGPL license from the Bioconductor web site.
Supplementary information
Supplementary data are available at Bioinformatics online.
1 Introduction
Alternative splicing (AS) is a common mechanism of higher eukaryotes to expand transcriptome complexity and functional diversity. The expression of alternative isoforms of many genes respond to developmental regulation (Vuong et al., 2016) and to environmental cues (AlShareef et al., 2017) and hence, there is an interest in studying the dynamics of AS by RNA-seq. While many algorithms have been developed for differential AS analysis most of these approaches target pair-wise comparisons. Dedicated methods for time series AS analysis either restrict to the estimation of isoform levels (Huang and Sanguinetti, 2016) or require large datasets to model time profiles (Topa and Honkela, 2016).
The analysis of differential isoform expression in time course experiments poses a number of specific challenges. Different transcripts of the same gene may vary in their time trajectories and the analysis algorithm should be able to identify those genes where isoform profiles change differently in a significant manner. Additionally, clustering is complicated by the fact that genes have different number of isoforms and hence data do not fit into the structure of traditional clustering, where the same number of data points is required for each feature. Therefore, novel clustering strategies should be envisioned. Finally, transcripts of the same gene have frequently very different expression levels, with one ‘major’ isoform being most expressed and alternative isoforms having lower expression. Ideally, analysis approaches should be able to account for this.maSigPro is an R package designed for the analysis of multiple time course transcriptomics data (Nueda et al., 2014). We present here Iso-maSigPro, a further adaptation of this method to study differential isoform usage in time course RNA-seq experiments. More elaborated motivation and details on the algorithm can be found in Supplementary Materials.
2 Methods
Following the generalized linear model (GLM) described in Nueda et al. (2014), for each multi-isoform gene two GLM models are created, identifying J isoforms with J − 1 binary variables (I1,…, ). The reference model, M0, considers there exist only constant differences between isoforms and the global gene model, M1, considers the possibility of a time versus condition versus isoform interaction. For instance, for a gene with two isoforms, two experimental conditions or series and linear effects:
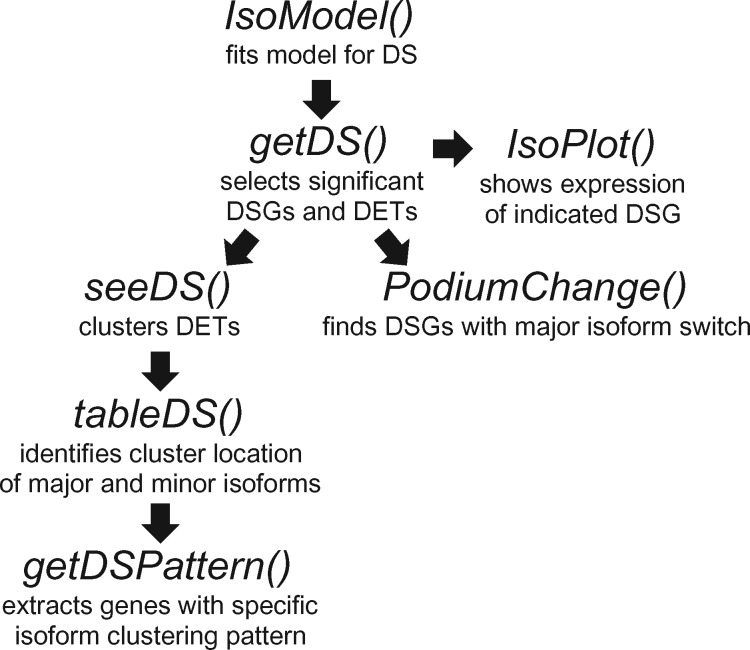
being g the ‘link function’ that characterizes the GLM, the expected value of isoform expression yij for observation i and isoform j, tij the time and the binary variable that identifies the experimental condition. The significance of the interaction is estimated based on log-likelihood ratio statistic of the two models (Supplementary Materials). Iso-maSigPro takes as input a transcript-level expression data frame including a column with gene assignments. Seven new functions enable analysis of differentially expressed isoforms (Fig. 1 and Supp. Materials):
Fig. 1.
Workflow for Iso-maSigPro analysis
IsoModel() implements the DS models M0 and M1 for each multi-isoform gene, using the polynomial model obtained with the generic make.design.matrix() maSigPro function that best describes the experimental design. The comparison of both models gives as a result a FDR-corrected P-value of differential splicing. Transcripts from significant DSGs are then subjected to regular Next-maSigPro analysis to detect differentially expressed transcripts (DETs).
IsoModel() returns a list of DSGs together with the estimated models of associated isoforms to be used as input in getDS() function to obtain a selection of DSGs at a pre-established level of goodness of fit.
seeDS() creates a clustering of all differential transcripts (regardless their genes) and tableDS() identifies the cluster assignment of major and secondary isoforms for each gene. Genes with specific profiles in their isoforms can be selected with the function getDSPattern() and visualized with IsoPlot()
PodiumChange() identifies DSGs with a switch of major isoform at the specified time points.
3 Results
Iso-maSigPro was applied to the analysis of a public RNA-seq dataset (GEO accession GSE75417) describing a mouse six time points B-cell differentiation course triggered by the expression of the transcription factor Ikaros. Transcripts were quantified with eXpress (Roberts and Pachter, 2013) to find a total of 34 156 transcripts belonging to 12 572 genes, of which 6882 genes are multi-isoform.
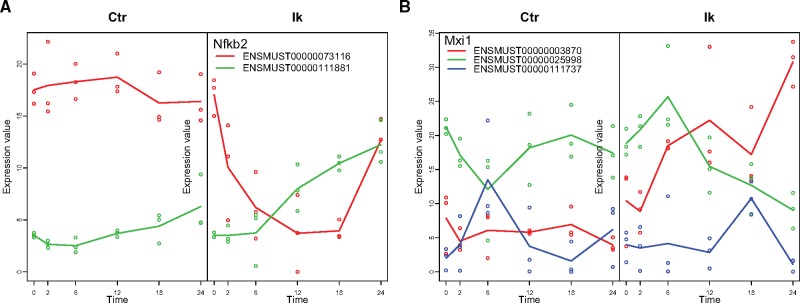
The IsoModel() function gave as overall result the selection of 347 DSGs containing a total of 1239 transcripts. Of these, 665 also had significant time course changes (DETs) (Supplementary Table S1). seeDS() grouped these 665 DETs into 6 clusters (Supplementary Fig. S1 and Table S2) and tableDS() identified the cluster assignment of major and minor forms to reveal that for most DSGs, differential isoforms did express similar trajectories (Supplementary Table S3). However, Iso-maSigPro functions facilitated the identification and visualization of genes with biologically interesting isoform expression changes. Figure 2A shows the expression of Nfkb2 identified with getDSPattern() as a DSG with significant transcripts in two different seeDS() clusters (major isoform in cluster 4 and minor isoform in cluster 1, respectively down and up regulation patterns after Ikaros induction). PodiumChange() helped to locate 37 genes with major isoform switches at the latest time points (Supplementary Table S4 and Fig. S2). Figure 2B shows an example of one such gene (Mxi1), transcriptional repressor involved in B-cell differentiation (see more in Supplementary Fig. S3).
Fig. 2.
IsoPlot() examples of the two major Iso-maSigPro DSG functionalities. (A) Nfkb2 has isoforms in cluster 1 and 4. (B) Mxi1 is a podium change gene. Ctr, Control, Ik, Ikaros
4 Discussion
The Iso-maSigPro set of functions updates the maSigPro framework to analyze isoform changes in time course transcriptomics data. We model differential isoform utilization as the interactions between the isoform, experimental condition and time, and evaluate significance with the log-likelihood ratio statistic of the models including or not this interaction. To extract biologically meaningful changes in relative isoform abundances, we introduced new clustering and querying functions. seeDS() and tableDS() help to find genes with substantial isoform profile differences in time, while PodiumChange() identifies those cases with a switch in the most expressed transcript. We showed examples where these functions helped to select genes with functionally relevant isoform changes. maSigPro is the first Bioconductor package with specific functions for the analysis of time course alternative isoform expression.
Funding
This work was supported by EU FP7 STATegra project agreement [306000]; and the Spanish Ministry of Economy and Competitiveness [BIO2012-40244 and BIO2015-71658-R].
Conflict of Interest: none declared.
Supplementary Material
References
- AlShareef S. et al. (2017) Herboxidiene triggers splicing repression and abiotic stress responses in plants. BMC Genomics, 18, 260. [DOI] [PMC free article] [PubMed] [Google Scholar]
- Huang Y., Sanguinetti G. (2016) Statistical modeling of isoform splicing dynamics from RNA-seq time series data. Bioinformatics, 32, 2965–2972. [DOI] [PubMed] [Google Scholar]
- Nueda M.J. et al. (2014) Next maSigPro: updating maSigPro bioconductor package for RNA-seq time series. Bioinformatics, 30, 2598–2602. [DOI] [PMC free article] [PubMed] [Google Scholar]
- Topa H., Honkela A. (2016) Analysis of differential splicing suggests different modes of short-term splicing regulation. Bioinformatics, 32, i147–i155. [DOI] [PMC free article] [PubMed] [Google Scholar]
- Vuong C.K. et al. (2016) The neurogenetics of alternative splicing. Nat. Rev. Neurosci., 17, 265–281. [DOI] [PMC free article] [PubMed] [Google Scholar]
- Roberts A., Pachter L. (2013) Streaming fragment assignment for real-time analysis of sequencing experiments. Nat. Methods, 10, 71–73. [DOI] [PMC free article] [PubMed] [Google Scholar]
Associated Data
This section collects any data citations, data availability statements, or supplementary materials included in this article.


