Abstract
Seasonal influenza epidemics occur year-round in the tropics, complicating the planning of vaccination programs. We built an individual-level longitudinal model of baseline antibody levels, time of infection, and the subsequent rise and decay of antibodies postinfection using influenza A(H1N1)pdm09 data from 2 sources in Singapore: 1) a noncommunity cohort with real-time polymerase chain reaction–confirmed infections and at least 1 serological sample collected from each participant between May and October 2009 (n = 118) and 2) a community cohort with up to 6 serological samples collected between May 2009 and October 2010 (n = 760). The model was hierarchical, to account for interval censoring and interindividual variation. Model parameters were estimated via a reversible jump Markov chain Monte Carlo algorithm using custom-designed R (https://www.r-project.org/) and C++ (https://isocpp.org/) code. After infection, antibody levels peaked at 4–7 weeks, with a half-life of 26.5 weeks, followed by a slower decrease up to 1 year to approximately preinfection levels. After the third wave, the seropositivity rate and the population-level antibody titer dropped to the same level as they were at the end of the first pandemic wave. The results of this analysis are consistent with the hypothesis that the population-level effect of individuals’ waxing and waning antibodies influences influenza seasonality in the tropics.
Keywords: influenza antibodies, influenza outbreaks, seasonality, statistical modeling, tropics, vaccination programs
In temperate and subtropical countries, influenza epidemics occur regularly during the cold winter months and the monsoon season, respectively (1). However, in tropical countries such as Singapore, influenza activity is much more irregular (2). This lack of seasonality on the equator may complicate the planning of vaccination programs in tropical countries, particularly selection of the best timing of vaccination campaigns (3).
Higher influenza antibody titers, usually measured by means of hemagglutination-inhibition (HAI) assays, are associated with protection against influenza infection (4). They fluctuate over time according to individuals’ exposures, increasing substantially due to infection/vaccination and then gradually waning (5). However, few studies have investigated people’s long-term antibody trajectories over multiple influenza waves and how this translates to population-level immunity—information which is important for planning influenza vaccination programs.
The 2009 influenza A(H1N1) pandemic afforded us an unusual opportunity to study the trajectory of immune response to influenza infection, as well as the link between herd immunity levels and the timing of influenza epidemics, because most people, especially children and young adults, did not have preexisting immunity against the new strain of influenza virus (6).
We developed a statistical model with which to characterize the evolution of antibody titers against influenza virus infection using a series of HAI assays collected over multiple influenza seasons in the community in Singapore, as well as supplementary real-time polymerase chain reaction (RT-PCR) data collected from various subpopulations. Conventionally, a 4-fold rise in antibody titers in paired serum samples is indicative of infection (7, 8), but this measure has low sensitivity (9). Therefore, we synthesized information from RT-PCR data in addition to repeated serological sampling to obtain information on the temporal evolution of HAI titers in the immediate aftermath of infection; we also estimated the risk of infection without the restriction of assuming a 4-fold rise. To do this, we developed a novel method that exploits a rich data set unobscured by the impact of seasonal forcing.
METHODS
Data
This analysis used serial serological samples obtained from 2 distinct cohorts in Singapore.
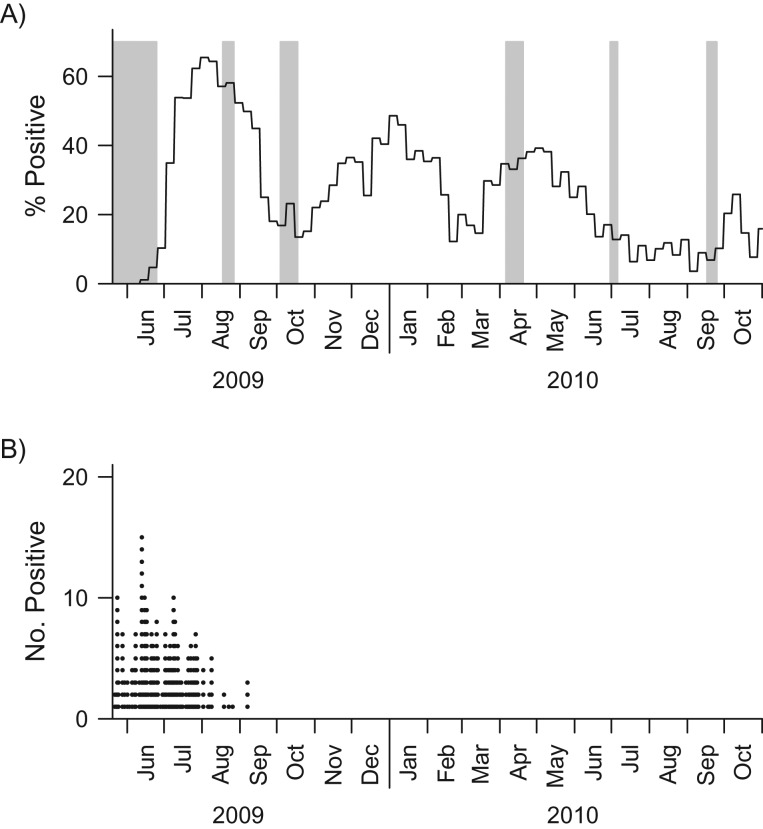
The primary data set involved a community cohort recruited from the Multi-Ethnic Cohort, a substudy of the Singapore Consortium of Cohort Studies, as described in detail elsewhere (10, 11). In total, 838 subjects aged 21–75 years were enrolled, of whom 760 (91%) with recorded serological data were analyzed (see Web Table 1, available at https://academic.oup.com/aje, for demographic data). Repeated serological samples were collected at up to 6 different time points from May 2009 to October 2010, spanning the H1N1 pandemic and subsequent waves (Figure 1A), as described in detail elsewhere (11). Each subject had at least 2 blood samples taken, and 430 (57%) of the 760 subjects had a full set of 6 blood samples.
Figure 1.
Blood collection period for the community cohort and distribution of the daily numbers of influenza A(H1N1)pdm09 cases detected in the real-time polymerase chain reaction (RT-PCR) cohort during the influenza A(H1N1)pdm09 outbreak in Singapore, 2009–2010. The gray bars in part A indicate the timing of serum samples taken from the community cohort. The solid black line in part A represents the weekly relative proportions of influenza A(H1N1)pdm09 infections obtained from routine primary care surveillance, which provides a reference for the size of the pandemic at the community level. There were 757, 624, 690, 679, 624, and 556 samples collected during waves 1–6, respectively. The black dots in part B give the daily numbers of A(H1N1)pdm09 cases identified in the RT-PCR cohort.
We supplemented this with a second RT-PCR cohort (n = 118) comprising hospitalized patients, health-care workers, military personnel, and staff and residents of a nursing home. These persons had both RT-PCR-confirmed infection and at least 1 serological sample (average = 2.3; range, 1–7) (12). This data set provided information on the temporal evolution of titers in the immediate aftermath of infection; times at which samples were taken (May–October 2009) are presented in Figure 1B.
Blood samples were assayed for HAI antibody titers against influenza A(H1N1)pdm09 infection. Written informed consent was obtained from all participants.
In addition, we used routine surveillance data from local sentinel health-care clinics that submitted weekly nasal and/or throat swab samples from cases of influenza-like illness. The samples were sent to the National Public Health Laboratory to confirm influenza infection. We analyzed samples that were positive for influenza A(H1N1)pdm09 among influenza-like illness cases, to validate whether modeled influenza incidence over time was consistent with community influenza surveillance.
Statistical analysis
Our primary objective was to model the trajectory of evolving influenza A(H1N1)pdm09 antibody titers, and the secondary objective was to estimate the time of infection for infected persons as a form of community influenza surveillance. An individual-level longitudinal model was built of baseline antibody levels, risk of infection, time of infection, and the subsequent rise and decay of antibodies postinfection. The model was hierarchical, to account for differences between individuals, and accounted for interval censoring of antibody titers. The antibody titer has values ranging from <1:10, 1:10, … to 1:20, … ≥1:1,280. To simplify the analysis, we coded the values as 1 for 1:10, 2 for 1:20, etc., and thus designated the intervals to be (1, 2), etc.—in other words, used a logarithmic scale. The titer at any time point was modeled via a Gaussian-distributed latent variable, , for individual at time point . The latent variable was then interval-censored in line with the recorded titer values. The mean titer, , varies by individual, time, and infection status. It is modeled to be constant at individual i’s baseline titer level, , if that individual is never infected. If the person is infected, a boosting term is added that is characterized by 5 parameters , where is the time of infection for individual , is the time of peak rise after infection, controls the steepness of the rise over time, and is the additional titer due to infection at the time of peak rise. The estimated mean titer, , at time for individual can therefore be expressed as
| (1) |
where is a gamma density with parameterization shape and scale , set to be functions of the mode and steepness parameters: and . The model was parameterized in this way to facilitate identifiability of the parameters by reducing their interdependency.
The risk and time of infection were modeled assuming a constant hazard of infection , so that the likelihood contribution was , where is the length of follow-up, for persons never infected and for those infected at time d. Because infection status was unknown for subjects in the community cohort, it was difficult to relate the time of infection to the early dynamics of antibody titers. We therefore supplemented the primary data with additional data from persons with RT-PCR-confirmed infection to obtain a better estimate of the initial trajectory following infection and thereby better estimates of the infection status and time of infection (if infected) of the community cohort. For those individuals, the (known) time of onset was not modeled, as the risk to these persons was not deemed to reflect the risk in the general community. The likelihood contribution from individual would therefore be the product of the likelihood function for the titer distribution and, for persons in the community cohort, the likelihood function for the time of infection. A complication of estimation is that the dimension of the parameter vector is not specified a priori but changes with infection status for each individual. For instance, if the infection status for individual were to switch from not infected to infected, the corresponding parameters would change from ( to . To facilitate changes in parameter dimension for persons with unknown infection status, we employed the reversible jump Markov chain Monte Carlo algorithm. This has the advantage of allowing changes in the dimension of the parameter vector as well as the parameter values by simulating from their posterior distributions (13). The algorithm used is described in Web Appendix 1, including the prior distribution, the reversible jump Markov chain Monte Carlo algorithm, and validation of the approach. Point estimates are posterior mean values, and uncertainty intervals are 95% credible intervals.
Epidemic simulation
To assess the consistency of our analysis and our hypothesis that the waning of herd immunity levels is associated with the timing of influenza epidemics in the tropics, we performed a simple simulation using a susceptible-infected-susceptible model in which individuals could move back and forth between the susceptible state and the infected state. A description of the model appears in Web Appendix 2. This model makes a series of additional assumptions beyond those of the preceding analysis—most importantly that the risk of reinfection depends linearly on log HAI titers (estimates derived from Zhao et al. (4)) and uses plausible but arbitrary values of the baseline infection and importation risks.
All statistical analyses were implemented in R, version 3.1.2 (R Foundation for Statistical Computing, Vienna, Austria). To overcome speed issues in R, we executed functions in the C++ language using the Rcpp and RcppArmadillo extensions (14, 15). All codes are available on GitHub (GitHub, Inc., San Francisco, California) at https://github.com/zxiahong/titre-trajectory-aje.
RESULTS
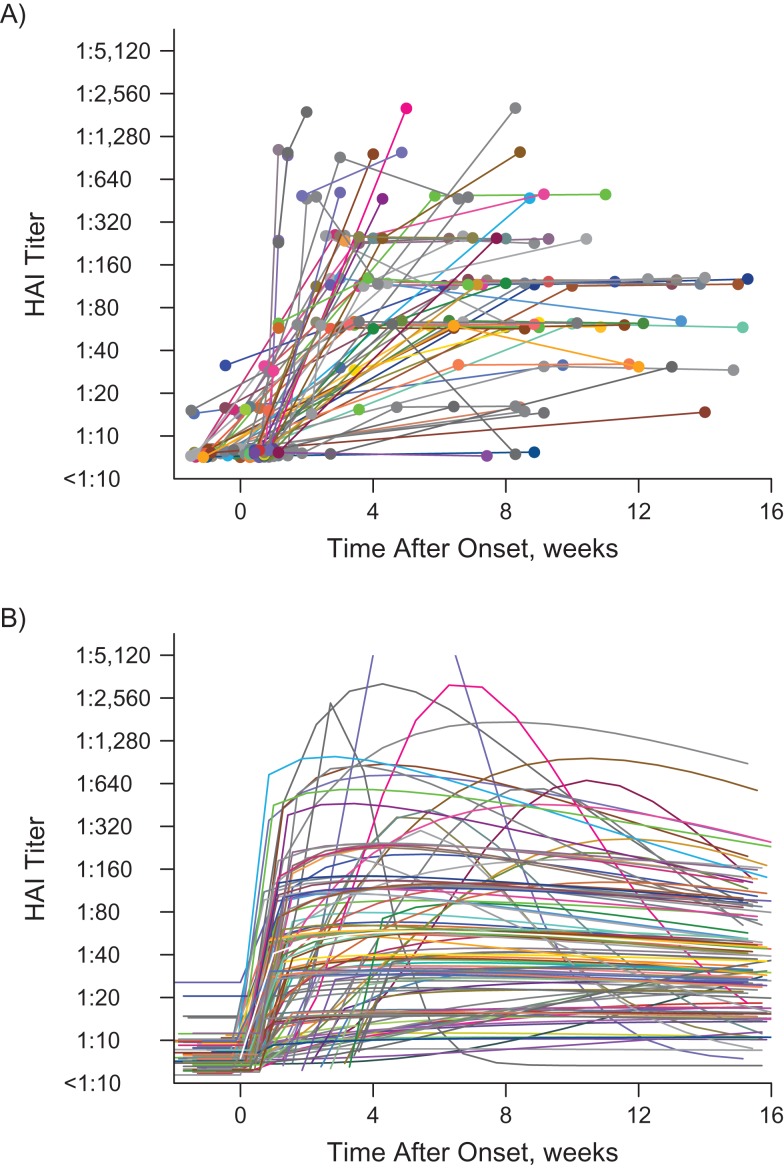
A summary of preinfection titer distributions for the community cohort and the RT-PCR cohort is shown in Web Table 2. The two cohorts had similar preinfection titer distributions (P = 0.15). For RT-PCR cases, we had data with which to define the cases’ infection status and time of disease onset (as opposed to the community cohort, where these parameters had to be inferred from the model). On average, we found that the antibody titers rose quickly to (1:40, 1:80) 1 week after onset of disease, peaked around 4 weeks after onset, and then gradually tapered off (Figure 2).
Figure 2.
Observed repeated hemagglutination-inhibition (HAI) antibody titers (A) versus modeled HAI antibody titer trajectories (B) for the real-time polymerase chain reaction (RT-PCR) cohort (n = 118) from the influenza A(H1N1)pdm09 outbreak in Singapore, 2009–2010. Subjects in the RT-PCR cohort are represented by different colors. In part A, the colored dots represent the antibody titers observed over time, along with lines connecting dots from the same individual. In part B, each colored line represents the modeled titer trajectory over time for each individual. The white line shows the estimated mean titer trajectory for infected persons, with the black shaded area representing the 95% credible interval for the estimated mean titer; the narrowness of the shaded area reflects the large sample size.
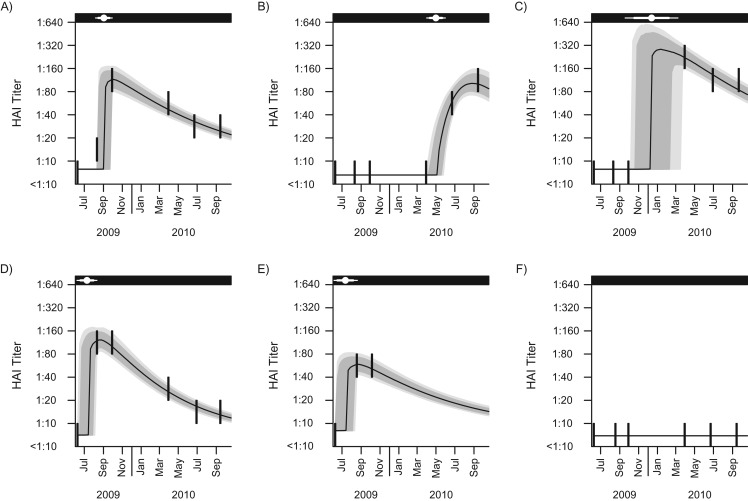
The modeled titer trajectories (with 95% credible intervals), as well as the observed titer levels of 6 selected individuals from the community cohort who seroconverted during the study period, are displayed in Figure 3 (fits for all persons from both cohorts are presented in the Web Video). In almost all cases, the modeled antibody levels pass through or near the titer data, with a shape that reflects the evolution in the observed data closely. The times of infection, with 80% and 95% credible intervals, were estimated. The width of the uncertainty time window ranged from a few weeks for persons whose infection fell around the time of serological sampling to 1 year for those whose infection probably fell between 2 widely spaced serum samples. In simulations, there was good concordance between the parameter estimates derived from simulated data and the parameters used to generate the simulated data (Web Table 3).
Figure 3.
Observed and modeled hemagglutination-inhibition (HAI) antibody titers over time and estimated time of infection for 6 subjects selected from the community cohort for the influenza A(H1N1)pdm09 outbreak in Singapore, 2009–2010. Six subjects were arbitrarily selected from the community cohort to show the goodness of fit of the developed hierarchical model. More than half of the participants in the community cohort had 6 blood samples collected. Parts A–D represent model-fitting for persons with 6 repeated blood samples collected but with different times of infection relative to the time of blood sampling. Part E shows an example of an individual who contributed fewer than 6 blood samples. Part F shows an example of persons estimated not to have been infected during the study period: The majority of participants in the community cohort had similar titer trajectories as the participant shown in part F. The thick vertical lines in each panel represent the repeated measured antibody titers over the censored intervals. The black line represents the modeled median antibody titers over time. The gray and light gray shaded areas represent the 80% and 95% credible intervals (CrIs) for the modeled antibody titer trajectories, respectively. In the black strip at the top of each graph, the white point represents the estimated time of infection, and the thick horizontal whiskers and thin horizontal whiskers show the 80% CrI and 95% CrI for the times of infection, respectively.
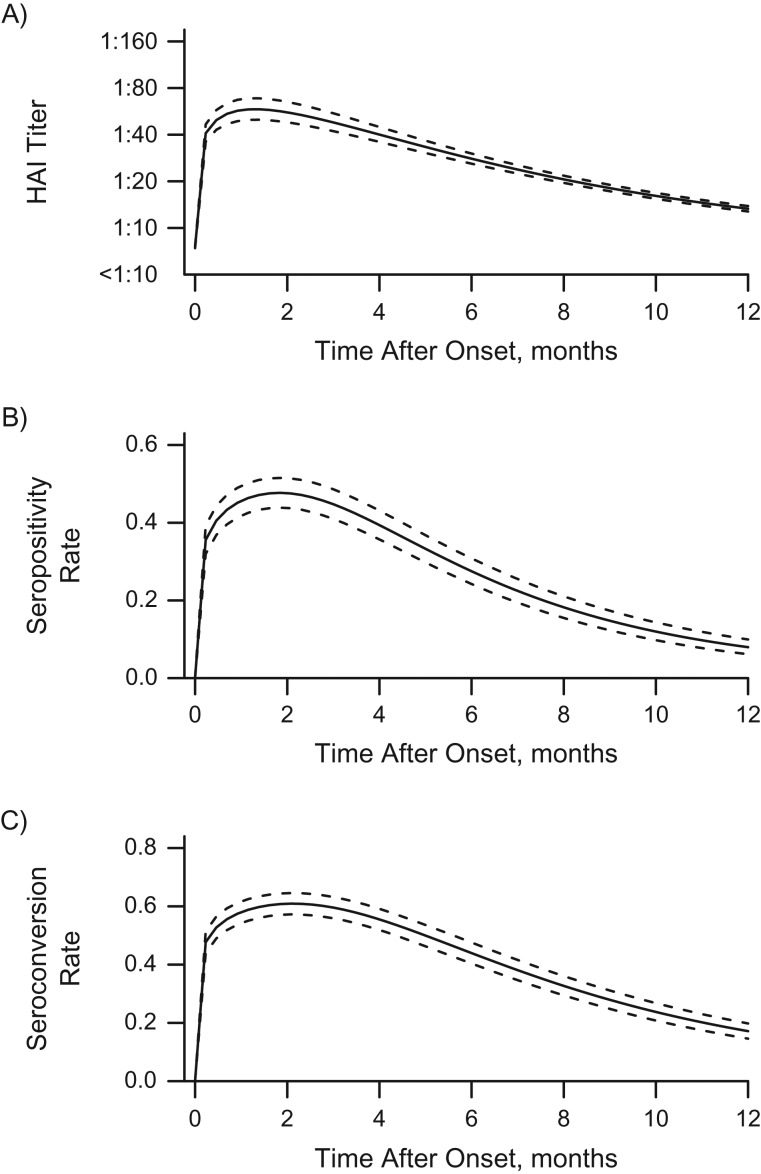
Figure 4 presents individual-level dynamics for the titer trajectory, the seropositivity rates, and the seroconversion rates over time postonset (in months) for hypothetical individuals with no prior immunity against influenza A(H1N1)pdm09 infection. On average, the antibody titers peaked at 6.8 weeks (95% credible interval: 6.0, 7.0) after infection, with an estimated half-life of 26.5 weeks (95% credible interval: 24.0, 29.0), and then decreased almost to baseline antibody levels after 12 months postinfection. (The posterior distributions of antibody titers over time are presented in the Web Results.) The seropositivity and seroconversion rates were derived directly from the fitted model and peaked at approximately 50% and 60%, respectively. These rates may provide guidance for the timing of serological tests designed to estimate epidemic size. This suggests that about 1 in 2 infections would be missed on the basis of traditional metrics. For the community cohort, age and sex were not associated with peak antibody titers, as indicated by the low correlations with posterior mean peak levels (0.05 (using Pearson’s correlation test, P = 0.49) and −0.01 (P = 0.93), respectively). Older adults had a shorter half-life of antibody titers against influenza infection (correlation: −0.18; P = 0.01); however, no difference between males and females was observed (correlation: −0.11; P = 0.11).
Figure 4.
Individual-level dynamics for the modeled hemagglutination-inhibition (HAI) antibody titer trajectory (A), the probability of having titers greater than or equal to 1:40 (B), and the probability of seroconversion (C) over time during the influenza A(H1N1)pdm09 outbreak in Singapore, 2009–2010. The solid lines represent the estimated mean values, and the dashed lines represent the 95% credible intervals. In part A, the uncertainty interval bounded by the dashed lines is the 95% credible interval for the estimated mean titer.
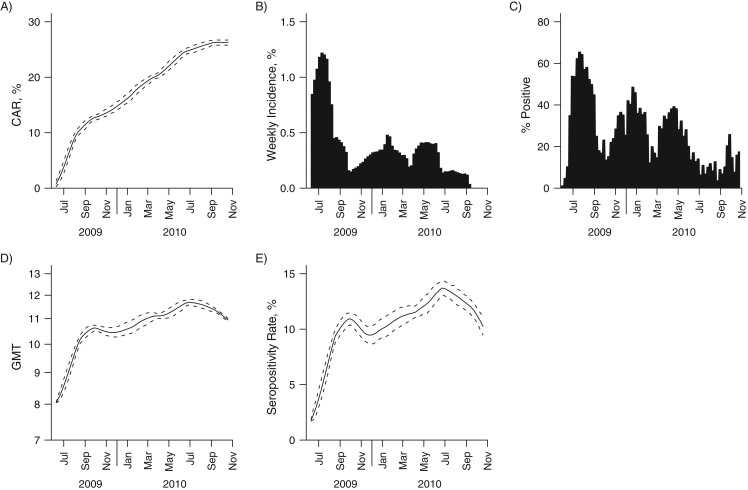
The population-level dynamics of immunity were also estimated from the model. The modeled cumulative attack rate increased rapidly during each of the first 3 waves (Figure 5, part A; overall and age-stratified cumulative attack rates are shown in Web Table 4). The corresponding modeled weekly incidence exhibited patterns similar to the relative proportion of influenza A(H1N1)pdm09 in the community (Figure 5, parts B and C), which was not used in the model-building process. Unlike the cumulative attack rate, which increased over time, the antibody titer and seropositivity rate remained flat after the first wave. By the end of the study period, the antibody levels and seropositivity rate had decreased almost to the level seen just after the first wave (Figure 5, parts D and E). The next wave of influenza A(H1N1-2009pdm) occurred in January 2011 (16), by which time the population-level measures of immunity should have dropped below this level.
Figure 5.
Population-level dynamics for the cumulative attack rate (CAR) (A), the modeled (B) and observed (C) incidence of influenza A(H1N1)pdm09, the geometric mean titer (GMT) (D), and the seropositivity rate (E) over time during the influenza A(H1N1)pdm09 outbreak in Singapore, 2009–2010. For parts A, D, and E, the solid line represents the estimated mean value and the dashed line represents the 95% credible interval. Part B illustrates the modeled incidence of influenza A(H1N1)pdm09 infection, and part C illustrates the observed relative proportions of influenza A(H1N1)pdm09 infections among influenza-like illness samples obtained from routine primary care surveillance.
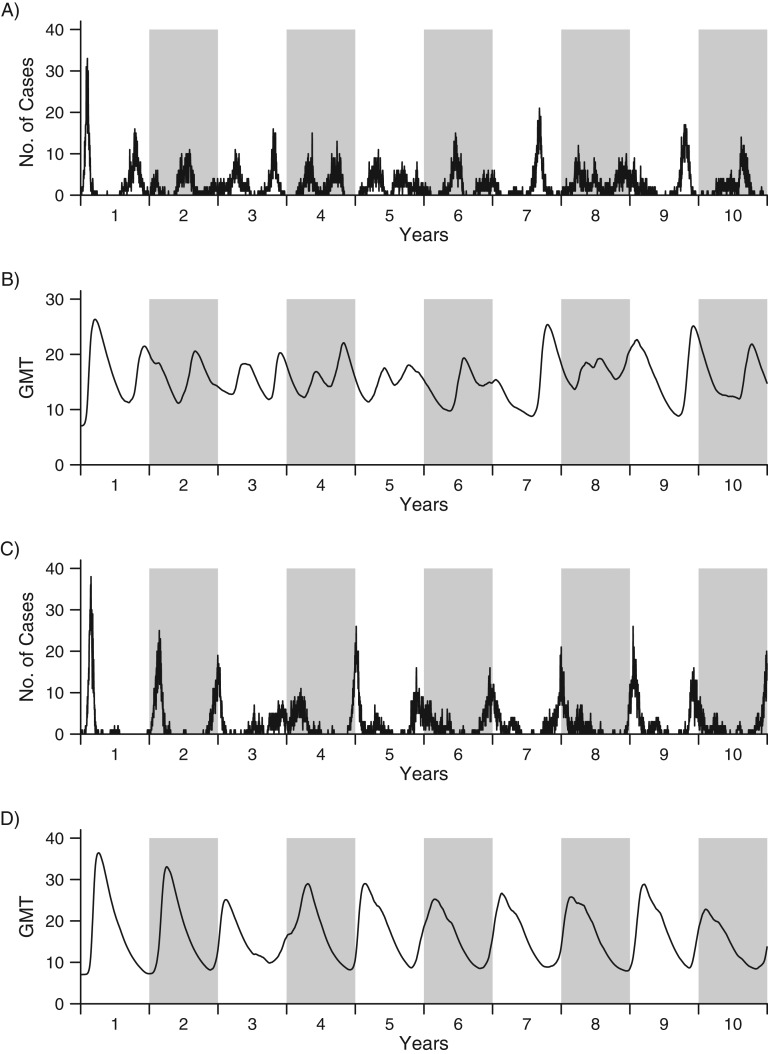
In simulations, the epidemic pattern observed at the beginning of the simulation period was qualitatively similar to the epidemic patterns in Singapore (Figure 6), but it differed from those of the immediate aftermath of the pandemic. Simulations yielded yearly epidemics, but the timing of epidemics was irregular. We found good synchronization between simulated population-level geometric mean titers and influenza epidemics over time. This agrees with the hypothesis of waning immunity being associated with the timing of epidemics in the tropics, where there is an absence of seasonal forcing (Figure 6, parts A and B). If we added in a small amount of seasonal forcing (i.e., if the risk of infection went up and down by 20% over the course of 1 year), the simulated antibody levels synchronized epidemics to winter seasons (Figure 6, parts C and D). This is consistent with the influenza epidemic patterns in the temperate regions of the Northern and Southern hemispheres.
Figure 6.
Simulated numbers of influenza cases (parts A and C) and population-level geometric mean titers (GMTs) (parts B and D), with (A and B) and without (C and D) seasonal forcing, for the influenza A(H1N1)pdm09 outbreak in Singapore, 2009–2010. The line in each graph shows the simulated number of cases or GMTs over a period of 10 years. (White backgrounds show odd years; gray backgrounds show even years.) The simulation was carried out in a hypothetical population with a size of 1,000, and we assumed that each individual started with no or little immunity against influenza. Parts A and B show the scenario in which there is no seasonal forcing (i.e., γ = 0), while parts C and D show the scenario in which there is seasonal forcing of 20% in the community (i.e., γ = 0.2).
DISCUSSION
In this paper, we undertook a Bayesian approach to establish the time of infection and the evolution of influenza antibody titers at both the individual and population levels. Bayesian evidence synthesis is becoming more widespread in public health (17, 18), because it provides a flexible framework with which to integrate various types of information. Moreover, Bayesian approaches are valuable for longitudinal seroepidemiologic studies, as they provide a natural and efficient mechanism for accounting for between-individual variability.
Previous research has shown that delayed collection of blood samples might lead to underascertainment of influenza infections (8). A straightforward approach to accounting for the timing of serological samples was to use a suitable proxy for influenza levels in the community, such as extraction of the rate of influenza-like illness from an influenza surveillance program (4). Taking the current approach, however, meant it was not necessary to include the proxy measurements of influenza incidence in the community to estimate the time of infection, as the large number of study participants and the frequencies of blood samples collected from each participant provided sufficient information to establish incidence at the individual level and to reproduce the timings of the first 3 waves as observed with the traditional surveillance well (Figure 5, parts B and C). The results of sensitivity analysis using a model with a fluctuating hazard of infection are shown in Web Figure 1; similar results were obtained.
The model developed in this paper was based on data from the first influenza pandemic wave and 2 subsequent waves due to a new strain of influenza virus. The majority of participants would have had no or little immunity against the new pandemic strain, so we assumed a homogeneous risk of infection for all members of the community cohort. In contrast, the general population would have had a broad range of baseline antibody titers at the beginning of a seasonal influenza epidemic, which would necessitate adaptation of the model to include the starting titer as a model feature and allow the risk of infection to change depending on the starting titer.
To model titer trajectories immediately upon infection, we combined the RT-PCR cohort data with community cohort data. The RT-PCR assay is likely to have had an atypically high sensitivity in the current study, because the RT-PCR cohort was drawn from 3 populations under active surveillance during the early phase of the pandemic (health-care workers, armed forces personnel, and residents of long-term care homes). Because these populations experienced different risks of infection (10), the RT-PCR cohort was not assumed to have the same risk of infection as the community cohort, but we did assume that the two cohorts had similar titer responses after infection. Although there was a risk that the RT-PCR cohort would have more symptomatic individuals who might have experienced a different titer trajectory from persons with no symptoms or milder symptoms, we found that the preinfection titer distributions for the two cohorts were comparable (P = 0.15) and there was no significant difference in peak titers between the two cohorts (P = 0.11). Therefore, the RT-PCR cohort should have represented the community cohort well in terms of antibody response before and after infection.
The finding that antibody titers peak 6–7 weeks after infection and drop rapidly within the first 6 months after infection is consistent with results from previous studies (5, 9, 19–23). However, different opinions exist as to the time interval for the half-life of antibody titers (24, 25) (see Web Appendix 3 for more details).
We found a significant association only between age and antibody half-life postinfection—elderly persons had significantly shorter half-lives of antibody titers. Sex, in contrast, was not a significant confounding factor that influenced antibody response postinfection. These findings are consistent with a previous, simpler analysis in which Hsu et al. (5) found a faster rate of decrease in antibody titers in the older age group, but no significant difference was observed for sex groups.
We found a rapid rise in population antibody levels and infections during the first wave of the influenza pandemic in Singapore. However, while numbers of infections rose in both wave 2 and wave 3, population antibody levels reached a near-plateau that lasted throughout the subsequent epidemic waves. The slight sawtooth pattern in antibody levels and the seropositivity rate during waves 2 and 3 might explain the reoccurrence of influenza epidemics in a setting like Singapore, where seasonal forcing is not present to synchronize epidemics to a particular season. Individual-level simulations built upon the model provided theoretical support for this hypothesis. In this paper, we have postulated that changes in population-level immunity levels resulting from the aggregation of individual antibody trajectories, as measured by HAI titers, may plausibly be associated with the timing of influenza epidemics in the tropics (26, 27). Other mechanisms for immunity, including high levels of cross-reactive cellular responses from seasonal influenza infections or boosted cross-reactive antibodies (28–30) and other hypothesized mechanisms, such as antigenic changes in the virus, fluctuations in precipitation (31) between monsoon and nonmonsoon time periods, importations from seasonal outbreaks in the Northern and Southern hemispheres (2, 3), or randomness alone (32), may also suffice to explain the timing of subsequent waves of the 2009 pandemic and the irregular timing of seasonal epidemics in aseasonal settings. Further work to validate these findings and assess the importance of this mechanism relative to others, such as antigenic drift in the tropics, would be valuable.
Our model suggests that seropositivity and seroconversion peak at 50% and 60%, respectively, after the onset of influenza infection. Both of these values are lower (by 10%–20%) than what has been observed in other studies (5). The difference may result from the criterion used to define influenza infection—that is, a 4-fold rise in antibody titers between successive blood samples. This might underestimate the total number of infections, because some infections may be limited to a 2-fold rise (9). The model developed here, however, is not limited by the use of a 4-fold rise in order to confirm infection. As a result, the denominators for calculating the seropositivity and seroconversion rates are higher, as more people are inferred to be infected, lowering the estimates accordingly.
There were some limitations in this study. The model developed here depends on the availability of RT-PCR data for a subset of participants, which could be costly and logistically challenging, though when taking the same approach as we did, the confirmed cases need not be from the same population as the serological data. The uncertainty intervals for the estimated time of infection depend on the time window between blood samples (Web Table 5). For some persons, the uncertainty interval for the estimated time of infection is wide (e.g., see Figure 3C), a reflection of the fairly wide time window between the timings of the third and fourth blood samples in our study. Future studies might target slightly more frequent serum sampling around epidemic waves. The model was developed on the basis of data from the first 3 epidemic waves of a new influenza strain (influenza A(H1N1)pdm09), and as a result, it is not clear to what extent the findings apply to seasonal influenza infections and after multiple waves of infections with the pandemic H1N1 strain. Only the primary antibody response was studied, and the effect on antibody titers from reinfections was not considered, as the number of persons with apparent repeat infections in the cohort was too small to estimate risks of reinfection (n = 3 with 4-fold rises between successive intervals). The model was limited to persons who started without a recent infection, because we assumed a single infection for all individuals and the time of infection was restricted to be after the time when the first imported case was diagnosed in Singapore.
One application of our model is to advise health officials and researchers on the timing of serological sampling relative to the start of an outbreak. Once a person was infected with influenza, it would take a few weeks for antibody titers to increase to the level that was detectable—that is, titers ≥1:40 for a cross-sectional study or a ≥4-fold rise in antibody titers for a longitudinal study. Therefore, the optimal timing of the serological sample for capturing seroconversion during the epidemic is during the period in which the probability of titers ≥1:40 or the probability of seroconversion peaks—that is, 5–8 weeks after infection. The time window of detectable seroconversion estimated for H1N1 influenza and the time window of the half-life of antibody levels estimated in this paper provide reference points for estimating the period in which a population may be vulnerable to the start of a new domestic outbreak (particularly in tropical settings, where seasonal forcing is weak) and hence determining when to implement influenza vaccination among people who are believed to be at risk.
Supplementary Material
ACKNOWLEDGMENTS
Author affiliations: Saw Swee Hock School of Public Health, National University of Singapore and National University Health System, Singapore (Xiahong Zhao, Mark I-Cheng Chen, Alex R. Cook); Department of Surgery, Yong Loo Lin School of Medicine, National University of Singapore and National University Health System, Singapore (Yilin Ning); Graduate School for Integrative Sciences and Engineering, National University of Singapore, Singapore (Yilin Ning); and Department of Clinical Epidemiology, Institute of Infectious Diseases and Epidemiology, Tan Tock Seng Hospital, Singapore (Mark I-Cheng Chen).
We acknowledge funding from the Centre for Infectious Diseases Epidemiology and Research, Saw Swee Hock School of Public Health, National University of Singapore; the Singapore Ministry of Health (grant CDPHRG/0009/2014); the Singapore Ministry of Education (Tier 1 grant); and the National Medical Research Council of Singapore (grant PPG10-09).
We thank Dr. Barnaby Edward Young for helpful discussion and critical comments.
Conflict of interest: none declared.
Abbreviations
- HAI
hemagglutination-inhibition
- RT-PCR
real-time polymerase chain reaction
REFERENCES
- 1. Simonsen L. The global impact of influenza on morbidity and mortality. Vaccine. 1999;17(suppl 1):S3–S10. [DOI] [PubMed] [Google Scholar]
- 2. Viboud C, Alonso WJ, Simonsen L. Influenza in tropical regions. PLoS Med. 2006;3(4):e89. [DOI] [PMC free article] [PubMed] [Google Scholar]
- 3. Saha S, Chadha M, Al Mamun A, et al. . Influenza seasonality and vaccination timing in tropical and subtropical areas of southern and south-eastern Asia. Bull World Health Organ. 2014;92(5):318–330. [DOI] [PMC free article] [PubMed] [Google Scholar]
- 4. Zhao X, Fang VJ, Ohmit SE, et al. . Quantifying protection against influenza virus infection measured by hemagglutination-inhibition assays in vaccine trials. Epidemiology. 2016;27(1):143–151. [DOI] [PMC free article] [PubMed] [Google Scholar]
- 5. Hsu JP, Zhao X, Chen MI, et al. . Rate of decline of antibody titers to pandemic influenza A (H1N1-2009) by hemagglutination inhibition and virus microneutralization assays in a cohort of seroconverting adults in Singapore. BMC Infect Dis. 2014;14:414. [DOI] [PMC free article] [PubMed] [Google Scholar]
- 6. Hancock K, Veguilla V, Lu X, et al. . Cross-reactive antibody responses to the 2009 pandemic H1N1 influenza virus. N Engl J Med. 2009;361(20):1945–1952. [DOI] [PubMed] [Google Scholar]
- 7. Lee VJ, Chen MI, Yap J, et al. . Comparability of different methods for estimating influenza infection rates over a single epidemic wave. Am J Epidemiol. 2011;174(4):468–478. [DOI] [PMC free article] [PubMed] [Google Scholar]
- 8. Tsang TK, Fang VJ, Perera RA, et al. . Interpreting seroepidemiologic studies of influenza in a context of nonbracketing sera. Epidemiology. 2016;27(1):152–158. [DOI] [PMC free article] [PubMed] [Google Scholar]
- 9. Cauchemez S, Horby P, Fox A, et al. . Influenza infection rates, measurement errors and the interpretation of paired serology. PLoS Pathog. 2012;8(12):e1003061. [DOI] [PMC free article] [PubMed] [Google Scholar]
- 10. Chen MI, Lee VJ, Lim WY, et al. . 2009 influenza A(H1N1) seroconversion rates and risk factors among distinct adult cohorts in Singapore. JAMA. 2010;303(14):1383–1391. [DOI] [PubMed] [Google Scholar]
- 11. Chen MI, Cook AR, Lim WY, et al. . Factors influencing infection by pandemic influenza A(H1N1)pdm09 over three epidemic waves in Singapore. Influenza Other Respir Viruses. 2013;7(6):1380–1389. [DOI] [PMC free article] [PubMed] [Google Scholar]
- 12. Chen MI, Barr IG, Koh GC, et al. . Serological response in RT-PCR confirmed H1N1-2009 influenza A by hemagglutination inhibition and virus neutralization assays: an observational study. PLoS One. 2010;5(8):e12474. [DOI] [PMC free article] [PubMed] [Google Scholar]
- 13. Hastie DI, Green PJ. Model choice using reversible jump Markov chain Monte Carlo. Stat Neerl. 2012;66(3):309–338. [Google Scholar]
- 14. Eddelbuettel D, Francois R. Rcpp: seamless R and C++ integration. J Stat Softw. 2011;40(8):1–18. [Google Scholar]
- 15. Eddelbuettel D, Sanderson C. RcppArmadillo: accelerating R with high-performance C++ linear algebra. Comput Stat Data Anal. 2014;71:1054–1063. [Google Scholar]
- 16. Ho HP, Zhao X, Pang J, et al. . Effectiveness of seasonal influenza vaccinations against laboratory-confirmed influenza-associated infections among Singapore military personnel in 2010–2013. Influenza Other Respir Viruses. 2014;8(5):557–566. [DOI] [PMC free article] [PubMed] [Google Scholar]
- 17. Presanis AM, De Angelis D, Hagy A, et al. . The severity of pandemic H1N1 influenza in the United States, from April to July 2009: a Bayesian analysis. PLoS Med. 2009;6(12):e1000207. [DOI] [PMC free article] [PubMed] [Google Scholar]
- 18. Baguelin M, Flasche S, Camacho A, et al. . Assessing optimal target populations for influenza vaccination programmes: an evidence synthesis and modelling study. PLoS Med. 2013;10(10):e1001527. [DOI] [PMC free article] [PubMed] [Google Scholar]
- 19. Couch RB, Kasel JA. Immunity to influenza in man. Annu Rev Microbiol. 1983;37:529–549. [DOI] [PubMed] [Google Scholar]
- 20. Skowronski DM, Tweed SA, De Serres G. Rapid decline of influenza vaccine-induced antibody in the elderly: is it real, or is it relevant? J Infect Dis. 2008;197(4):490–502. [DOI] [PubMed] [Google Scholar]
- 21. Rastogi S, Gross PA, Bonelli J, et al. . Time to peak serum antibody response to influenza vaccine. Clin Diagn Lab Immunol. 1995;2(1):120–121. [DOI] [PMC free article] [PubMed] [Google Scholar]
- 22. Wright PF, Sannella E, Shi JR, et al. . Antibody responses after inactivated influenza vaccine in young children. Pediatr Infect Dis J. 2008;27(11):1004–1008. [DOI] [PMC free article] [PubMed] [Google Scholar]
- 23. Sacadura-Leite E, Sousa-Uva A, Rebelo-de-Andrade H. Antibody response to the influenza vaccine in healthcare workers. Vaccine. 2012;30(2):436–441. [DOI] [PubMed] [Google Scholar]
- 24. Horsfall FL, Rickard ER. Neutralizing antibodies in human serum after influenza A: the lack of strain specificity in the immunological response. J Exp Med. 1941;74(5):433–439. [DOI] [PMC free article] [PubMed] [Google Scholar]
- 25. Song JY, Cheong HJ, Hwang IS, et al. . Long-term immunogenicity of influenza vaccine among the elderly: risk factors for poor immune response and persistence. Vaccine. 2010;28(23):3929–3935. [DOI] [PubMed] [Google Scholar]
- 26. Patriarca PA, Weber JA, Parker RA, et al. . Risk factors for outbreaks of influenza in nursing homes. A case-control study. Am J Epidemiol. 1986;124(1):114–119. [DOI] [PubMed] [Google Scholar]
- 27. Mathews JD, Chesson JM, McCaw JM, et al. . Understanding influenza transmission, immunity and pandemic threats. Influenza Other Respir Viruses. 2009;3(4):143–149. [DOI] [PMC free article] [PubMed] [Google Scholar]
- 28. Li Y, Myers JL, Bostick DL, et al. . Immune history shapes specificity of pandemic H1N1 influenza antibody responses. J Exp Med. 2013;210(8):1493–1500. [DOI] [PMC free article] [PubMed] [Google Scholar]
- 29. Andrews SF, Huang Y, Kaur K, et al. . Immune history profoundly affects broadly protective B cell responses to influenza. Sci Transl Med. 2015;7(316):316ra192. [DOI] [PMC free article] [PubMed] [Google Scholar]
- 30. Linderman SL, Chambers BS, Zost SJ, et al. . Potential antigenic explanation for atypical H1N1 infections among middle-aged adults during the 2013–2014 influenza season. Proc Natl Acad Sci USA. 2014;111(44):15798–15803. [DOI] [PMC free article] [PubMed] [Google Scholar]
- 31. Tamerius JD, Shaman J, Alonso WJ, et al. . Environmental predictors of seasonal influenza epidemics across temperate and tropical climates. PLoS Pathog. 2013;9(3):e1003194. [DOI] [PMC free article] [PubMed] [Google Scholar]
- 32. Chen Y, Cook AR, Lim AX. Randomness of dengue outbreaks on the equator. Emerg Infect Dis. 2015;21(9):1651–1653. [DOI] [PMC free article] [PubMed] [Google Scholar]
Associated Data
This section collects any data citations, data availability statements, or supplementary materials included in this article.


