

Abstract
Summary
Statistical tools for biological data analysis are often evaluated using synthetic data, designed to mimic the features of a specific type of experimental data. The generalizability of such evaluations depends on how well the synthetic data reproduce the main characteristics of the experimental data, and we argue that an assessment of this similarity should accompany any synthetic dataset used for method evaluation. We describe countsimQC, which provides a straightforward way to generate a stand-alone report that shows the main characteristics of (e.g. RNA-seq) count data and can be provided alongside a publication as verification of the appropriateness of any utilized synthetic data.
Availability and implementation
countsimQC is implemented as an R package (for R versions ≥ 3.4) and is available from https://github.com/csoneson/countsimQC under a GPL (≥2) license.
1 Introduction
The analysis of biological data, for example those coming from high-throughput sequencing applications, is often highly dependent on sophisticated statistical tools and algorithms. Each such tool aims to extract a specific type of biologically relevant information from data, and its ability to perform the intended task is usually evaluated at the time of publication. Although the ultimate aim is to develop methods that give accurate results for real, experimental data, this is often difficult to assess in practice due to the lack of an independently validated ground truth. Thus, most statistical data analysis tools are (at least partly) evaluated on synthetic data, obtained either via parametric simulation or via sampling from experimental data. The synthetic data are assumed to share important characteristics with experimental data, but the signal of interest as well as other, potentially confounding, signals are completely controlled in the data generation. In such cases, the usefulness of any performance evaluation ultimately comes down to how realistic the synthetic data are. Thus, we argue that any evaluation relying on synthetic datasets should take care to verify that these reflect the most important characteristics of the data type of interest. Currently, many studies whose conclusions crucially depend on synthetic data do not provide extensive evidence of such similarity. We hypothesize that one reason for this is a lack of general guidelines regarding the set of aspects that should be investigated, as well as a straightforward way to easily generate a quality evaluation report for synthetic data, which exists for other aspects of high-throughput sequencing data analysis [e.g. FastQC (http://www.bioinformatics.babraham.ac.uk/projects/fastqc/), MultiQC (Ewels et al., 2016)].
To fill this gap, we developed countsimQC, an R package that allows the user to quickly explore and compare a variety of characteristics across one or more count datasets and generate a summary report for evaluation and dissemination. For example, a user can visualize the characteristics of a synthetic dataset (e.g. a simulated RNA-seq count matrix) side by side with those of an experimental dataset of the type that it is intended to mimic. However, the package is not limited to such comparisons, and can be used to summarize and compare the properties of any collection of one or more count datasets.
2 Materials and methods
To run countsimQC, the user provides a count matrix and information about the experimental design for each dataset. The software then calculates a set of characteristics for each dataset and generates a stand-alone pdf or html report, which can be used to assess the properties of, and similarities between, the provided datasets. The evaluation criteria have been specifically selected to cover a broad range of important aspects of RNA-seq data and include the mean-dispersion relationship, library size distribution, expression distribution, and the fraction of zero counts per gene and sample as well as the relationship between these and a gene’s expression level or the total number of reads in a sample. The latter type of evaluation criteria is particularly useful for single-cell RNA-seq applications and other types of sparse count data. In addition to the graphical output, the countsimQC reports also contain a range of quantitative evaluation criteria comparing the distributions of the calculated statistics between datasets. The package is modular, and new evaluation criteria can easily be added by the user if desired. Moreover, the principles of countsimQC are not limited to count data, and given suitable quality assessment criteria the package can easily be extended to generate reports appropriate also for other data types.
3 Results
To illustrate the output generated by countsimQC, we use two recently published R packages [the ’splat’ framework from splatter (v1.0.2) (Zappia et al., 2017) and powsim (v1.0.1) (Vieth et al., 2017)] to generate synthetic single-cell RNA-seq count matrices from an underlying, experimentally obtained count matrix [GSE48968-GPL13112 (Shalek et al., 2014)], downloaded from the conquer repository [http://imlspenticton.uzh.ch:3838/conquer/ (Soneson and Robinson, 2017)]. Figure 1 shows a subset of the figures that are included in the countsimQC report. From these plots, it is clear that a single evaluation criterion is not enough to fully capture the degree of similarity between datasets, and that the simulation that is most similar to the underlying real data in one aspect can be far from it when another criterion is considered. Thus, having a comprehensive report illustrating the level of similarity from different aspects is useful not only for the synthetic data generator but also for the reader interested in judging the degree of generalizability of conclusions based on the synthetic data. The full report of the comparison summarized in Figure 1, as well as additional example reports for various types of real and synthetic count datasets can be accessed from https://github.com/csoneson/countsimQC.
Fig. 1.
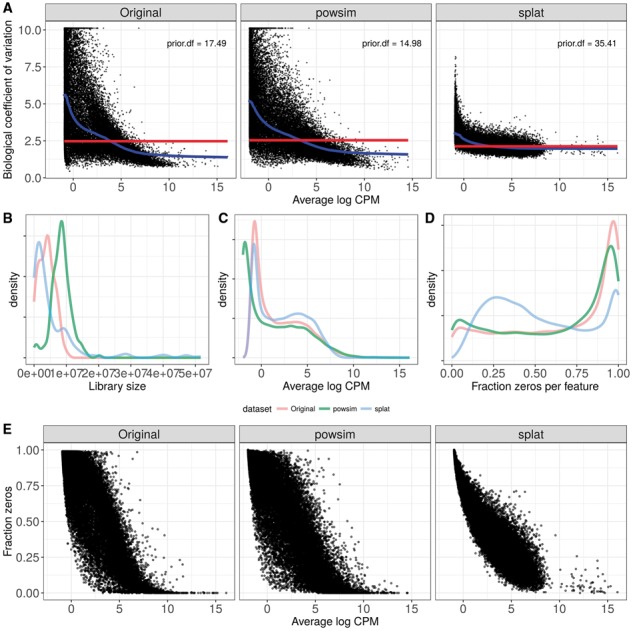
Example illustrations from a countsimQC report, comparing characteristics of three datasets: one real single-cell RNA-seq dataset (Original) and two datasets simulated using the real dataset as the underlying source of population parameters (powsim, splat). (A) BCV (biological coefficient of variation) as a function of average expression level, both calculated by edgeR (Robinson et al., 2010). (B) Distribution of library sizes (total count sum) across all cells. (C) Distribution of average expression levels (log count per million, as calculated by edgeR) across all genes. (D) Distribution of the fraction of zeros across all genes. (E) Relationship between the average expression level (log count per million) and the fraction of zeros for all genes
4 Conclusions
With the countsimQC package, we wish to spark a discussion about the importance of evaluating the suitability of synthetic data. We encourage researchers who use synthetic data to draw conclusions to provide a report, such as that generated by countsimQC, as evidence that the synthetic data mimic real data, since this is not always easy to assess from a text description of a simulation model. We note that it is not the first effort in this direction; the compcodeR package (Soneson, 2014) as well as powsim (Vieth et al., 2017) contain functions for summarizing the characteristics of a single dataset, and the splatter package (Zappia et al., 2017) also provides the opportunity to generate figures comparing various aspects of a collection of single-cell RNA-seq datasets. However, to our knowledge it is the first independent, ‘one-stop’ solution to generate an extensive, publishable report comparing multiple count datasets, optionally including the code that was used to generate the plots.
There are of course situations where a high degree of similarity between the synthetic data and real data is less critical. For example, synthetic data are often used to illustrate the ability of algorithms and tools to correctly estimate hyperparameters of underlying data distributions, or to illustrate the influence of changing particular features of a dataset, possibly out of the realistic range, for better understanding of the advantages, disadvantages and sensitivities of the methodology. However, even in such situations we argue that it can be useful, both for the analyst and for the reader, to understand the characteristics of the generated data and how it compares to what would be seen in practice.
Funding
This work was supported by the Forschungskredit of the University of Zurich [grant no. FK-16-107 to C.S.].
Conflict of Interest: none declared.
References
- Ewels P. et al. (2016) MultiQC: summarize analysis results for multiple tools and samples in a single report. Bioinformatics, btw354. [DOI] [PMC free article] [PubMed] [Google Scholar]
- Robinson M.D. et al. (2010) edger: a bioconductor package for differential expression analysis of digital gene expression data. Bioinformatics, 26, 139–140. [DOI] [PMC free article] [PubMed] [Google Scholar]
- Shalek A.K. et al. (2014) Single-cell RNA-seq reveals dynamic paracrine control of cellular variation. Nature, 509, 363–369. [DOI] [PMC free article] [PubMed] [Google Scholar]
- Soneson C. (2014) compcoder – an R package for benchmarking differential expression methods for RNA-seq data. Bioinformatics, 30, 2517–2518. [DOI] [PubMed] [Google Scholar]
- Soneson C., Robinson M.D. (2017) Bias, robustness and scalability in differential expression analysis of single-cell RNA-Seq data. bioRxiv, doi:10.1101/143289. [DOI] [PubMed]
- Vieth B. et al. (2017) powsim: power analysis for bulk and single cell RNA-seq experiments. bioRxiv, doi:10.1101/117150. [DOI] [PubMed]
- Zappia L. et al. (2017) Splatter: simulation of single-cell RNA sequencing data. Genome Biol., 18, 174. [DOI] [PMC free article] [PubMed] [Google Scholar]