

Abstract
The ATLAS (Altered TCR Ligand Affinities and Structures) database (https://zlab.umassmed.edu/atlas/web/) is a manually curated repository containing the binding affinities for wild-type and mutant T cell receptors (TCRs) and their antigens, peptides presented by the major histocompatibility complex (pMHC). The database links experimentally measured binding affinities with the corresponding three dimensional (3D) structures for TCR-pMHC complexes. The user can browse and search affinities, structures, and experimental details for TCRs, peptides, and MHCs of interest. We expect this database to facilitate the development of next-generation protein design algorithms targeting TCR-pMHC interactions. ATLAS can be easily parsed using modeling software that builds protein structures for training and testing. As an example, we provide structural models for all mutant TCRs in ATLAS, built using the Rosetta program. Utilizing these structures, we report a correlation of 0.63 between experimentally measured changes in binding energies and our predicted changes.
Keywords: binding energy, protein modeling, scoring functions, adaptive immunity, 3D viewer, Rosetta
INTRODUCTION
The binding of a T cell receptor (TCR) to an antigenic peptide presented by a major histocompatibility complex (pMHC) is a fundamental step in cell-mediated immunity. To eliminate pathogens and diseased cells, TCRs recognize foreign antigens displayed by MHC molecules on the surface of antigen presenting cells 1, 2 (Fig 1a). This recognition triggers T cell activation and an ensuing signaling cascade that leads to an antigen-directed cellular immune response.
Fig. 1.
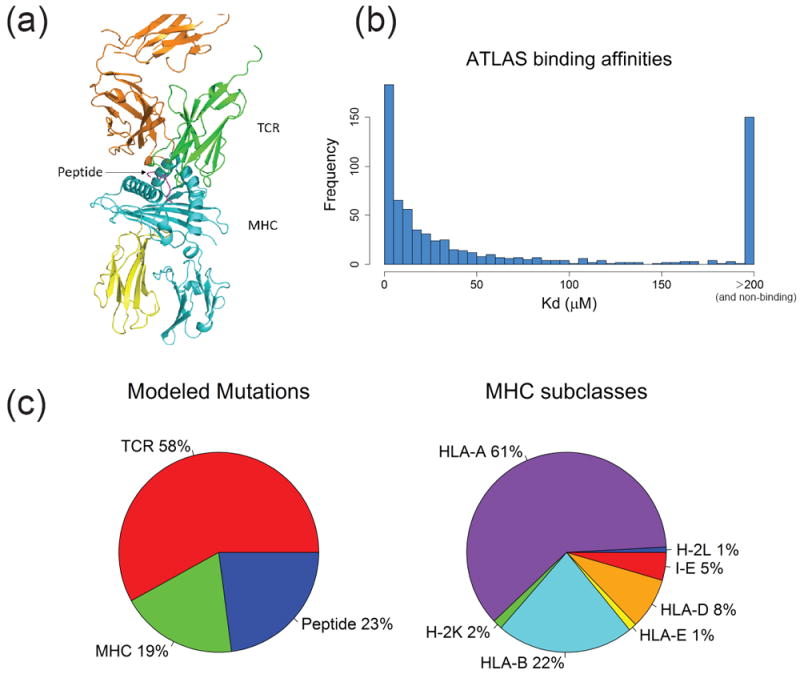
ATLAS data statistics. (a) A6/Tax/HLA-A*02:01 TCR-pMHC complex (PDB: 1AO7). TCR α and β chains (green, orange), MHC molecule (cyan), peptide (magenta), and β2 microglobulin (yellow) are shown in cartoon style. (b) Histogram of the binding affinities of TCR-pMHC complexes in ATLAS. (c) Pie charts for percentage of entries with modeled mutations made to the TCR, the MHC or the peptide (left), percentage of MHC subclasses (right).
The ability to manipulate TCR-pMHC recognition has broad applications in a variety of biomedical arenas. One example is adoptive T cell transfer, which uses tumor-recognizing T cells to eradicate cancer cells3. The TCRs of these T cells can be genetically engineered to enhance their affinities toward specific tumor antigens 4-6. In a related approach, high affinity TCRs can be used as soluble biologic therapeutics to target tumor-associated antigens 7. Another example is peptide-based vaccination, which uses peptides to selectively stimulate T cells capable of battling infections or cancers 8. Many tumor-associated peptides are derived from self proteins and are only weakly immunogenic because TCRs that strongly recognize self-antigens have been eliminated during negative selection in the thymus. Thus attempts have been made to develop modified peptides that can selectively enhance T cell activation 9, 10.
TCR-pMHC binding strength is an important parameter in determining the quality of the ensuing immune response. TCR affinity has been shown to correlate positively with T cell activation 11, 12; however, robust immune responses appear to result from TCR affinities in an optimal range, which is not necessarily high 13. Past an apparent affinity threshold, the strength of the T cell response may plateau or attenuate.
Another consideration while striving for a desirable immune response is to avoid the cross-recognition of TCRs with foreign and self peptides, which can lead to autoimmune diseases, such as multiple sclerosis, type 1 diabetes, and paraneoplastic syndromes 14, 15. Before any potential therapeutic use of T cells, it is vital to identify off-target binding 16; this is particularly important for engineered TCRs, as demonstrated by adverse events in clinical trials 5, 6.
Precise prediction and manipulation of both TCR affinity and specificity is therefore essential for designing effective T-cell–based therapeutics. A number of methods have been developed for altering TCR-pMHC interactions, including in vitro molecular evolution and structure-guided protein design 4, 17-22. Structure-guided design algorithms can alter affinity and specificity directly and efficiently, but are limited by the accuracy of their scoring functions.
Prediction of protein-protein binding affinity from protein complex structure is a challenging problem. When nine unique scoring functions developed for docking programs or web servers were tested on a benchmark of 81 protein complexes, correlations between scores and binding affinities were low or nonexistent (r ranging from -0.18 to 0.32) 23. More recent studies utilizing supervised learning methods have increased correlations between predicted and experimental affinities, and there is still room for improvement 24, 25. Prediction of changes in binding energy due to point mutations has seen greater success. Correlations between predicted and experimental ΔΔG in a study analyzing over 1,500 point mutations ranged from 0.28 to 0.61 depending on the prediction method used 26. Progress in ΔΔG prediction is critical to the field of TCR design where point mutants may be made to increase a TCR’s affinity toward an antigen to trigger a robust immune response.
The improvement of TCR design algorithms requires access to both structural and binding data. We have built the ATLAS (Altered TCR Ligand Affinities and Structures) database (https://zlab.umassmed.edu/atlas/web/) to meet this demand. ATLAS links measurements of TCR affinity with structural information, and allows a user to query for a TCR, MHC, or peptide of interest. Results from such queries include details on affinity, mutation information, and structures of associated TCR-pMHC complexes that exist in the Protein Data Bank 27. ATLAS includes structural and binding data for point-mutant TCRs that have been studied. If PDB structures for the relevant mutant complexes are not available, the database provides computationally modeled TCR-pMHC structures.
The Immune Epitope Database (IEDB) 28 and the AntiJen Database 29 both provide binding affinities for TCR-pMHC complexes; however, these databases are peptide-epitope-centric and do not allow the user to query specific TCRs. Furthermore, there is no direct link between affinity and structural data in these databases. The IEDB does allow the user to filter queries based on the availability of X-ray crystallography and surface plasmon resonance (SPR) experiments; however, in many cases a query using one peptide epitope will return multiple TCR-pMHC complexes that contain the peptide. Hence, to correctly match a TCR-pMHC complex with its reported binding affinity, the user needs to manually inspect the literature.
In comparison with IEDB and AntiJen, ATLAS allows the user to search specific TCRs, MHCs, and peptides. Full datasets in ATLAS can also be downloaded as flat files. With the goal of providing a repository to train and test next generation TCR design strategies and scoring functions, ATLAS also provides experimental details such as the resolutions of the structures and references for each of its entries. As low-resolution structural data may skew scoring results, this information will be critical for the selection of a subset of the data to optimize prediction algorithms. As of this writing, the database includes data only for αβ TCRs, but can be readily extended as more experimental data for the γδ TCR family becomes available.
MATERIALS AND METHODS
Data Collection
To collect data suitable for training and testing TCR-pMHC scoring functions, we required all ATLAS entries to meet the following two criteria: (1) The affinity of the TCR-pMHC must be measured experimentally with purified proteins (most frequently) using SPR or isothermal titration calorimetry (ITC); and (2) The 3D structure of the complex has been determined experimentally, or for mutants, a template wild-type structure exists in the PDB. In order to provide the most comprehensive list of TCR-pMHC complexes, we did not make any quality restrictions pertaining to the affinity or structure data; instead, we recorded the resolution of crystallographic structures in the full dataset flat files available in the Downloads page. To identify TCR-pMHC complexes for inclusion in ATLAS, we first found all crystallographic structures of TCR-pMHC complexes in the IMGT database 30 verified by a careful inspection of the corresponding PDB entries. We next manually searched the literature for experiments measuring the affinity of each TCR-pMHC complex, including measurements with TCR or MHC mutants and/or peptide variants. If we could identify quantitative data on binding affinity, we then proceeded to include the TCR-pMHC complex in ATLAS, along with experimental details as metadata for the entry. We describe these metadata fields in the following sections.
Metadata Fields
As many of the binding experiments recorded in ATLAS tested the effects of mutations on TCR-pMHC affinity, it follows that the majority of ATLAS entries pair mutant affinity data with wild-type template structures as opposed to the actual mutant TCR-pMHC complexes to which the binding affinities refer. Thus we recorded detailed information on the mutations such that one could build a 3D structure model of the mutant complex that corresponded to the affinity data, given the template structure. With this application in mind, the data tables of ATLAS are designed not only for information, but also for easy parsing by protein design software. The following five fields represent the information required for modeling a mutant TCR-pMHC complex structure from a template structure.
TCR mutation: <wild-type residue><residue number><mutant residue>
TCR mutation chain: <chain>; A for α or B for β chain
MHC mutation: <wild-type residue><residue number><mutant residue>
MHC mutation chain: <chain>; A for α chain B for β chain
Peptide mutation: <wild-type residue><residue number><mutant residue>
Some fields may be left empty if one or more molecules in the template structure are the same as the molecules used to measure affinity. In the case of a complete match between the complex structure and the complex tested for binding, all mutation fields may be left empty. As mentioned previously, all entries are required to have at least a template structure and in some cases both experimental and template structures for mutants exist. These cases could be particularly helpful in assessing the accuracy of the structural modeling.
Inconsistent chain naming, structure boundaries, and prevalence of water molecules complicate the design and scoring process. To overcome these challenges, we also supply a set of files for all experimentally determined TCR-pMHC structures in ATLAS with the following consistency adjustments: renaming of chains, truncation of chains to the binding domains, and removal of water molecules. When there were multiple complexes in the asymmetric unit of a crystal structure, the first complex was selected.
Protein Modeling
As a proof of principle, we wrote a script to parse ATLAS and build models using Rosetta for all listed mutations upon the adjusted template structures. These models were built using the fixed backbone design option of Rosetta, fixbb, and are available for download. The example parser script, ‘build_models.py’, is also available at the github site of ATLAS (https://github.com/weng-lab/ATLAS). Although this example is specific for design via the Rosetta protein modeling software, the ATLAS database can be easily integrated with any other design software.
Regression Analysis
Many ATLAS entries have low affinities with unreliable ΔGs or undetectable binding. Hence, we assigned all entries with a ΔG > -5.05 kcal/mol (KD > 200 μM) and all non-binding entries to have ΔG = -5.05 for the regression analysis.
The following equation was used to calculate ΔG for each independent variable in the regression model:
| (1) |
where ΔGCOMPLEX is the energy of a feature in the regression model for the TCR-pMHC complex and ΔGTCR and ΔGpMHC are the energies of a feature for the isolated TCR structure and isolated pMHC structure, respectively.
Similarly, we use the following equation to define ΔΔG for changes in energy upon mutation:
| (2) |
where ΔGWT is the ΔG for a wild type TCR-pMHC entry and ΔGMUT is the ΔG for a mutated version of the wild type (mutations may involve multiple residues).
Coefficients for the regression models were estimated by the ordinary least squares method. P-values were calculated from the t-statistics of the coefficients using a two tailed t-test. All regression calculations were made using the python statistics module statsmodels.
Architecture
The backend of ATLAS was built using the archetypal web service solution stack, LAMP, consisting of Linux (Ubuntu version 14.04), Apache (version 2.4.7), MySQL (version 5.5.41) and PHP (version 5.5.9). The front end was designed using the Bootstrap framework (version 3.3.5). All programs related to ATLAS are available at github (https://github.com/weng-lab/ATLAS).
RESULTS
The ATLAS database currently contains affinity and structural data on human and mouse TCR-pMHC complexes, with a total of 694 measured affinities ranging from high nanomolar affinities to low affinities with KD > 200 μM (Fig. 1b-c). As more affinity data exist in comparison to structural data, ATLAS also contains a set of models for all TCR-pMHC affinity entries lacking crystal structures (see Methods). Below we first illustrate a usage case for the data in ATLAS, then we describe how to query the ATLAS database via the web interface.
Using the Data in ATLAS to Develop Energy Functions
As a proof of concept, we performed multiple linear regression using ATLAS data to develop scoring functions capable of affinity prediction. We examined two cases of energy prediction: prediction of TCR-pMHC binding energy, ΔG, and prediction of change in binding energy upon mutation, ΔΔG (see Methods). Prior to regression analysis, no correlation was found between experimental and predicted ΔGs (or ΔΔGs) using the Rosetta modeling software’s standard scoring function 31. Eight energy terms from Rosetta —solvation, hydrogen bonding expressed in four terms, attractive and repulsive van der Waals, and a statistical pair potential—were used in the regression model (Fig. 2a).
Fig. 2.
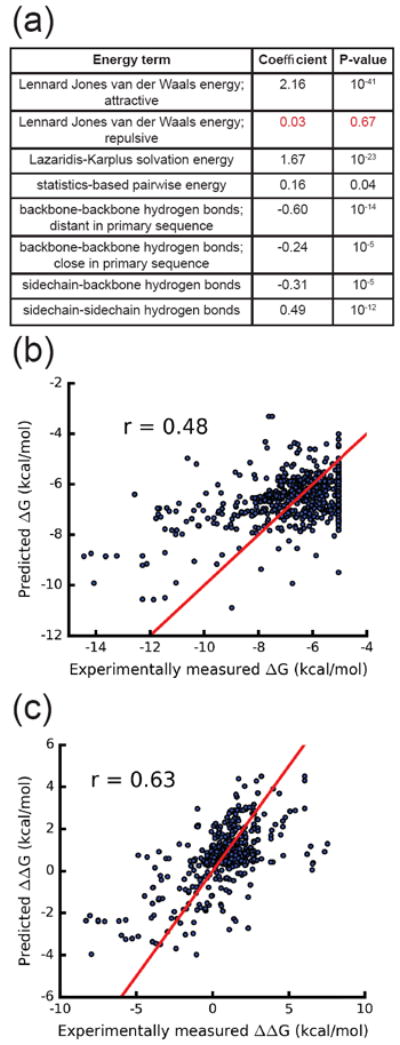
Results of predicting binding free energies in ATLAS. (a) Table of coefficients and p-values for all energy features of the regression analysis. One insignificant feature (repulsive van der Waals) is highlighted in red. (b) Scatterplot of predicted ΔG versus ΔG determined by SPR for all ATLAS entries. Linear regression analysis was performed to predict ΔG using the following features: attractive van der Waals energy, Lazaridis-Karplus solvation energy and all four hydrogen bond energy terms. r = 0.48 and RMSE = 1.48 kcal/mol. (c) Scatterplot of predicted ΔΔG versus ΔΔG determined by SPR for 575 mutant ATLAS entries determined by regression analysis using the following features: attractive van der Waals energy, Lazaridis-Karplus solvation energy and sidechain-sidechain hydrogen bond energy. r = 0.63 and RMSE = 1.58 kcal/mol. Red line represents perfect prediction.
Performing leave-one-out cross-validation (LOO-CV) on all 694 ATLAS entries, we report a correlation of 0.65 between predicted ΔG and experimentally measured ΔG with a root mean square error (RMSE) of ~1.09 kcal/mol. However, many of the ATLAS entries differed by only a few residues and used the same PDB structure as the template for structure modeling. To accurately assess scoring function performance, we ran a cross-validation scheme where the training set for each prediction excluded any entries that used the same PDB structure as the template to model the structures. For example, many ATLAS entries were mutants of the A6-Tax/HLA-A2 TCR-pMHC complex and used the 1AO7 PDB structure as the template for modeling the mutant structures. For prediction of any of these mutants, we exclude from the training set all other mutants that were also modeled using 1AO7 as the template. Following this leave-one-complex-out cross-validation (LOCO-CV) scheme, we report a correlation r of 0.45 between experimental and predicted ΔGs and an RMSE of 1.52 kcal/mol.
The attractive van der Waals energy along with the solvation energy were the most important features for prediction, judged by the p-values for these features (10-41 and 10-23). We asked whether steric clashes in the modeled structures might have caused the poor performance of the repulsive van der Waals term. However, even after removing outlier entries with unfavorable repulsive van der Waals terms from the regression model, the coefficient for the repulsive van der Waals term remained insignificant. To extract the best predicting combination of features, we implemented LOCO-CV on all 255 combinations of the eight energy features. A slight increase in performance was seen when the van der Waals repulsive and pair potential terms were removed from the regression model, r = 0.48 and RMSE = 1.48 kcal/mol (Fig. 2b).
We then proceeded to build multiple linear regression models for prediction of ΔΔGs. We included all multiple residue mutation cases in this study; however, 73% of the ΔΔG mutations were single residue mutations. Following the LOCO-CV scheme and analyzing all feature combinations, we report the maximal correlation of 0.63 between experimental and predicted ΔΔG with an RMSE of 1.58 kcal/mol (Fig. 2c). This best performing model used only the attractive van der Waals energy, solvation energy, and side-chain–side-chain hydrogen bond energy to predict ΔΔG.
Given that the majority of structural data used for training in the regression model was designed via Rosetta, we assessed the accuracy of these modeled structures. Twenty-one out of the 694 ATLAS entries had both wildtype and mutant crystal structures available (Table S1). Seven of these 21 entries were point mutations to residues with at least one side-chain dihedral angle (χ). The other 14 entries were either point mutations to Ala or were complexes designed with multiple mutations. We used these seven entries to evaluate the accuracy of the modeled mutant structures in ATLAS. The Dunbrack rotamer library was used to assess whether Rosetta designed mutant side chains had the same rotamers as those of the mutant crystal structures 32. Here, a side chain conformation is defined as one of the combinations of multiple χ angle conformations for a side chain. We found that four of the seven mutant side chains were of identical conformation to the side chain in the crystal structure. For two of the three side chains with incorrect conformations, only the terminal χ angle was inaccurate (χ2 in Asp and χ3 in Glu). Hence, only one side chain, a mutation from Val to Arg, was completely mismodeled (Table S2). Although this is only a small sample of the entire dataset, it provides some evidence that the majority of the designed ATLAS mutations have correctly modeled side chain conformations.
The modeled TCR-pMHC complexes from the regression analysis were generated using a fixed backbone approach. However, the complementarity-determining region (CDR) loops of TCRs can change conformations upon binding with pMHC 33-35. To assess whether modeling flexibility of CDR loops could improve affinity prediction performance, we also generated another set of modeled complexes via the Rosetta backrub application which accounted for flexibility of the CDR loops. These structures were then employed in our LOCO-CV scheme. Analyzing all features combinations, we saw a modest reduction in ΔG prediction performance, r = 0.45 and RMSE = 1.50 kcal/mol for the set of best performing features. A larger reduction in performance was found in prediction of ΔΔG, r = 0.47 and RMSE = 1.80 kcal/mol (compared with r = 0.63 and RMSE = 1.58 kcal/mol for the fixed backbone approach) (Fig. S1). This result was not entirely surprising as previous studies have reported poorer correlations when modeling backbone flexibility compared with using fixed backbone calculations 36.
Although there is room for improvement, TCR-pMHC binding affinity prediction is feasible through the use of the structural information in ATLAS. As a starting point for engineering TCRs, peptides, or MHCs to enhance binding affinity, the ATLAS database is a useful resource to guide the design process.
The Web-based User Interface of ATLAS
As many users may be only interested in a specific TCR or peptide, ATLAS provides a searchable interface so that the user can extract the relevant data of interest. To browse the entire ATLAS dataset, the user may simply submit a search leaving all fields with their default parameters.
As a demo, we queried for all entries that contain the human A6 TCR, the MHC allele HLA-A*02:01, and a peptide whose amino sequence contained LFGYPVY, with binding free energies lower than -6 kcal/mol (Fig. 3a). Note that the user may also search ATLAS by specifying TRAV or TRBV genes, as well as MHC allele or class. Submission of the search form brings the user to the results page (Fig. 3b). Each ATLAS entry (row) of the search results corresponds to a unique TCR-pMHC complex with an experimentally determined binding affinity and a 3D structure which can be used as a template for design. The binding affinity is reported in both KD (μM) and ΔG (kcal/mol). The PDB column provides the PDB ID for a structure matching the TCR-pMHC complex with the reported experimental binding affinity. For many entries an exact structure corresponding to the recorded binding affinity does not exist. To make use of such binding data, the Template PDB column refers to the PDB ID for a template structure for which a TCR-pMHC complex matching the reported binding affinity may be generated by modeling the mutations described in the TCR mutation, MHC mutation, and Peptide mutation columns of the entry. For further information on each entry, the results page provides a link to the abstract of the publication in which the binding affinity was determined in the PMID column. Lastly, the query results can be downloaded as individual files directly from the results page.
Fig. 3.
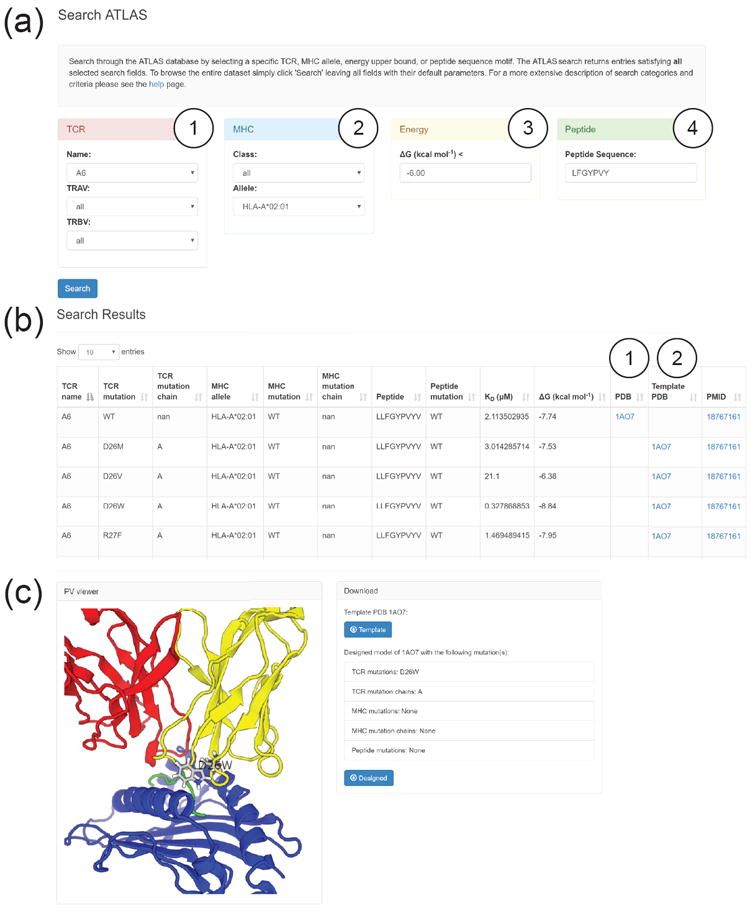
ATLAS web interface and data accession. (a) The search page for querying the ATLAS database. ATLAS is searchable by TCR (1) and MHC (2) features, binding energies ΔG below a user specified kcal/mol (3) and by case-insensitive peptide sequence motifs (4). (b) The search results page linking binding energies to complex structures. The PDB structure specified in (1) refers to a structure identical to the TCR-pMHC used in the binding assay. The template PDB structure in (2) can be designed to replicate the TCR-pMHC used in the binding assay by modeling the mutations listed in the TCR mutation, MHC mutation, and Peptide mutation columns. (c) Protein Viewer and individual PDB downloads. An example shows the selection of PDB ID 1AO7 from the Template PDB column for the D26W TCR mutant. Template structures and Rosetta designed structures are both available for download.
Selecting a PDB ID from the results page brings the user to the PV Javascript Protein Viewer 37 and downloadable PDB content. Continuing the demo, we selected the template PDB 1AO7 for the D26W TCR mutant from our previous results page (Fig. 3c). The Rosetta modeled mutant structure is displayed in the PV viewer. The modeled mutant tryptophan side chain of the TCR is highlighted in ball-and-stick style in the protein complex. From this page the user can download the individual template PDB complex along with the Rosetta-designed mutant PDB complex, both structures adjusted for consistency as described in the Methods.
Downloading Data Tables of ATLAS
The Downloads page provides the four tables used to build ATLAS in Microsoft Excel format. The TCR gene table contains the TRAV and TRBV genes for all TCRs in ATLAS. The MHC class table contains the classes for all MHC alleles. The ATLAS table provides all of the structural and affinity data for each ATLAS entry and is the extended version of tables found by browsing or searching the web interface. Lastly, we also provide the set of consistency adjusted TCR-pMHC structures described earlier, TCR-pMHC structures, which contain the template PDB structures and the mutant structures. We provide two sets of mutant structures: (1) structures predicted using the fixed backbone approach and (2) structures predicted allowing flexibility in CDR loops via the Rosetta backrub application. All mutant structures are generated using the mutation information recorded in ATLAS.
DISCUSSION
The multiple search parameters of ATLAS make it particularly useful for studying specific subsets of TCR or MHC. One recent application involved identifying TCRs that recognized the human Class I MHC allele HLA-A*02:01 and TCRs that recognized human Class I MHC alleles that were not HLA-A*02:01. The links to PDB structures were used to make structural comparisons between the two groups of TCRs 38. Additionally, the option to search entries by TRAV/TRBV genes, MHC allele, and peptide sequence allow for comparisons to be made involving these parameters. For example, searching by a variable chain segment can allow the user to compare the effects that mutations within the shared chain have on binding affinity. The accumulation of affinity values for all published binding studies also allows for the identification of potentially important residues for pMHC recognition. Similarly, searching by peptide sequence can identify all TCRs known to recognize a particular peptide (or a substring of residues in a peptide), as well as how mutations on the peptide impact TCR binding.
As a further example to demonstrate the utility of a large TCR database, ATLAS was recently used in a separate study to identify single point mutations when training a generalized approach for engineering TCRs 39. In this study, nearly 200 point mutations in multiple HLA-A2 restricted TCRs (A6, B7, DMF5, DMF4) and one HLA-B8 restricted TCR (LC13) were modeled using Rosetta and utilized in a multiple linear regression model. Using Rosetta energy terms and molecular dynamics-derived flexibility terms as predictor variables and the experimental binding energies as the response variable, a score function was parameterized which emphasized van der Waals forces, solvation effects, and flexibility. This score function was rigorously cross-validated and found to estimate the effects of any given mutation relative to wild type with an average error of less than 1.5 kcal/mol and was used to identify additional affinity enhancing mutations in the B7, DMF5, and DMF4 TCRs.
CONCLUSION
We have developed the ATLAS database as a centralized resource to link structural and binding data for TCR-pMHC complexes, with an emphasis on the impacts of mutations within TCR-pMHC interfaces. The database can be queried multiple ways, and when structures do not exist, ATLAS provides modeled structures, as well as the means to visualize experimental or modeled structures. We anticipate that ATLAS will be useful in the design and optimization of TCRs, including the development of next-generation design algorithms for TCR-pMHC interactions. It can also be used in combination with other large datasets of structural and affinity data, such as the AB-Bind database of antibody affinities 40, which would be useful in structure-based immune receptor design. Beyond this, the database may serve as a resource for studies aiming to correlate structural and biophysical binding data with immunological outcomes.
Supplementary Material
Binding free energy prediction results when CDR loop flexibility is modeled in training structures. (a) Scatterplot of predicted ΔG versus ΔG determined by SPR for all ATLAS entries. Linear regression analysis was performed to predict ΔG using the following features: attractive van der Waals energy, Lazaridis-Karplus solvation energy and backbone-backbone short range hydrogen bond energy. r = 0.45 and RMSE = 1.50 kcal/mol. (b) Scatterplot of predicted ΔΔG versus ΔΔG determined by SPR for 575 mutant ATLAS entries determined by regression analysis using the following features: attractive van der Waals energy, repulsive van der Waals energy, statistics-based pairwise energy and Lazaridis-Karplus solvation energy. r = 0.47 and RMSE = 1.80 kcal/mol. Red line represents perfect prediction.
Acknowledgments
This work was supported by research grants from the National Institutes of Health (NIH)GM103773 and GM118166. Thanks to Hannah Marie Williams for aid and advice in graphic design for the ATLAS site and Thom Vreven for analytical input and review of the manuscript.
References
- 1.Zinkernagel RM, Doherty PC. Restriction of in vitro T cell-mediated cytotoxicity in lymphocytic choriomeningitis within a syngeneic or semiallogeneic system. Nature. 1974;248:701–710. doi: 10.1038/248701a0. [DOI] [PubMed] [Google Scholar]
- 2.Babbitt BP, Allen PM, Matsueda G, Haber E, Unanue ER. Binding of immunogenic peptides to Ia histocompatibility molecules. Nature. 1985;317:359–361. doi: 10.1038/317359a0. [DOI] [PubMed] [Google Scholar]
- 3.Restifo NP, Dudley ME, Rosenberg SA. Adoptive immunotherapy for cancer: harnessing the T cell response. Nat Rev Immunol. 2012;12(4):269–281. doi: 10.1038/nri3191. [DOI] [PMC free article] [PubMed] [Google Scholar]
- 4.Varela-Rohena A, Molloy PE, Dunn SM, Li Y, Suhoski MM, Carroll RG, Milicic A, Mahon T, Sutton DH, Laugel B, Moysey R, Cameron BJ, Vuidepot A, Purbhoo MA, Cole DK, Phillips RE, June CH, Jakobsen BK, Sewell AK, Riley JL. Control of HIV-1 immune escape by CD8 T cells expressing enhanced T-cell receptor. Nat Med. 2008;14(12):1390–1395. doi: 10.1038/nm.1779. [DOI] [PMC free article] [PubMed] [Google Scholar]
- 5.Linette GP, Stadtmauer Ea, Maus MV, Rapoport AP, Levine BL, Emery L, Litzky L, Bagg A, Carreno BM, Cimino PJ, Binder-Scholl GK, Smethurst DP, Gerry AB, Pumphrey NJ, Bennett AD, Brewer JE, Dukes J, Harper J, Tayton-Martin HK, Jakobsen BK, Hassan NJ, Kalos M, June CH. Cardiovascular toxicity and titin cross-reactivity of affinity-enhanced T cells in myeloma and melanoma. Blood. 2013;122(6):863–871. doi: 10.1182/blood-2013-03-490565. [DOI] [PMC free article] [PubMed] [Google Scholar]
- 6.Morgan RA, Chinnasamy N, Abate-Daga D, Gros A, Robbins PF, Zheng Z, Dudley ME, Feldman SA, Yang JC, Sherry RM, Phan GQ, Hughes MS, Kammula US, Miller AD, Hessman CJ, Stewart AA, Restifo NP, Quezado MM, Alimchandani M, Rosenberg AZ, Nath A, Wang T, Bielekova B, Wuest SC, Akula N, McMahon FJ, Wilde S, Mosetter B, Schendel DJ, Laurencot CM, Rosenberg SA. Cancer regression and neurological toxicity following anti-MAGE-A3 TCR gene therapy. J Immunother. 2013;36(2):133–151. doi: 10.1097/CJI.0b013e3182829903. [DOI] [PMC free article] [PubMed] [Google Scholar]
- 7.Oates J, Jakobsen BK. ImmTACs. Oncoimmunology. 2013;2(2):e22891. doi: 10.4161/onci.22891. [DOI] [PMC free article] [PubMed] [Google Scholar]
- 8.Purcell AW, McCluskey J, Rossjohn J. More than one reason to rethink the use of peptides in vaccine design. Nat Rev Drug Discov. 2007;6(5):404–414. doi: 10.1038/nrd2224. [DOI] [PubMed] [Google Scholar]
- 9.Chen J-L, Stewart-Jones G, Bossi G, Lissin NM, Wooldridge L, Choi EML, Held G, Dunbar PR, Esnouf RM, Sami M, Boulter JM, Rizkallah P, Renner C, Sewell A, vanderMerwe PA, Jakobsen BK, Griffiths G, Jones EY, Cerundolo V. Structural and kinetic basis for heightened immunogenicity of T cell vaccines. J Exp Med. 2005;201(8):1243–1255. doi: 10.1084/jem.20042323. [DOI] [PMC free article] [PubMed] [Google Scholar]
- 10.Cole DK, Edwards ESJ, Wynn KK, Clement M, Miles JJ, Ladell K, Ekeruche J, Gostick E, Adams KJ, Skowera A, Peakman M, Wooldridge L, Price DA, Sewell AK. Modification of MHC anchor residues generates heteroclitic peptides that alter TCR binding and T cell recognition. J Immunol. 2010;185(4):2600–2610. doi: 10.4049/jimmunol.1000629. [DOI] [PMC free article] [PubMed] [Google Scholar]
- 11.Holler PD, Kranz DM. Quantitative analysis of the contribution of TCR/pepMHC affinity and CD8 to T cell activation. Immunity. 2003;18(2):255–264. doi: 10.1016/s1074-7613(03)00019-0. [DOI] [PubMed] [Google Scholar]
- 12.Aleksic M, Dushek O, Zhang H, Shenderov E, Chen JL, Cerundolo V, Coombs D, van der Merwe PA. Dependence of T Cell Antigen Recognition on T Cell Receptor-Peptide MHC Confinement Time. Immunity. 2010;32(2):163–174. doi: 10.1016/j.immuni.2009.11.013. [DOI] [PMC free article] [PubMed] [Google Scholar]
- 13.Stone JD, Kranz DM. Role of T cell receptor affinity in the efficacy and specificity of adoptive T cell therapies. Front Immunol. 2013;4:244. doi: 10.3389/fimmu.2013.00244. [DOI] [PMC free article] [PubMed] [Google Scholar]
- 14.Sethi DK, Gordo S, Schubert DA, Wucherpfennig KW. Crossreactivity of a human autoimmune TCR is dominated by a single TCR loop. Nat Commun. 2013;4:2623. doi: 10.1038/ncomms3623. [DOI] [PMC free article] [PubMed] [Google Scholar]
- 15.Wooldridge L, Ekeruche-Makinde J, van den Berg Ha, Skowera A, Miles JJ, Tan MP, Dolton G, Clement M, Llewellyn-Lacey S, Price DA, Peakman M, Sewell AK. A single autoimmune T cell receptor recognizes more than a million different peptides. J Biol Chem. 2012;287(2):1168–1177. doi: 10.1074/jbc.M111.289488. [DOI] [PMC free article] [PubMed] [Google Scholar]
- 16.Obenaus M, Leitão C, Leisegang M, Chen X, Gavvovidis I, van der Bruggen P, Uckert W, Schendel DJ, Blankenstein T. Identification of human T-cell receptors with optimal affinity to cancer antigens using antigen-negative humanized mice. Nat Biotechnol. 2015;33(4):402–7. doi: 10.1038/nbt.3147. [DOI] [PubMed] [Google Scholar]
- 17.Li Y, Moysey R, Molloy PE, Vuidepot A-L, Mahon T, Baston E, Dunn S, Liddy N, Jacob J, Jakobsen BK, Boulter JM. Directed evolution of human T-cell receptors with picomolar affinities by phage display. Nat Biotechnol. 2005;23(3):349–354. doi: 10.1038/nbt1070. [DOI] [PubMed] [Google Scholar]
- 18.Pierce BG, Hellman LM, Hossain M, Singh NK, Vander Kooi CW, Weng Z, Baker BM. Computational design of the affinity and specificity of a therapeutic T cell receptor. PLoS Comput Biol. 2014;10(2):e1003478. doi: 10.1371/journal.pcbi.1003478. [DOI] [PMC free article] [PubMed] [Google Scholar]
- 19.Zoete V, Irving M, Ferber M, Cuendet MA, Michielin O. Structure-based, rational design of T cell receptors. Front Immunol. 2013;4:1–19. doi: 10.3389/fimmu.2013.00268. [DOI] [PMC free article] [PubMed] [Google Scholar]
- 20.Malecek K, Grigoryan A, Zhong S, Gu WJ, Johnson LA, Rosenberg SA, Cardozo T, Krogsgaard M. Specific Increase in Potency via Structure-Based Design of a TCR. J Immunol. 2014;193:2587–2599. doi: 10.4049/jimmunol.1302344. [DOI] [PMC free article] [PubMed] [Google Scholar]
- 21.Borbulevych OY, Piepenbrink KH, Gloor BE, Scott DR, Sommese RF, Cole DK, Sewell AK, Baker BM. T cell receptor cross-reactivity directed by antigen-dependent tuning of peptide-MHC molecular flexibility. Immunity. 2009;31(6):885–896. doi: 10.1016/j.immuni.2009.11.003. [DOI] [PMC free article] [PubMed] [Google Scholar]
- 22.Holler PD, Holman PO, Shusta EV, O’Herrin S, Wittrup KD, Kranz DM. In vitro evolution of a T cell receptor with high affinity for peptide/MHC. Proc Natl Acad Sci U S A. 2000;97(10):5387–5392. doi: 10.1073/pnas.080078297. [DOI] [PMC free article] [PubMed] [Google Scholar]
- 23.Kastritis PL, Bonvin AM. Are scoring functions in protein-protein docking ready to predict interactomes? Clues from a novel binding affinity benchmark. 2010;9(5):2216–2225. doi: 10.1021/pr9009854. [DOI] [PubMed] [Google Scholar]
- 24.Vreven T, Hwang H, Pierce BG, Weng Z. Prediction of protein-protein binding free energies. Protein Sci. 2012;21(3):396–404. doi: 10.1002/pro.2027. [DOI] [PMC free article] [PubMed] [Google Scholar]
- 25.Xue LC, Rodrigues JP, Kastritis PL, Bonvin AM, Vangone A. PRODIGY: a web server for predicting the binding affinity of protein–protein complexes. Bioinformatics. 2016;32(23):3676–3678. doi: 10.1093/bioinformatics/btw514. [DOI] [PubMed] [Google Scholar]
- 26.Geng C, Vangone A, Bonvin AM. Exploring the interplay between experimental methods and the performance of predictors of binding affinity change upon mutations in protein complexes. Protein Eng Des Sel. 2016;29(8):291–299. doi: 10.1093/protein/gzw020. [DOI] [PubMed] [Google Scholar]
- 27.Berman HM, Westbrook J, Feng Z, Gilliland G, Bhat TN, Weissig H, Shindyalov IN, Bourne PE. The Protein Data Bank. Nucleic Acids Res. 2000;28(1):235–242. doi: 10.1093/nar/28.1.235. [DOI] [PMC free article] [PubMed] [Google Scholar]
- 28.Vita R, Overton JA, Greenbaum JA, Ponomarenko J, Clark JD, Cantrell JR, Wheeler DK, Gabbard JL, Hix D, Sette A, Peters B. The immune epitope database (IEDB) 3.0. Nucleic Acids Res. 2015;43(D1):D405–D412. doi: 10.1093/nar/gku938. [DOI] [PMC free article] [PubMed] [Google Scholar]
- 29.Toseland CP, Clayton DJ, McSparron H, Hemsley SL, Blythe MJ, Paine K, Doytchinova IA, Guan P, Hattotuwagama CK, Flower DR. AntiJen: a quantitative immunology database integrating functional, thermodynamic, kinetic, biophysical, and cellular data. Immunome Res. 2005;1(1):4. doi: 10.1186/1745-7580-1-4. [DOI] [PMC free article] [PubMed] [Google Scholar]
- 30.Ehrenmann F, Kaas Q, Lefranc MP. IMGT/3Dstructure-DB and IMGT/DomainGapAlign: a database and a tool for immunoglobulins or antibodies, T cell receptors, MHC, IgSF and MhcSF. Nucleic Acids Res. 2010;38(Database):D301–D307. doi: 10.1093/nar/gkp946. [DOI] [PMC free article] [PubMed] [Google Scholar]
- 31.Leaver-Fay A, Tyka M, Lewis SM, Lange OF, Thompson J, Jacak R, Kaufman K, Renfrew PD, Smith CA, Sheffler W, Davis IW, Cooper S, Treuille A, Mandell DJ, Richter F, Ban Y-EA, Fleishman SJ, Corn JE, Kim DE, Lyskov S, Berrondo M, Mentzer S, Popović Z, Havranek JJ, Karanicolas J, Das R, Meiler J, Kortemme T, Gray JJ, Kuhlman B, Baker D, Bradley P. ROSETTA3: an object-oriented software suite for the simulation and design of macromolecules. Methods Enzymol. 2011;487(11):545–574. doi: 10.1016/B978-0-12-381270-4.00019-6. [DOI] [PMC free article] [PubMed] [Google Scholar]
- 32.Shapovalov MV, Dunbrack RL. A smoothed backbone-dependent rotamer library for proteins derived from adaptive kernel density estimates and regressions. Structure. 2011;19(6):844–858. doi: 10.1016/j.str.2011.03.019. [DOI] [PMC free article] [PubMed] [Google Scholar]
- 33.Gagnon SJ, Borbulevych OY, Davis-Harrison RL, Turner RV, Damirjian M, Wojnarowicz A, Biddison WE, Baker BM. T Cell Receptor Recognition via Cooperative Conformational Plasticity. J Mol Biol. 2006;363(1):228–243. doi: 10.1016/j.jmb.2006.08.045. [DOI] [PubMed] [Google Scholar]
- 34.Reiser JB, Grégoire C, Darnault C, Mosser T, Guimezanes A, Schmitt-Verhulst AM, Fontecilla-Camps JC, Mazza G, Malissen B, Housset D. T cell receptor CDR3β loop undergoes conformational changes of unprecedented magnitude upon binding to a peptide/MHC class I complex. Immunity. 2002;16(3):345–354. doi: 10.1016/s1074-7613(02)00288-1. [DOI] [PubMed] [Google Scholar]
- 35.Reiser J-B, Darnault C, Grégoire C, Mosser T, Mazza G, Kearney A, van der Merwe PA, Fontecilla-Camps JC, Housset D, Malissen B. CDR3 loop flexibility contributes to the degeneracy of TCR recognition. Nat Immunol. 2003;4(3):241–247. doi: 10.1038/ni891. [DOI] [PubMed] [Google Scholar]
- 36.Mandell DJ, Kortemme T. Backbone flexibility in computational protein design. Curr Opin Biotechnol. 2009;20(4):420–428. doi: 10.1016/j.copbio.2009.07.006. [DOI] [PubMed] [Google Scholar]
- 37.Marco Biasini. pv: v1.81. 2015.
- 38.Blevins SJ, Pierce BG, Singh NK, Riley TP, Wang Y, Spear TT, Nishimura MI, Weng Z, Baker BM. How structural adaptability exists alongside HLA-A2 bias in the human αβ TCR repertoire. Proc Natl Acad Sci U S A. 2016;113(9):1276–1285. doi: 10.1073/pnas.1522069113. [DOI] [PMC free article] [PubMed] [Google Scholar]
- 39.Riley TP, Ayres CM, Hellman LM, Singh NK, Cosiano M, Cimons JM, Anderson MJ, Piepenbrink KH, Pierce BG, Weng Z, Baker BM. A generalized framework for computational design and mutational scanning of T-cell receptor binding interfaces. Protein Eng Des Sel. 2016;29(12):1–12. doi: 10.1093/protein/gzw050. [DOI] [PMC free article] [PubMed] [Google Scholar]
- 40.Sirin S, Apgar JR, Bennett EM, Keating AE. AB-Bind: Antibody binding mutational database for computational affinity predictions. Protein Sci. 2016;25(2):393–409. doi: 10.1002/pro.2829. [DOI] [PMC free article] [PubMed] [Google Scholar]
Associated Data
This section collects any data citations, data availability statements, or supplementary materials included in this article.
Supplementary Materials
Binding free energy prediction results when CDR loop flexibility is modeled in training structures. (a) Scatterplot of predicted ΔG versus ΔG determined by SPR for all ATLAS entries. Linear regression analysis was performed to predict ΔG using the following features: attractive van der Waals energy, Lazaridis-Karplus solvation energy and backbone-backbone short range hydrogen bond energy. r = 0.45 and RMSE = 1.50 kcal/mol. (b) Scatterplot of predicted ΔΔG versus ΔΔG determined by SPR for 575 mutant ATLAS entries determined by regression analysis using the following features: attractive van der Waals energy, repulsive van der Waals energy, statistics-based pairwise energy and Lazaridis-Karplus solvation energy. r = 0.47 and RMSE = 1.80 kcal/mol. Red line represents perfect prediction.