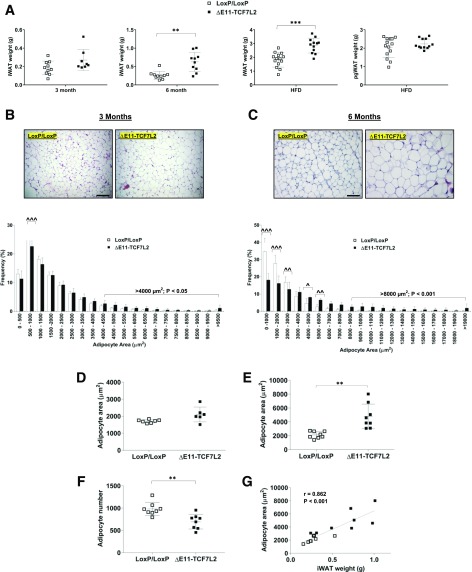
Figure 6.
A: iWAT in male ΔE11-TCF7L2 mice at 3 and 6 months of age (n = 8–10 ΔE11-TCF7L2, n = 8–10 control mice) and iWAT and pgWAT after HFD (n = 12 ΔE11-TCF7L2, n = 14 control mice). **P < 0.01 vs. control mice by Mann-Whitney test; ***P < 0.001 vs. control by t test. Representative hematoxylin and eosin stain and adipocyte size distribution performed on 3-month (B) and 6-month (C) iWAT (scale bar = 100 µm). Average adipocyte area in 3-month-old (n = 6 ΔE11-TCF7L2, n = 7 control mice) (D) and 6-month-old mice (n = 8 ΔE11-TCF7L2, n = 8 control mice) (E) was calculated using Adiposoft. **P < 0.01 vs. control by Welch t test. F: Total number of adipocytes counted in an equal number of histological sections in 6-month-old mice. **P < 0.01 vs. control by t test. G: Correlation between iWAT weight and adipocyte area in 6-month-old mice.

